
ABSTRACT
Identifying tumor-relevant T cell subsets in the peripheral blood (PB) has become a potential strategy for cancer treatment. However, the subset of PB that could be used to treat cancer remains poorly defined. Here, we found that the CX3CR1+ T cell subset in the blood of patients with lung cancer exhibited effector properties and had a higher TCR matching ratio with tumor-infiltrating lymphocytes (TILs) compared to CX3CR1− T cells, as determined by paired single-cell RNA and TCR sequencing. Meanwhile, the anti-tumor activities, effector cytokine production, and mitochondrial function were enhanced in CX3CR1+ T cells both in vitro and in vivo. However, in the co-culture system of H322 cells with T cells, the percentages of apoptotic cells and Fas were substantially higher in CX3CR1+ T cells than those in CX3CR1− T cells. Fas-mediated apoptosis was rescued by treatment with an anti-PD-1 antibody. Accordingly, the combination of adoptive transfer of CX3CR1+ T cells and anti-PD-1 treatment considerably decreased Fas expression and improved the survival of lung xenograft mice. Moreover, an increased frequency of CX3CR1+ T cells in the PB correlated with a better response and prolonged survival of patients with lung cancer who received anti-PD-1 therapy. These findings indicate the promising potential of adoptive transfer of peripheral CX3CR1+ T cells as an individual cancer immunotherapy.
Introduction
Lung cancer is the leading cause of morbidity and mortality worldwide.Citation1–3 Although traditional anticancer strategies are used to treat lung cancer, there is a huge need to explore novel therapies to improve the outcomes of patients with lung cancer.Citation4,Citation5 Recent advances have been made in immune checkpoint inhibitors (ICIs) and adoptive cell therapy (ACT) for malignancies.Citation6–9 A majority of patients with ICI therapy resistance do not benefit from this novel treatment.Citation10,Citation11 In ACT, patients receive an infusion of ex vivo expanded TILs or chimeric antigen receptor T cells (CAR-T) with tumor specificity. For instance, durable regression with TILs has been reported in several types of cancer, including melanoma,Citation7 colorectal,Citation12 breast,Citation13 and lung cancers.Citation14 However, there are challenges associated with this treatment. CAR-T cell therapy against CD19 has been successfully used to treat B-cell lymphomasCitation15–18; A durable therapeutic response has rarely been achieved in CAR-T cell therapies for lung cancer.Citation19–21 Moreover, the absence of stable tumor antigen expression and decreased lymphocyte infiltration are major issues in ACT.Citation22,Citation23 Thus, to overcome these obstacles, innovative therapeutic approaches are urgently required.
Increasing evidence indicates that immune cells frequently target tumor-specific antigens in PB and can be more exploited to develop effective immunotherapy.Citation24–26 Recently, a chemokine receptor CX3CR1 was used to identify “tumor-matching” T cells in PB by paired single-cell RNA and T cell receptor (TCR) sequencing in a mouse model and patients with melanoma.Citation27 CX3CR1 is expressed in T cells and exhibits robust cytotoxicity during anti-tumor responses.Citation28 Furthermore, overexpression of CX3CR1 in CAR-T cells can overcome the immunosuppressive effects of myeloid-derived suppressor cells.Citation29 Moreover, circulating CX3CR1+CD8+ T cells are dynamic biomarkers of the clinical response to anti-PD-1 treatment.Citation30 These findings provide evidence for the clinical application of CX3CR1+ T-cells in immunotherapy. However, it remains unknown whether T cells expanding from CX3CR1+ PB lymphocytes can be used to treat patients with lung cancer as tumor-relevant T cells.
In this study, we detected tumor-matching clones in the PB of patients with lung cancer using single-cell RNA and TCR sequencing. We further identified that CX3CR1+ T cells in PB exhibited robust tumor reactivity in vitro. However, activated CX3CR1+ T cells were more easily to undergo apoptosis owing to the high expression of Fas when cocultured with tumor cells. Furthermore, the anti-PD-1 antibody rescued Fas-mediated apoptosis and enhanced the antitumor efficacy of adoptively transferred CX3CR1+ T-cells in mice. Finally, the expression of CX3CR1 in the PB of patients with lung cancer who received anti-PD-1 therapy was analyzed, and it was verified that the expression of CX3CR1 was associated with the clinical response and survival of patients. Collectively, these results suggest that combining CX3CR1+ T cells in the PB with anti-PD-1 therapy is a promising strategy for improving lung cancer therapy.
Materials and methods
Clinical samples
Patients diagnosed with lung cancer were enrolled for T cell function analysis and single-cell sequencing. Paired blood and tumor tissue samples were collected from these patients. The four patients included three females and one male, aged between 50 and 68 years. The type of tumor is lung adenocarcinoma, and the clinical stages were IA, IA, IIIA, and IA. Blood samples were collected from cancer patients before and after receiving anti-PD-1 antibody treatment, comprising 20 samples from responders (R) and 20 samples from non-responders (NR). The patient characteristics are summarized in . Tumor tissues from 26 lung cancer patients were used for immunofluorescence experiments. The patient characteristics are summarized in Supplementary Table S5. Written informed consent was obtained from all patients and healthy donors, following the guidelines of the Ethical Committee of the First Affiliated Hospital of Zhengzhou University.
Table 1. The clinical characteristics of 40 patients (responder: n = 20, non-responder: n = 20) who received anti-PD-1 therapy.
Mice
Mice (6–8-week-old) were used for all animal experiments. Wild-type (WT) female C57BL/6J and CD45.1 OT-I mice were maintained at the Animal Center of Zhengzhou University in specific pathogen-free facilities under standard housing and husbandry and on a standard diet. All the experimental procedures were approved by the Institutional Animal Care and Use Committee of the First Affiliated Hospital of Zhengzhou University.
Cell lines
The murine LLC-OVA cell line and human lung cancer cell line H322 were grown in DMEM high glucose (Sigma-Aldrich, St. Louis, MO, USA) containing 10% fetal bovine serum (FBS; Lonsera, Uruguay), 100 U/mL penicillin, and 100 μg/mL streptomycin without mycoplasma (DMEM complete medium) at 37°C in a humidified 5% CO2 incubator.
Lymphocyte isolation from human samples
Peripheral blood mononuclear cells (PBMCs) were isolated using a lymphocyte isolation solution (TBD, China) according to the manufacturer’s instructions. Tumor tissues from patients were enzymatically digested using a tumor dissociation kit and GentleMACS (Miltenyi, Germany) to prepare TILs and autologous tumor cells, as previously described.Citation31 CD3+ T cells were sorted using human CD3 MicroBeads (Miltenyi, Germany).
Single cell sequencing
Single-cell suspensions were prepared for Single-cell TCR-seq and 5′ gene expression profiling using the Chromium Single Cell V(D)J Solution from 10X Chromium Platform (10X Genomics). Briefly, 5 mL of fresh blood was collected and PBMCs were isolated using a lymphocyte isolation solution. Fresh tumor samples were enzymatically digested to obtain single-cell suspensions. CD3+ T cells from four paired tumor tissue and blood samples were sorted as previously described. The purity of CD3+ T cells was approximately 85%. All subsequent steps were performed according to the manufacturer’s protocols.
Data processing, filtering, and normalization
Raw reads were processed using Cellranger 3.0.2 (10 × Genomics) to generate raw count matrices of gene expression and CSV files corresponding to the TCR clonality. The scRNA-seq reads were aligned with the GRCh38 reference genome. For each sample, row count data were filtered using the following parameters: features ranging from 300 to 6000, gene counts ranging from 500 to 50,000, a mitochondrial ratio of less than 25%, and a hemoglobin gene ratio of less than 5%. Filtered counts were log-normalized, and 3000 variable genes were selected as highly variable genes. The data were then scaled using the ScaleData function with default parameters in Seriation.
Unsupervised cell clustering and cell type annotation
Canonical Correlation Analysis was used to integrate all samples, and the top 20 principal component analyses were used to identify neighboring components. Resolution 0.9 was used to cluster cells in the first cycle, and they were visualized using Uniform Manifold Approximation and Projection (UMAP). Non-T-cells and low-quality cells were excluded from the analysis. A total of 14 clusters of cells were selected. The marker gene of each cluster was analyzed using the FindAllMarkers() function, with genes expressed in > 25% of the cells, log2 fold change (FC) > 0.5, and p < .05 in Seriation.
TCR analysis
R package “scRepertoire” was used to identify the unique TCR for each CD8+ T cell in tumor tissue and PB. Tumor-matching (TM) cells were defined as having the same TCR in the tumor tissue and PB. To identify TM cell markers, count data from this study and GSE99254 in the Gene Expression Omnibus (GEO) were transformed into Transcripts Per Million. R package “limma” was used to analyze the differently expressed genes (DEGs) with threshold of |log2FC|≥ 1 and adjust p-value <.05 between TM and non-TM cells. The DEGs from both datasets overlapped, and the top 20 overlapping DEGs based on the adjusted p-value are shown as a bar plot. CX3CR1-positive cells were defined as those with CX3CR1 levels > 1. TM cells among CX3CR1+ and CX3CR1− T cells were selected based on the same TCR shared in the tumor tissue and PB, and the remaining cells were non-TM cells. The proportion of TM cells was defined as the number of TM cells to that of CX3CR1+ and CX3CR1− cells in the PB.
Exploring the function of CX3CR1+ and CX3CR1− T cells
Normalized count data were used to compare the expression of genes related to naïve, effector, costimulatory, and coinhibitory functions. Single-sample gene set enrichment analysis (GSEA) was used to analyze the activation and exhaustion states of CX3CR1+ and CX3CR1− T cells in tumor tissue and PB using the gene expression data listed in Supplementary Table S1. The significant DEGs were selected based on the threshold of |log2FC|≥ 1 and adjust p-value < .05.
Immunofluorescence
Immunofluorescence was performed on tumor tissues from 26 patients with lung cancer (Xinchao Biotechnology Co., Ltd., Shanghai, China). In brief, we simultaneously labeled tumor tissues with CD3 (abcam, ab135372) and CX3CR1 (proteintech 13,885–1-AP) antibodies, along with their corresponding fluorescent secondary antibodies. We then scanned the stained results and analyzed the co-expression pattern of CD3 and CX3CR1.
Human CX3CR1+ and CX3CR1− T cell isolation and culture
CD3+ T cells from PBMCs were purified using the Pan T Cell Isolation Kit (human, Miltenyi) and were activated with T Cell TransAct (Miltenyi, Germany) and IL-2 (200 IU/mL) for 2 days. For sorting CX3CR1+ and CX3CR1− cells, the activated CD3+ T cells were stained with PE anti-CX3CR1 human antibody. Then, anti-PE microbeads (Miltenyi, Germany) were added in double volume, and the CD3+CX3CR1+ and CD3+CX3CR1− cells were sorted according to the manufacturer’s instructions. CX3CR1+ T and CX3CR1− T cells were cultured in RPMI 1640 (Sigma, USA) containing 10% FBS and IL-2 for 3 days to assess their function.
In vitro cytotoxicity assay
Tumor cells were incubated with PB CX3CR1+ T, CX3CR− T cells, or TILs at effector: target (E:T) ratio = 5:1. Anti-human PD-1 blocking antibodies (Clone J116; BioXCell) were added at a final concentration of 20 μg/mL for 24 h. Tumor lysis or T cells apoptosis were stained by Annexin-V and PI. CD107a, Fas, and intracellular granzyme B in T cells and FasL in H322 cells were stained with fluorochrome-conjugated antibodies.
Tumor inoculation
LLC-OVA cells were subcutaneously injected (s.c.) into WT mice. Tumor growth was monitored every two days. The tumor volume was calculated using the following formula: tumor volume = length × (width2)/2.
Lymphocyte isolation from mice
CD3+ T cells from spleens of OT-1 mice were purified using the mouse CD3ε MicroBead Kit (Miltenyi, German) and were incubated with CD3 antibody (clone 145-2C11, 5 μg/mL, Biolegend), CD28 antibody (clone 37.51, 2 μg/mL, Biolegend), and IL-2 for 3 days. CX3CR1+ and CX3CR1− cells were sorted from CD3+ T cells, as previously described, using a PE anti-CX3CR1 mouse antibody.
Treatment regimens
For ACT, mice were intravenously (i.v.) treated 7 days post-tumor injection with 1 × 10⁶ in vitro-activated CD3+, CD3+CX3CR1+, CD3+CX3CR1− cells or TILs. For PD-1 blockade, anti-PD-1 Ab (#BE0146,Bio X Cell) or PBS were intraperitoneally (i.p.) administered every three days starting from 3 days after ACT at a dose of 200 μg/mouse.
Flow cytometry
Single cells were labeled with antibodies against surface molecules for 15 min at 4°C. Dead cells were labeled with viability staining (Fixable Viability Dye eF506, eBioscience). For intracellular cytokine detection, cells were stimulated with PMA (50 ng/mL, Sigma) and ionomycin (750 ng/mL, Solarbio) in the presence of Brefeldin A Solution (1000×, Biolegend) for 6 h. After stimulation, the cells were fixed with fixative (Servicebio) for 30 min, followed by 1× Intracellular Staining Perm Wash Buffer (Biolegend), then labeled with antibodies. Samples were analyzed using an FACS Canto II flow cytometer (BD Biosciences, USA) and DxFLEX (Beckman Coulter, China). Fluorochrome-conjugated antibodies are listed in Supplementary Table S2.
Mitochondrial activity and ATP production rate measured by Seahorse
Human CD3+CX3CR1+ and CD3+CX3CR1− cells were seeded in XFe96 plates (5 × 10⁵ cells per well), and their oxygen consumption rates (OCR) were measured using an XFe96 Extracellular Flux Analyzer (Seahorse Bioscience) as previously described.Citation32 Basal OCR, OCR coupled with ATP production, and spare respiratory capacity (SRC) were automatically calculated using the Seahorse machine operating software (Wave).
Measurement of mitochondrial mass (MM) and low membrane potential (MMPlow)
Blood from patients was used to detect the mitochondrial mass and MMPlow of T cells by flow cytometry, as previously described.Citation33 Briefly, CD8 and CX3CR1 antibodies were added to blood and incubated for 15 min. Hemolysin were used to dissolve the red blood cells. Cell suspension (200 μL) was aspirated for counting. The remaining cells were washed and re-suspended in a tube containing MitoTracker-APC (UBBIO Co., Ltd., China), incubated at 37°C, then analyzed by flow cytometry. The MM parameters were calibrated using a human lymphocyte mitochondrial function analysis system.
Mitochondrial area statistics
The CX3CR1+ T and CX3CR1− T cells isolated from PB of patients and spleens of OT-I mice were fixed in electron microscopy fixative for subsequent transmission electron microscopy observation (Wuhan Servicebio Technology Co., Ltd., China). Multiple mitochondria were chosen from each image to gauge their area (μm2), and the average area of each mitochondrion per image was calculated.
Western blot analysis
The cells were lysed in RIPA lysis buffer supplemented with protease inhibitor (Sigma, USA). The supernatant was mixed with a loading buffer and denatured at 100°C. Subsequently, the proteins were separated on SDS-PAGE gels (DAKEWE, China) and transferred onto nitrocellulose membranes (GE life, USA). Non-specific binding sites were blocked and the membranes were incubated with primary antibodies and then incubated with the secondary antibodies, and the blots were visualized by chemiluminescence. Primary antibodies: β-Actin (Cell Signaling Technology, 8H10D10, 1:1000), Fas/CD95 (proteintech 13,098–1-AP, 1:2000), and cleaved caspase-3 (Asp175) (5A1E) Rabbit monoclonal antibody (Cell Signaling Technology, #9664, 1:1000).
Statistical analyses
Unpaired Student’s t-test was used to compare independent groups. Two-tailed paired t-test was used to compare molecule expression between CX3CR1+/− T cells. Two-way analysis of variance (ANOVA) was performed to determine the significance of tumor growth, and survival curves were analyzed using the logrank Mantel-Cox test. All statistical analyses were performed using the GraphPad Prism 9 software. Statistical significance is shown as *(p < .05), **(p < .01), ***(p < .001), and **** (p < .0001); ns indicates no significance (p > .05).
Results
Characterization of tumor-matching T cells in the PB
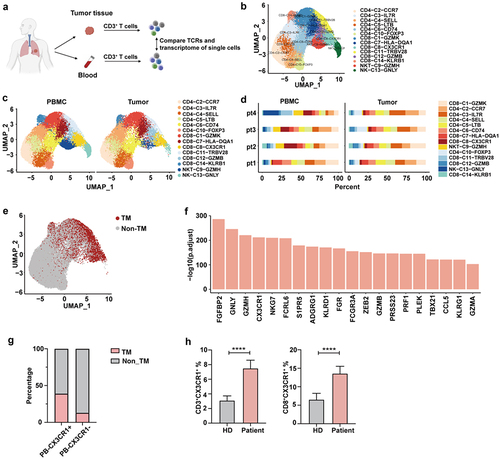
To identify the marker of “tumor-matching” T cell in the PB, we performed single-cell RNA and paired TCR sequencing of T cells isolated from tumor tissue and PB for four treatment-naïve patients (). After quality control 41,085 cells were used in this study. Unsupervised clustering using UMAP revealed 14 cell clusters based on canonical markers and DEGs, including six CD8 clusters, six CD4 clusters, one natural killer T cell (NKT) cluster, and one NK cell cluster (, Supplementary Figure S1, Supplementary Table S3). We observed that most cell clusters were shared between the tumor and PB, whereas the ratios varied, indicating substantial heterogeneity, as observed in the TME (). We found a considerable proportion of TM cells in PB, defined as T cells that share the same TCR as that of TILs (). To identify the markers of these TM cells, we compared DEGs between TM and non-TM cells using the public GEO dataset (Supplementary Table S4). Among these DEGs, CX3CR1 was highly ranked as a cell surface gene (). In line with these results, CX3CR1+ T cell in PB shared a higher TCR with TILs than that of CX3CR1− T cells, suggesting that CX3CR1 could be a marker of “tumor-matching” T cell in PB (). We next detected the expression of CX3CR1 in PB by flow cytometry and found that both CD3+ and CD8+ T cell populations showed increased expression of CX3CR1 in patients with lung cancer compared with that in healthy donors (). These results suggest that the CX3CR1+ T-cell subset in the blood corresponds to similar clones in the tumor and may be relevant for tumor killing.
Figure 1. The characterization of T cells with TCRs in the blood.
Expression signatures in CX3CR1+ subset predict T cell anti-tumor function
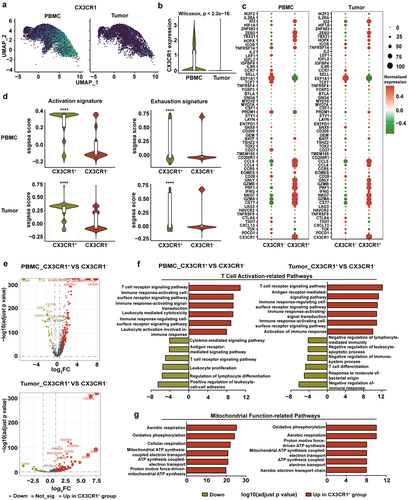
Next, we analyzed CX3CR1 expression and found that CX3CR1 was highly expressed in the PB and was distributed in various clusters in both the PB and tumors (). CX3CR1+ T cells displayed a higher level of effector gene signature and lower level of exhausted gene signature than those of CX3CR1− T cells both in the PB and tumor (). We further analyzed the DEGs between CX3CR1+ and CX3CR1− T cells in the PB and tumor tissue (). Pathway enrichment analysis revealed that the T cell activation-related pathways (such as the T cell receptor signaling pathway and immune response activation signal transduction) were upregulated in CX3CR1+ T cells compared to those in CX3CR1− T cells both in the PB and tumor (). Furthermore, mitochondrial function-related pathways in CX3CR1+ T cells (such as oxidative phosphorylation and ATP synthesis-coupled electron transport) were substantially upregulated, and this finding was supported by GSEA (, Supplementary Figure S2). Analysis of tumor tissues from 26 lung cancer patients showed that patients with higher infiltration of CD3+CX3CR1+ T cells had significantly longer survival than those with lower infiltration (Supplementary Figure S3a and S3b). These findings demonstrate that CX3CR1+ T cells may have anti-tumor functions by upregulating cytotoxicity-related genes and activation pathways.
Figure 2. Characterization of tumor-matching T cells in peripheral blood.
Peripheral CX3CR1+ T cells exhibit the properties of activated effector cells
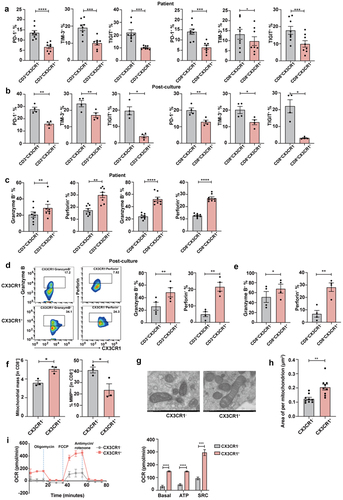
To further investigate the anti-tumor properties of CX3CR1+ T cells, we first detected the expression of inhibition markers, such as PD-1, TIM-3, and TIGIT in T cells derived from patients with lung cancer before and after culture. Our results showed that the expression of these inhibitory markers was decreased in CX3CR1+ T cells when compared with that in CX3CR1− T cells (). Meanwhile, the secretion of pro-inflammatory cytokines, including granzyme B and perforin, was substantially increased in the CD3+CX3CR1+ T cell subset before and after culture, as well as in CD8+CX3CR1+ T cells (). There is increasing evidence that the measurement of mitochondria-associated parameters may help identify T cells with longer survival and better anti-tumor function.Citation34–36 Here, we used MitoTracker to evaluate the MM and MMPlow of peripheral CX3CR1+ T cells. MM refers to the effective protein content in the mitochondrial respiratory chain, which reflects the actual strength of the immunity of the body, whereas MMP refers to the voltage difference between the inside and outside of the mitochondrial membrane, which reflects the instantaneous state of the immune function of the body. The results showed that CX3CR1+ T cells from the PB exhibited a substantial reduction in MMPlow while exhibiting a higher MM (), indicating that they were in an immune-activated state. Importantly, the average area per mitochondrion in CX3CR1+ T cells was increased (), indicating that these cells contained high-quality mitochondria. Finally, we examined the metabolism of CX3CR1+ T cells and found that basal OCR, ATP, and SRC were also substantially enhanced in this subset compared to that in CX3CR1− T cells (). These results indicate that T cells expressing CX3CR1 display better effector functions.
Figure 3. Peripheral CX3CR1+ T cells exhibit properties of activated effector cells.
CX3CR1+ T cells display robust anti-tumor reactivity ability and decreased Fas-mediated apoptosis by anti-PD-1 antibody
To confirm whether the CX3CR1+ T cell subset exerts a potent ability to kill tumors, a cytotoxicity assay was performed based on the co-incubation of peripheral CX3CR1+ T cells with paired tumor cells from patients with lung cancer. The CX3CR1− T cells and TILs served as control (). We found that the autologous tumor cell lysis rate of the PB CX3CR1+ group was higher than that of the PB CX3CR1− group (). CD107a, a marker of cytotoxicity, and granzyme B production were also substantially increased in the PB CX3CR1+ and TILs groups (). Further functional analysis revealed that the lysis rate of non-paired tumor cells or H322 cells in the PB CX3CR1+ group was higher than that in the PB CX3CR1− group (). CD107a and granzyme B levels were similar in the PB CX3CR1+ group. However, when co-incubated with unpaired tumor cells, no difference was detected in CD107a expression between the PB CX3CR1+ and PB CX3CR1− groups (). Taken together, our findings indicate that the cytotoxicity of CX3CR1+ T cells in the PB is superior to that of CX3CR1− T cells.
Figure 4. CX3CR1+ T cells display robust anti-tumor reactivity ability and decrease Fas-mediated apoptosis by anti-PD-1 antibody.
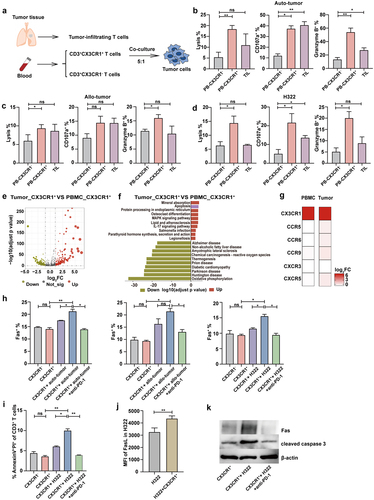
Considering the decreased number of CD8-C8-CX3CR1 clusters in tumors, we further analyzed the DEGs between peripheral and tumor-derived CX3CR1+ T cells (). Pathway analysis of DEGs revealed that the apoptotic pathway was more active in tumors than that in blood (). Additionally, no significant differences were observed in chemokine receptor expression between CX3CR1+ and CX3CR1− T cells in both the PB and tumor tissues (). These results suggest that the lower abundance of the CX3CR1 subpopulation in tumor tissues may be attributed to apoptosis during the process of tumor resistance. Fas/FasL signaling can induce activation-induced cell death (AICD), and caspase-3 plays an important role in this pathway.Citation37–39 To determine whether Fas mediated the apoptosis of CX3CR1+ T cells, we co-cultured this subset with auto/allo-tumor cells and H322 cells. Our results suggest that after co-incubation with tumor cells, the expression of Fas is higher in T cells from the CX3CR1+ group than that in the CX3CR1− group, and the anti-PD-1 antibody can alleviate this increase in Fas expression (). Additionally, after co-incubation with H322 cells, the apoptosis of T cells increased in the CX3CR1+ group, and the expression of FasL in H322 cells also increased (). This suggests that the Fas/FasL signaling pathway mediates CX3CR1+ T cell death. Furthermore, anti-PD-1 antibody inhibited cell death (). Western blot results also confirmed the previous findings by showing changes in the expression of Fas and cleaved caspase-3 in the different groups (). Thus, we found that CX3CR1+ T cells derived from the PB exhibited superior anti-tumor capabilities in vitro compared to those of CX3CR1− T cells. Additionally, the application of an anti-PD-1 antibody decreased the percentage of apoptosis in CX3CR1+ T cells compared to that in tumor cells.
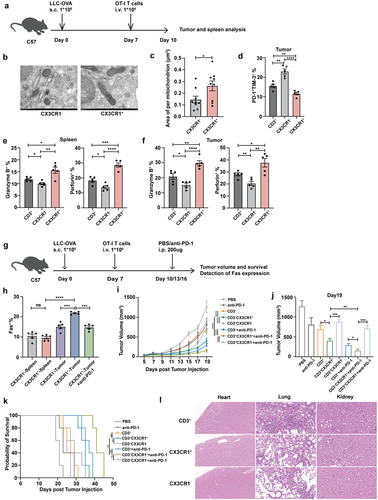
Combination therapy with CX3CR1+ T cells and anti-PD-1 therapy in a lung cancer mouse model
Next, we investigated the in vivo anti-tumor efficacy of CX3CR1+ T cells, sorted CX3CR1+ T and CX3CR1− T cells from the spleen of OT-I mice, and adoptively transferred them to LLC-OVA tumor-bearing mice (). We measured the mitochondrial area of T cells before infusion, CX3CR1+ T cells displayed a higher area per mitochondrion (). Subsequently, we examined the function of transferred T cells in tumor-bearing mice and found that T cells from CX3CR1+ group expressed lower levels of PD-1+TIM-3+ () and produced more granzyme B and perforin than that from CX3CR1− and CD3+ group (). The H&E staining results showed that the necrosis of tumor tissue in the CX3CR1+ T cell treatment group is more severe compared to the other two groups (Supplementary Figure S4). To further assess whether the combination therapy showed better efficacy in the lung cancer mouse model, we assessed overall survival (OS) and Fas expression following treatment with an anti-PD-1 antibody and CX3CR1+ or CX3CR1− T cells (). We observed that the expression of Fas was increased in tumorous T cells from the CX3CR1+ group compared to that from the CX3CR1− group, but the anti-PD-1 antibody reduced Fas expression (). Moreover, the tumor volume in the CX3CR1+ T cell treatment group was substantially smaller than that in the CX3CR1− group. When combined with anti-PD-1 therapy, the anti-tumor function was enhanced (). The OS of mice treated with CX3CR1+ T cells and the anti-PD-1 antibody also substantially improved (). However, there was no significant difference in tumor growth and survival between mice treated with CX3CR1+ T cells and those treated with TILs (Supplementary Figure S5). Considering the clinical applications of CX3CR1+ T cells, the safety of this subset was evaluated. After administering CX3CR1+ T cells to mice, no significantly greater side effects were evident in their heart, lung, and kidney tissues in comparison to the other two treatment groups (). These results indicate that the combination of CX3CR1+ T cells and anti-PD-1 antibody treatment induces an enhanced immune response against cancer cells.
Figure 5. Combination therapy with CX3CR1+ T cells and anti-PD-1 therapy in lung cancer mouse model.
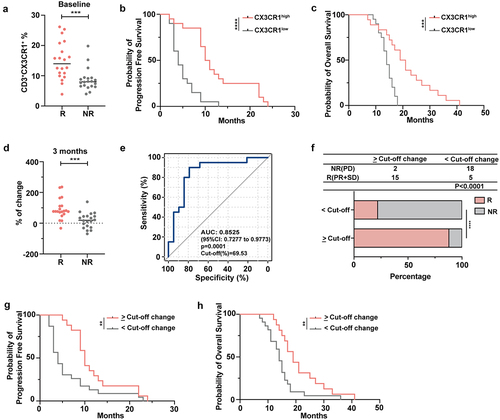
The frequency of circulating CX3CR1+ T cells correlates with effective ICI therapy
An increase in the percentage of peripheral CX3CR1+CD8+ T cells early after the initiation of anti-PD-1 treatment correlated with the response and OS of patients with non-small cell lung cancer (NSCLC).Citation40 To further validate the role of peripheral CX3CR1+ T cells in patients with lung cancer who received ICI therapy, we detected the expression of CX3CR1 in the PB before and after four cycles of treatment. We found that the frequency of CX3CR1 was higher in patients with R than in those with NR at baseline (). In addition, based on the expression ratio of CX3CR1 in CD3+ T cells and patient prognosis, an ROC curve was generated (with an area under the curve (AUC) of 83.03%), and an optimal cutoff score of 9.5% was determined (data not shown). A CX3CR1 expression ratio > 9.5% was classified as CX3CR1high and < 9.5% as CX3CR1low. The results showed that the CX3CR1high group had longer progression-free survival (PFS) and OS than those of the CX3CR1low group (). To confirm the effect of anti-PD-1 antibody treatment on CX3CR1 expression levels, we calculated the ratio of (expression proportion after four cycles of treatment – baseline expression proportion) to the baseline expression proportion to visualize the change in CX3CR1 expression. The results showed that the change in the value in the R group was significantly higher than that in the NR group (). Next, the AUC and corresponding 95% confidence interval (CI) were obtained using a logistic regression model as well as the optimal cutoff score (69.53%) for discriminating between groups using Youden’s index criterion (). As shown in , in the change score >69.53% group, the proportion of R was higher than that of NR, whereas in the change score <69.53% group, the results were reversed. The median PFS and OS among patients with a change score of <69.53% were 4.55 and 12.9 months respectively, whereas the median PFS and OS among patients with a change score > 69.53% were 12.95 and 20.3 months, respectively. Taken together, CX3CR1 expression was highly correlated with the clinical response and survival of patients with lung cancer treated with ICI therapy. Therefore, CX3CR1+ T cell therapy combined with anti-PD-1 therapy may be a promising strategy for immunotherapy.
Figure 6. The frequency of circulating CX3CR1+ T cells correlates with effective ICI therapy.
Discussion
Although ACT for solid tumors has received enormous scientific and clinical attention,Citation41 achieving efficacy with tumor-specific T cells has proven challenging. Identifying biomarkers of tumor-reactive T-cell subsets in the PB from patients with malignancy using TCR and single-cell RNA sequencing could provide a novel noninvasive strategy to develop personalized therapies. Combination biomarkers, such as CD39, NKG2D, and CX3CR1, can be used to detect the “tumor-matching” component from the blood of patients with melanoma.Citation27 However, the characteristics and efficacy of these T cell subsets for potential immunotherapy are still not understood. In our study, to validate whether cell surface markers of the PB could be used to identify tumor-reactive T cells in patients with lung cancer, paired blood and tumor samples were analyzed using single-cell sequencing. We found that CX3CR1+ T cells in the PB shared more overlapping clones with paired TILs. Moreover, this subset exhibited higher expression levels of activated gene signatures and T cell activation-related pathways than those of CX3CR1− T cells both in the PB and tumor, suggesting that CX3CR1+ T cells from the PB were positively associated with anti-tumor function. Zwijnenburg et al. reported that the graded expression of CX3CR1 affects the T cell differentiation spectrum in humans.Citation42 Herein, we observed that CX3CR1+ T cells in the PB from patients with lung cancer displayed low levels of expression of inhibitory markers. Furthermore, effector cytokine secretion was increased in this subset, as previously reported. However, given that surgical treatment is typically not an option for lung cancer patients with advanced stages, the samples we utilized primarily originated from early-stage patients. In our future study, we will try our best to collect samples from patients with advanced stages for analysis.
It is important to point out that mitochondria play a crucial role in regulating T cell fate and activation.Citation43 For instance, linoleic acid enhanced the T cell cytotoxicity by improving the ability of oxidative phosphorylation.Citation44 Importantly, dysfunctional TILs showed a loss of mitochondrial mass and confirmed damage in the OCR.Citation45–47 Our data indicate that the pathways of oxidative phosphorylation and copulated electron transport were upregulated in CX3CR1+ T cells, which may be associated with the high quality of mitochondrial function in these T cells. We further confirmed the cytotoxicity of CX3CR1+ T cells by co-culture with tumor cells, and our encouraging results showed that peripheral CX3CR1+ T cells have a strong killing ability for tumor cells. However, the overactivation of T cells can lead to AICD, in which the Fas/FasL signaling pathway plays an important role.Citation48,Citation49 Herein, we observed that the expression of Fas in CX3CR1+ T cells co-cultured with tumor cells was substantially elevated as well as the apoptotic cells. Blocking the PD-1/PD-L1 interaction can rescue Fas-mediated T cell apoptosis.Citation50 Therefore, the effect of anti-PD-1 therapy in combination with CX3CR1+ T cells was evaluated in vitro and in vivo. We found that both tumor growth and Fas expression were inhibited by adoptive transfer of CX3CR1+ cells together with an anti-PD-1 antibody. Moreover, CX3CR1+ T cells were positively associated with the survival of lung cancer mouse models and the response of patients with lung cancer treated with anti-PD-1 therapy. Although minor inflammation was observed in the lungs of mice, CX3CR1+ T cells did not exhibit more pronounced pulmonary toxicity compared to CD3+ T cell treatment. Given that our study prioritized the antitumor effects of CX3CR1+ T cells, a thorough investigation of bone marrow toxicity was not conducted. In future studies, we will place greater emphasis on toxicity assessment. Taken together, these findings provide compelling evidence that peripheral CX3CR1+ T cells combined with anti-PD-1 antibodies can be used for ACT.
Conclusions
Our findings demonstrated that peripheral CX3CR1+ T cells from lung cancer patients show a higher TCR matching ratio with TILs. In vitro experiments have demonstrated that CX3CR1+ T cells possessed greater effector function than that of CX3CR1− T cells, possibly owing to their superior mitochondrial function and oxidative respiration capacity. In addition, both in vivo and in vitro studies have confirmed the strong anti-tumor activity of CX3CR1+ T cells, and the combination with anti-PD-1 treatment alleviated activation-induced apoptosis. Therefore, the use of peripheral CX3CR1+ T cells in combination with anti-PD-1 therapy may be a potential therapeutic strategy against ACT.
Abbreviations
| PB, | = | peripheral blood; |
| TCR, | = | T cell receptor; |
| TILs, | = | tumor-infiltrating lymphocytes; |
| ICIs, | = | immune checkpoint inhibitors; |
| ACT, | = | adoptive cell therapy; |
| CAR-T, | = | chimeric antigen receptor T cells; |
| R, | = | responders; |
| PR, | = | partial response; |
| SD, | = | stable disease; |
| NR, | = | non-responders; |
| WT, | = | wild type; |
| FBS, | = | fetal bovine serum; |
| PBMCs, | = | peripheral blood mononuclear cells; |
| UMAP, | = | uniform manifold approximation and projection; |
| TM, | = | tumor-matching; |
| GEO, | = | gene expression omnibus; |
| DEGs, | = | differently expressed genes; |
| GSEA, | = | gene set enrichment analysis; |
| MM, | = | mitochondrial mass; |
| MMP, | = | mitochondrial membrane potential; |
| OCR, | = | oxygen consumption rate; |
| SRC, | = | spare respiratory capacity; |
| NKT, | = | natural killer T cell; |
| AICD, | = | activation-induced cell death; |
| NSCLC, | = | non-small-cell lung cancer; |
| AUC, | = | area under the curve; |
| PFS, | = | progression-free survival; |
| OS, | = | overall survival; |
| CI, | = | confidence interval; |
| GO, | = | gene ontology. |
Contributors
Y.Z. and S.L.Y. designed the study; C.C.L., Z.Z., and Q.F.C. performed the experiments; H.W., J.R.L., Y.Q.L., X.Z., J.Y.L., Y.P., and J.Q.S. helped with the experiments. Q.T.Z. analyzed the bioinformatics data. C.C.L., Z.Z., H.W., and Q.T.Z. prepared the manuscript.
Supplemental Material
Download MS Excel (29.2 KB)Revised Supplementary tables and figures.docx
Download MS Word (3 MB)Disclosure statement
No potential conflict of interest was reported by the author(s).
Supplementary material
Supplemental data for this article can be accessed online at https://doi.org/10.1080/2162402X.2024.2355684.
Additional information
Funding
References
- Hirsch FR, Scagliotti GV, Mulshine JL, Kwon R, Curran WJ, Wu Y-L, Paz-Ares L. Lung cancer: current therapies and new targeted treatments. Lancet. 2017;389(10066):299–14. doi:10.1016/S0140-6736(16)30958-8.
- Lahiri A, Maji A, Potdar PD, Singh N, Parikh P, Bisht B, Mukherjee A, Paul MK. Lung cancer immunotherapy: progress, pitfalls, and promises. Mol Cancer. 2023;22(1):40. doi:10.1186/s12943-023-01740-y.
- Sung H, Ferlay J, Siegel RL, Laversanne M, Soerjomataram I, Jemal A, Bray F. Global cancer statistics 2020: GLOBOCAN estimates of incidence and mortality worldwide for 36 cancers in 185 countries. CA Cancer J Clin. 2021;71(3):209–249. doi:10.3322/caac.21660.
- Katiyar V, Chesney J, Kloecker G. Cellular therapy for lung cancer: focusing on Chimeric Antigen Receptor T (CAR T) cells and Tumor-Infiltrating Lymphocyte (TIL) therapy. Cancers Basel. 2023;15(14):15(14. doi:10.3390/cancers15143733.
- Siegel RL, Miller KD, Wagle NS, Jemal A. Cancer statistics, 2023. CA Cancer J Clin. 2023;73(1):17–48. doi:10.3322/caac.21763.
- Komuro H, Shinohara S, Fukushima Y, Demachi-Okamura A, Muraoka D, Masago K, Matsui T, Sugita Y, Takahashi Y, Nishida R. et al. Single-cell sequencing on CD8+TILs revealed the nature of exhausted T cells recognizing neoantigen and cancer/testis antigen in non-small cell lung cancer. J Immunother Cancer. 2023;11(8). doi:10.1136/jitc-2023-007180.
- Rosenberg SA, Yang JC, Sherry RM, Kammula US, Hughes MS, Phan GQ, Citrin DE, Restifo NP, Robbins PF, Wunderlich JR. et al. Durable complete responses in heavily pretreated patients with metastatic melanoma using T-cell transfer immunotherapy. Clin Cancer Res. 2011;17(13):4550–4557. doi:10.1158/1078-0432.CCR-11-0116.
- Hamid O, Robert C, Daud A, Hodi FS, Hwu W-J, Kefford R, Wolchok JD, Hersey P, Joseph RW, Weber JS. et al. Safety and tumor responses with lambrolizumab (Anti–PD-1) in Melanoma. N Engl J Med. 2013;369(2):134–144. doi:10.1056/NEJMoa1305133.
- Lasvergnas J, Naigeon M, Chouahnia K, Zelek L, Chaput N, Duchemann B. Adoptive cell therapies in thoracic malignancies. Cancer Immunol Immunother. 2022;71(9):2077–2098. doi:10.1007/s00262-022-03142-3.
- Liu B, Hu X, Feng K, Gao R, Xue Z, Zhang S, Zhang Y, Corse E, Hu Y, Han W. et al. Temporal single-cell tracing reveals clonal revival and expansion of precursor exhausted T cells during anti-PD-1 therapy in lung cancer. Nat Cancer. 2022;3(1):108–121. doi:10.1038/s43018-021-00292-8.
- Zhang Z, Zhang C, Luo Y, Wu P, Zhang G, Zeng Q, Wang L, Yang Z, Xue L, Zheng B. et al. m(6)A regulator expression profile predicts the prognosis, benefit of adjuvant chemotherapy, and response to anti-PD-1 immunotherapy in patients with small-cell lung cancer. BMC Med. 2021;19(1):284. doi:10.1186/s12916-021-02148-5.
- Tran E, Robbins PF, Lu Y-C, Prickett TD, Gartner JJ, Jia L, Pasetto A, Zheng Z, Ray S, Groh EM. et al. T-Cell transfer therapy targeting mutant KRAS in cancer. N Engl J Med. 2016;375(23):2255–2262. doi:10.1056/NEJMoa1609279.
- Zacharakis N, Chinnasamy H, Black M, Xu H, Lu Y-C, Zheng Z, Pasetto A, Langhan M, Shelton T, Prickett T. et al. Immune recognition of somatic mutations leading to complete durable regression in metastatic breast cancer. Nat Med. 2018;24(6):724–730. doi:10.1038/s41591-018-0040-8.
- Creelan BC, Wang C, Teer JK, Toloza EM, Yao J, Kim S, Landin AM, Mullinax JE, Saller JJ, Saltos AN. et al. Tumor-infiltrating lymphocyte treatment for anti-PD-1-resistant metastatic lung cancer: a phase 1 trial. Nat Med. 2021;27(8):1410–1418. doi:10.1038/s41591-021-01462-y.
- Ying Z, Huang XF, Xiang X, Liu Y, Kang X, Song Y, Guo X, Liu H, Ding N, Zhang T. et al. A safe and potent anti-CD19 CAR T cell therapy. Nat Med. 2019;25(6):947–953. doi:10.1038/s41591-019-0421-7.
- Porter DL, Levine BL, Kalos M, Bagg A, June CH. Chimeric antigen receptor–modified T cells in chronic lymphoid leukemia. N Engl J Med. 2011;365(8):725–733. doi:10.1056/NEJMoa1103849.
- Schuster SJ, Svoboda J, Chong EA, Nasta SD, Mato AR, Anak Ö, Brogdon JL, Pruteanu-Malinici I, Bhoj V, Landsburg D. et al. Chimeric antigen receptor T cells in refractory B-Cell lymphomas. N Engl J Med. 2017;377(26):2545–2554. doi:10.1056/NEJMoa1708566.
- Locke FL, Miklos DB, Jacobson CA, Perales M-A, Kersten M-J, Oluwole OO, Ghobadi A, Rapoport AP, McGuirk J, Pagel JM. et al. Axicabtagene ciloleucel as second-line therapy for large B-Cell Lymphoma. N Engl J Med. 2022;386(7):640–654. doi:10.1056/NEJMoa2116133.
- Gulati P, Rühl J, Kannan A, Pircher M, Schuberth P, Nytko KJ, Pruschy M, Sulser S, Haefner M, Jensen S. et al. Aberrant Lck signal via CD28 costimulation augments antigen-specific functionality and tumor control by redirected T cells with PD-1 blockade in humanized mice. Clin Cancer Res. 2018;24(16):3981–3993. doi:10.1158/1078-0432.CCR-17-1788.
- Chen L, Chen F, Li J, Pu Y, Yang C, Wang Y, Lei Y, Huang Y. CAR-T cell therapy for lung cancer: Potential and perspective. Thorac Cancer. 2022;13(7):889–899. doi:10.1111/1759-7714.14375.
- Ma S, Li X, Wang X, Cheng L, Li Z, Zhang C, Ye Z, Qian Q. Current progress in CAR-T cell therapy for solid tumors. Int J Biol Sci. 2019;15(12):2548–2560. doi:10.7150/ijbs.34213.
- Kiesgen S, Chicaybam L, Chintala NK, Adusumilli PS. Chimeric Antigen Receptor (CAR) T-Cell therapy for thoracic malignancies. J Thorac Oncol. 2018;13(1):16–26. doi:10.1016/j.jtho.2017.10.001.
- Martinez M, Moon EK. CAR T cells for solid tumors: New strategies for finding, infiltrating, and surviving in the tumor microenvironment. Front Immunol. 2019;10:128. doi:10.3389/fimmu.2019.00128.
- Gros A, Parkhurst MR, Tran E, Pasetto A, Robbins PF, Ilyas S, Prickett TD, Gartner JJ, Crystal JS, Roberts IM. et al. Prospective identification of neoantigen-specific lymphocytes in the peripheral blood of melanoma patients. Nat Med. 2016;22(4):433–438. doi:10.1038/nm.4051.
- Cohen CJ, Gartner JJ, Horovitz-Fried M, Shamalov K, Trebska-McGowan K, Bliskovsky VV, Parkhurst MR, Ankri C, Prickett TD, Crystal JS. et al. Isolation of neoantigen-specific T cells from tumor and peripheral lymphocytes. J Clin Invest. 2015;125(10):3981–3991. doi:10.1172/JCI82416.
- Bräunlein E, Lupoli G, Füchsl F, Abualrous ET, de Andrade Krätzig N, Gosmann D, Wietbrock L, Lange S, Engleitner T, Lan H. et al. Functional analysis of peripheral and intratumoral neoantigen-specific TCRs identified in a patient with melanoma. J Immunother Cancer. 2021;9(9):e002754. doi:10.1136/jitc-2021-002754.
- Pauken KE, Shahid O, Lagattuta KA, Mahuron KM, Luber JM, Lowe MM, Huang L, Delaney C, Long JM, Fung ME. et al. Single-cell analyses identify circulating anti-tumor CD8 T cells and markers for their enrichment. J Exp Med. 2021;218(4). doi:10.1084/jem.20200920.
- Gerlach C, Moseman EA, Loughhead SM, Alvarez D, Zwijnenburg AJ, Waanders L, Garg R, de la Torre JC, von Andrian UH. The chemokine receptor CX3CR1 defines three antigen-experienced CD8 T cell subsets with distinct roles in immune surveillance and homeostasis. Immunity. 2016;45(6):1270–1284. doi:10.1016/j.immuni.2016.10.018.
- Trinh T, Adams WA, Calescibetta A, Tu N, Dalton R, So T, Wei M, Ward G, Kostenko E, Christiansen S. et al. CX3CR1 deficiency-induced TIL tumor restriction as a novel addition for CAR-T design in solid malignancies. iScience. 2023;26(4):106443. doi:10.1016/j.isci.2023.106443.
- Yamauchi T, Hoki T, Oba T, Jain V, Chen H, Attwood K, Battaglia S, George S, Chatta G, Puzanov I. et al. T-cell CX3CR1 expression as a dynamic blood-based biomarker of response to immune checkpoint inhibitors. Nat Commun. 2021;12(1):1402. doi:10.1038/s41467-021-21619-0.
- Scheper W, Kelderman S, Fanchi LF, Linnemann C, Bendle G, de Rooij MAJ, Hirt C, Mezzadra R, Slagter M, Dijkstra K. et al. Low and variable tumor reactivity of the intratumoral TCR repertoire in human cancers. Nat Med. 2019;25(1):89–94. doi:10.1038/s41591-018-0266-5.
- Al-Habsi M, Chamoto K, Matsumoto K, Nomura N, Zhang B, Sugiura Y, Sonomura K, Maharani A, Nakajima Y, Wu Y. et al. Spermidine activates mitochondrial trifunctional protein and improves antitumor immunity in mice. Science. 2022;378(6618):eabj3510. doi:10.1126/science.abj3510.
- Wang B, Chen Z, Huang Y, Ding J, Lin Y, Wang M, Li X. Mitochondrial mass of circulating NK cells as a novel biomarker in severe SARS-CoV-2 infection. Int Immunopharmacol. 2023;124(Pt A):110839. doi:10.1016/j.intimp.2023.110839.
- Sukumar M, Liu J, Mehta G, Patel S, Roychoudhuri R, Crompton J, Klebanoff C, Ji Y, Li P, Yu Z. et al. Mitochondrial Membrane Potential Identifies Cells with Enhanced Stemness for Cellular Therapy. Cell Metab. 2016;23(1):63–76. doi:10.1016/j.cmet.2015.11.002.
- Liu X, Peng G. Mitochondria orchestrate T cell fate and function. Nat Immunol. 2021;22(3):276–278. doi:10.1038/s41590-020-00861-6.
- Callender LA, Carroll EC, Bober EA, Akbar AN, Solito E, Henson SM. Mitochondrial mass governs the extent of human T cell senescence. Aging Cell. 2020;19(2):e13067. doi:10.1111/acel.13067.
- Anderson KG, Oda SK, Bates BM, Burnett MG, Rodgers Suarez M, Ruskin SL, Greenberg PD. Engineering adoptive T cell therapy to co-opt Fas ligand-mediated death signaling in ovarian cancer enhances therapeutic efficacy. J Immunother Cancer. 2022;10(3). doi:10.1136/jitc-2021-003959.
- Peter ME, Hadji A, Murmann AE, Brockway S, Putzbach W, Pattanayak A, Ceppi P. The role of CD95 and CD95 ligand in cancer. Cell Death Differ. 2015;22(4):549–559. doi:10.1038/cdd.2015.3.
- Gao T, Huang J, Yin H, Huang J, Xie J, Zhou T, Fan W, Yang X, Gao G, Li Z. et al. Inhibition of extranodal NK/T-cell lymphoma by Chiauranib through an AIF-dependent pathway and its synergy with L-asparaginase. Cell Death Disease. 2023;14(5):316. doi:10.1038/s41419-023-05833-w.
- Abdelfatah E, Long MD, Kajihara R, Oba T, Yamauchi T, Chen H, Sarkar J, Attwood K, Matsuzaki J, Segal BH. et al. Predictive and prognostic implications of circulating CX3CR1+ CD8+ T cells in non–small cell lung cancer patients treated with chemo-immunotherapy. Cancer Res Commun. 2023;3(3):510–520. doi:10.1158/2767-9764.CRC-22-0383.
- Lawrence MS, Stojanov P, Polak P, Kryukov GV, Cibulskis K, Sivachenko A, Carter SL, Stewart C, Mermel CH, Roberts SA. et al. Mutational heterogeneity in cancer and the search for new cancer-associated genes. Nature. 2013;499(7457):214–218. doi:10.1038/nature12213.
- Zwijnenburg AJ, Pokharel J, Varnaitė R, Zheng W, Hoffer E, Shryki I, Comet NR, Ehrström M, Gredmark-Russ S, Eidsmo L. et al. Graded expression of the chemokine receptor CX3CR1 marks differentiation states of human and murine T cells and enables cross-species interpretation. Immunity. 2023;56(8):1955–1974.e10. doi:10.1016/j.immuni.2023.06.025.
- Kurmi K, Liang D, van de Ven R, Georgiev P, Gassaway BM, Han S, Notarangelo G, Harris IS, Yao C-H, Park JS. et al. Metabolic modulation of mitochondrial mass during CD4+ T cell activation. Cell Chem Biol. 2023;30(9):1064–1075.e8. doi:10.1016/j.chembiol.2023.08.008.
- Nava Lauson CB, Tiberti S, Corsetto PA, Conte F, Tyagi P, Machwirth M, Ebert S, Loffreda A, Scheller L, Sheta D. et al. Linoleic acid potentiates CD8+ T cell metabolic fitness and antitumor immunity. Cell Metab. 2023;35(4):633–650.e9. doi:10.1016/j.cmet.2023.02.013.
- Scharping NE, Menk AV, Moreci RS, Whetstone RD, Dadey RE, Watkins SC, Ferris RL, Delgoffe GM. The tumor microenvironment represses T cell mitochondrial biogenesis to drive intratumoral T Cell metabolic insufficiency and dysfunction. Immunity. 2016;45(2):374–388. doi:10.1016/j.immuni.2016.07.009.
- Rizzuto R, De Stefani D, Raffaello A, Mammucari C. Mitochondria as sensors and regulators of calcium signalling. Nat Rev Mol Cell Biol. 2012;13(9):566–578. doi:10.1038/nrm3412.
- Wenner CE. Targeting mitochondria as a therapeutic target in cancer. J Cell Physiol. 2012;227(2):450–456. doi:10.1002/jcp.22788.
- Arakaki R, Yamada A, Kudo Y, Hayashi Y, Ishimaru N. Mechanism of activation-induced cell death of T cells and regulation of FasL expression. Crit Rev Immunol. 2014;34(4):301–314. doi:10.1615/CritRevImmunol.2014009988.
- Zhang J, Bárdos T, Mikecz K, Finnegan A, Glant TT. Impaired Fas signaling pathway is involved in defective T cell apoptosis in autoimmune murine arthritis. J Immunol. 2001;166(8):4981–4986. doi:10.4049/jimmunol.166.8.4981.
- Zheng Z, Sun R, Zhao H-J, Fu D, Zhong H-J, Weng X-Q, Qu B, Zhao Y, Wang L, Zhao W-L. et al. MiR155 sensitized B-lymphoma cells to anti-PD-L1 antibody via PD-1/PD-L1-mediated lymphoma cell interaction with CD8+T cells. Mol Cancer. 2019;18(1):54. doi:10.1186/s12943-019-0977-3.