
ABSTRACT
Brain metastasis is the most devasting form of lung cancer. Recent studies highlight significant differences in the tumor microenvironment (TME) between lung cancer brain metastasis (LCBM) and primary lung cancer, which contribute significantly to tumor progression and drug resistance. Cancer-associated fibroblasts (CAFs) are the major component of pro-tumor TME with high plasticity. However, the lineage composition and function of CAFs in LCBM remain elusive. By reanalyzing single-cell RNA sequencing (scRNA-seq) data (GSE131907) from lung cancer patients with different stages of metastasis comprising primary lesions and brain metastasis, we found that CAFs undergo distinctive lineage transition during LCBM under a hypoxic situation, which is directly driven by hypoxia-induced HIF-2α activation. Transited CAFs enhance angiogenesis through VEGF pathways, trigger metabolic reprogramming, and promote the growth of tumor cells. Bulk RNA sequencing data was utilized as validation cohorts. Multiplex immunohistochemistry (mIHC) assay was performed on four paired samples of brain metastasis and their primary lung cancer counterparts to validate the findings. Our study revealed a novel mechanism of lung cancer brain metastasis featuring HIF-2α-induced lineage transition and functional alteration of CAFs, which offers potential therapeutic targets.
Backgrounds
Lung cancer is one of the most common malignant cancers in adults.Citation1 Although improved systemic therapies have led to better control of primary lung cancer at early and advanced stages,Citation1 40–50% of the patients will eventually develop brain metastasis.Citation2,Citation3 The prognosis of patients with lung cancer brain metastasis (LCBM) is extremely poor. Even with the latest integrative treatment, the 5-year survival rate remains less than 5%.Citation4–6 Drug resistance occurs within a year after treatmentCitation7,suggesting the brain may provide a sanctuary for metastatic tumor cells. Taken together, their divergent treatment response implies that primary lung cancer and LCBM have different molecular and cellular mechanisms during progression.
Recent studies showed that tumor microenvironment (TME) in LCBM is different from that in primary lung cancer.Citation8,Citation9 LCBM has an immunosuppressive TME with an accumulation of TGF-β secreting cancer-associated fibroblasts (CAFs),Citation10 and anti-proinflammatory macrophages.Citation9 Alterations in stromal components of TME are also observed, including elevated expression of extracellular matrix and the adhesion molecule ALCAM.Citation11,Citation12 The unique TME in LCBM may explain tumor cell settlement and drug resistanceCitation13 and highlight the importance of TME in LCBM.
CAFs, one of the most abundant cell populations in TME, can remodel the TME landscape by adjusting their secretion patterns and matrix deposition levels, thus promoting tumor progression and metastasis.Citation14,Citation15 Sun et al. identified active interaction and spatial colocalization of CAFs and endothelial cells in both LCBM and gliomas, indicating a potential role of CAFs in promoting endothelial cell function, likely through hypoxia-responsive pathways.Citation16 Apart from that, a pan-cancer analysis of CAFs revealed their diverse origins and robust plasticity in cellular function and lineage composition.Citation17 Mucciolo et al. revealed that TGF-β-induced EGFR activation of a subset of myofibroblasts in pancreatic ductal adenocarcinoma, which promotes metastasis. Blockade of EGFR signaling completely depletes the subset of myofibroblasts. Ma et al. found diverse metabolic reprogramming mechanisms within distinct CAF subpopulations across six solid tumors.Citation18 However, the transitions in lineage composition and functions of CAFs in LCBM remain elusive.
The advancement of single-cell RNA sequencing (scRNA-seq) has revolutionized our ability to comprehensively profile the tumor microenvironment at the single-cell resolution, facilitating a nuanced understanding of cellular lineage transitions in LCBM.Citation19,Citation20 In this study, we performed an unbiased analysis of bulk RNA and single-cell RNA sequencing data of both primary lung cancer and LCBM. We categorized CAFs and characterized their transitions and validated them using samples from LCBM and their primary counterparts. Our results indicate that HIF-2α drives lineage transition of CAFs to malignant phenotypes during LCBM, which enhances angiogenesis through VEGF pathway, trigger metabolic reprogramming, and promote the growth of tumor cells. Collectively, we elucidated the HIF-2α mediated lineage transition mechanisms of CAFs in LCBM, thereby providing valuable insights into potential therapeutic avenues.
Materials and methods
Data collection and processing
Bulk-RNA sequence data (GSE121968, GSE112996, and GSE141685) was assessed from Gene Expression Omnibus (GEO) and cBioPortal dataset Metastatic Melanoma (DFCI, Nature Medicine 2019).Citation21 Data were cleaned to remove duplicate rows and NA values and were normalized for the following analysis. Data from the GSE112996 and GSE141685 datasets was merged, and the R package Combat was utilized to reduce batch effect.Citation22 The scRNA-seq data of different metastatic stages of lung adenocarcinoma were accessed from the GSE131907 dataset.Citation8 Sequencing data from normal lung tissue in the dataset were excluded from this analysis. Clinical information of the patients and metadata were extracted simultaneously. R package Seurat (Version 4.2.0)Citation23 was used to process scRNA-seq data. QC control of raw data was the same as the source literature. Principal component analysis (PCA) was utilized and incorporated with the top 2000 highly variable features by the FindVariableFeatures function in the Seurat package to reduce the dimensionality of this dataset, and the first 20 PCs were identified for analysis. Uniform Manifold Approximation and Projection (UMAP) reduction was then adopted for further dimensionality reduction and visualization. Cell cluster annotation was conducted by the expression of known marker genes.
Differential analysis and GO enrichment analysis
Differential analysis of GSE121968 Bulk-RNA sequence data was performed by R package DESeq2 (Version 1.38.1)Citation24 by original counts on 14,280 genes across six paired samples. Differential genes (DEG) threshold value setting was |Log2FoldChange| >1 and p < 0.05. 703 genes passed filtration and were identified as DEGs. Functional annotation and GO enrichment analysis were conducted on up-regulated DEGs using the Gene Ontology database by R package clusterProfiler.Citation25
GSEA enrichment analysis
Gene Set Enrichment Analysis (GSEA) was utilized to gain a holistic understanding of the functional landscape by using specific gene sets.Citation26 All 14,280 genes were pre-ranked based on their Log2FoldChange value and are used to assess whether predefined gene sets representing biological pathways or functional categories are significantly enriched. In our analysis, four gene sets were used and downloaded from the GSEA MSigDB database (https://www.gsea-msigdb.org), and one gene set was defined according to literatures (Table S3). The enrichment score and p value were calculated using the R package clusterProfiler (Version 4.6.2)Citation25 and R package irGSEA (Version 3.2.2). Data visualization was conducted using the R package GseaVis (Version 0.0.9).
TCGA RNA‑seq data processing and scRNA-Seq data deconvolution
RNA-seq data and phenotype profiles of the lung adenocarcinoma (LUAD) cohort from the TCGA database were downloaded from the UCSC Xena database. Raw count data was directly utilized after removing NAs. CIBERSORTx website (https://cibersortx.stanford.edu) was used to deconvolve the cell fraction details from the TCGA LUAD bulk-seq dataset by the reference matrix generated by scRNA-seq data.Citation27 Cell composition data were linked to survival data and compared between high/low groups using Kaplan–Meier curves.
Fibroblast cell extraction and re-clustering
All fibroblasts were extracted for subsequent analysis. R package Harmony (Version 0.1.1)Citation28 was utilized to ease the batch effect in fibroblast subgroups across all samples. Data then again underwent the same dimensionality reduction and cell annotation process as described above.
Cell–cell interaction analysis
We used the R package Cellchat (Version 1.6.1) to project receptor-ligand pairs onto our cell subsets within tissues of each origin to identify cell–cell interactions.Citation29 This method takes gene expression data from cells as input, and the probability of cell–cell communication is simulated by combining gene expression with prior knowledge of the interaction between signaling ligands, receptors, and their co-factors. Heatmap functions were used to display the whole landscape of outgoing and incoming signal patterns in different statuses. Only significant ligand-receptor pairs (p < 0.05) were extracted for illustration. Visualization of the potential interaction strength between ligand and receptor in specific pathways is performed using Cellchat build-in function netVisual_aggregate. netVisual_bubble function was used to demonstrate significant legend-receptor pairs change trend in brain metastases.
Trajectory analysis
Naive-CAF, Matrix-CAF, and Myo-CAF were subsets from Fibroblasts subgroups and were investigated by utilizing the Monocle2 algorithm (R package Version 2.24.0).Citation30 Insight into dynamic biological processes, such as interconversion and evolutionary trajectories of these three cell types are obtained through this analysis. The NewCellDataSet function was utilized to create a new object for Monocle, incorporating transcript count data from the included cell populations. Differences in mRNA across different cells were normalized using estimateSizeFactors and estimateDispersions functions. Signature genes expressed in at least 10% of the dataset cells, with a p-value <0.01 were calculated using the differentialGeneTest function and were incorporated to define the trajectory progress. After dimension reduction, orderCells function ordered the cells according to gene expression. Branched Expression Analysis Modeling (BEAM) analysis was utilized by function BEAM and plot_genes_branched_heatmap to analyze specified nodes and time-ordered cell data to find and cluster differential genes and deduce gene modules related to the branches.
Single-cell regulatory network inference and clustering (SCENIC) analysis
We employed the pySCENIC Python package (Version 0.12.0) for SCENIC analysis.Citation31 Initially, the GRNBoost2 function was utilized to infer co-expression modules between transcription factors (TFs) and candidate target genes. Subsequently, the RcisTarget function identified enriched motifs in each co-expression module, defining a module as a TF and its potential direct target genes. Finally, the AUCell function assessed the activity of each module in individual cells. Cell-type specificity of a module was evaluated by the Module Specificity Score (RSS) method developed by Suo et al.Citation32
Acquisition of tumor samples
Paraffin-embedded blocks of two patient cohorts were utilized in this study, all of them underwent brain tumor resection surgery at Huashan Hospital (Shanghai, China) and are pathologically confirmed brain metastasis of lung cancer. Cohort 1 is comprised of paired resected tumor samples at the lung primary site and brain metastasis site from four patients. Cohort 2 is made up of samples from 10 patients. Five of them have lung cancer history and are on Tyrosine Kinase Inhibitor (TKI) medication but eventually developed LCBM (TKI-resistant group). The other five patients were diagnosed with LCBM as the initial diagnosis (TKI naive group). Tumors were examined by pathologists and confirmed to be lung cancer or LCBM. Written consents were obtained from all patients.
H&E staining and immunohistochemistry staining
All involved surgical tissue samples were fixed in formalin for 48 h, dehydrated, and embedded in paraffin. Paraffin blocks were then cut into 4-μm-thick slices. Hematoxylin and Eosin Staining (H&E) staining was performed using a H&E Kit (Beyotime, Cat#C0105S). Briefly, following dehydration and clearing, the specimens underwent hematoxylin staining to highlight the nuclei. Samples were subsequently stained with eosin for differentiation. Immunohistochemistry was conducted according to the manufacturer’s protocol. After deparaffinization and antigen retrieval, sections were blocked and incubated with the primary antibody, followed by incubation with secondary antibodies conjugated with horseradish peroxidase (HRP) (Vector Laboratories, Cat#MP-7500). An immunohistochemical reaction was developed using DAB substrate (Servicebio, Cat#C0105S), and counterstaining with hematoxylin was performed. The stained slides were scanned with an Olympus VS200 Slide Scanner.
Multiplex immunofluorescence staining
Multiplex immunofluorescence staining was performed using a 4-plex IHC Kit according to the manufacturer’s protocol (Ruchuang, Cat#RC0086Plus-34 R). Briefly, after deparaffinization and antigen retrieval, specimens were blocked and incubated with the primary antibody, followed by incubation with a secondary HRP-conjugated antibody (Vector Laboratories, Cat#MP-7500). The relative primary antibody markers were α-SMA (14395–1-AP, proteintech, 1:200), COL1A1 (67288–1-Ig, proteintech, 1:200), ADH1B (66939–1-Ig, proteintech, 1:200), PanCK (26411–1-AP, proteintech, 1:200), CD31 (66065–2-Ig, proteintech, 1:200), HIF-1α (66730–1-Ig, proteintech, 1:200) and HIF-2α (66731–1-Ig, proteintech, 1:200). Visualization was conducted by Opal TSA working solution for another 10 min, nuclei were stained with DAPI. The stained slides were scanned with an Olympus VS200 Slide Scanner.
Results
The TME of LCBM comprises of distinct CAF populations
To delineate the heterogeneity of TME during LCBM, we performed a comprehensive analysis of the scRNA-seq dataset (GSE131907) in primary and metastatic lung cancers ().Citation8 We identified 106,771 cells across 11 distinct cell clusters by unsupervised clustering of cells from 32 patients ( and S1a). Using the canonical markers of different cell types (), we further categorized these clusters into eight cell populations, i.e., epithelial cells, CAFs, endothelial cells, T lymphocytes, B lymphocytes, myeloid cells, MAST cells, and oligodendrocytes (). We calculated and compared the proportion of each cell type in different stages of lung cancers (). Compared with primary lung cancers, the proportion of nonmalignant cells in LCBM notably decreases, while the proportion of tumor cells increases ( and S1c). Interestingly, the proportion of CAFs remains relatively unchanged (), suggesting that the function of CAFs in LCBM may not be determined by their overall quantity.
Figure 1. Landscape of the CAF composition in LCBM.
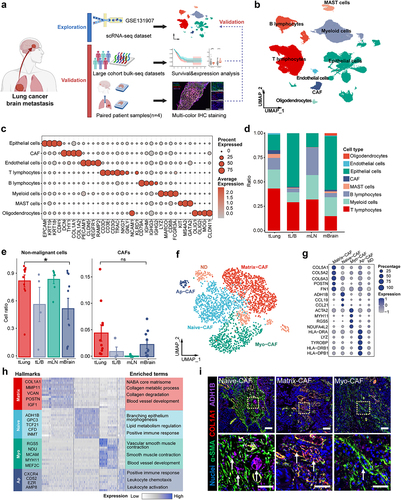
As CAFs are essential for the TME of metastasis, we then performed a detailed analysis of CAFs in LCBM to elucidate their association with lung cancer metastasis, we used modularity-optimized clustering to cluster CAFs into five distinct subpopulations () including previously defined CAF types.Citation17,Citation33 Matrix-CAFs (POSTN+, COL5A1+) account for 38.3% of all CAFs. Naive-CAFs (ADH1B+) account for 30.8%, followed by Myo-CAFs (Myofibroblast-like CAFs) (21.6%, marked by ACTA2 and RGS5) and Ap-CAF (Antigen-presenting CAF) (9.2%, HLA-DRB1+, HLA-DPB1+). Cluster 5 did not manifest distinctive features of any known fibroblast subgroups and was therefore labeled “ND (Not Determined)” and excluded from subsequent analysis ( and Table S1). To assess the functions of the aforementioned CAF subpopulations, we conducted a functional comparison analysis using the Metascape database. Pathway analysis revealed differential enrichment of upstream regulators and pathways ( and Table S2). Specifically, collagen degradation is enriched in Matrix-CAFs, smooth muscle contraction in Myo-CAFs, morphogenesis of a branching epithelium pathway in Naive-CAFs, and leukocyte chemotaxis pathway in Ap-CAFs. Finally, we validated the existence of Naive-CAF, Myo-CAF, and Matrix-CAF in LCBM by mIF analysis of the samples of primary lung cancer and paired brain metastasis. Indeed, we observed distinct compositions of CAFs in LCBM using α-SMA, COL1A1, and ADH1B as mIF markers for Myo-CAF, Matrix-CAF, and Naive-CAF, respectively (). Together, we found that the TME of LCBM has distinct CAF populations, although the overall proportion of CAFs remains the same as primary lung cancers.
Lineage transition of CAFs occurs in LCBM
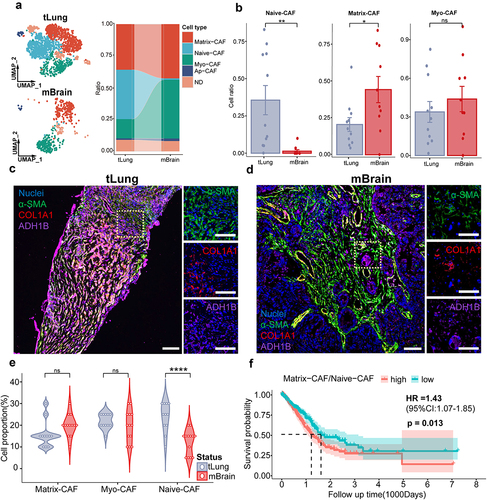
CAFs exhibit significant plasticity, whose composition is highly variable during tumor progression and strongly associated with the malignant advancement of tumors.Citation19 We compared CAF compositions in the TME of primary and metastatic lung cancer and found distinct CAF composition in LCBM (). Notably, LCBM has significantly fewer Naive-CAFs (1.1%) than primary lung cancers (39.2%), while it has significantly more Myo-CAFs and Matrix-CAFs (). The number of Ap-CAFs remained unchanged (Fig. S1D). This was validated by mIF images of paired samples (). Consistently, we observed a significant decrease in Naive-CAFs in LCBM (p < 0.001). The increase of Matrix-CAFs (p = 0.097) and Myo-CAF (p = 0.34) was not significant probably due to the small sample size. After analyzing the lung adenocarcinoma (LUAD) cohort in TCGA, we found that the Matrix-CAF to Naive-CAF ratio directly correlates with poorer prognosis (HR = 1.43, p = 0.013, n = 585) ( and S1e,f).
Figure 2. mIF images of paired lung cancer primary/brain metastasis samples.
We observed distinct composition of CAFs in LCBM, which may play different roles during cancer progression and metastasis. We then asked whether there are lineage transitions of CAFs in LCBM. We performed pseudotime trajectory by Monocle2, which revealed a gradual transition of the Naive-CAFs, leading to the emergence of two distinct branches A and B (). Myo-CAFs are enriched in the terminus of branch A, while Matrix-CAFs are in branch B (). The expression of key markers (i.e., ADH1B, ACTA2, and COL1A1) was coupled with the transition of CAFs in LCBM.
Figure 3. The lineage transition of CAFs in LCBM is associated with hypoxia.
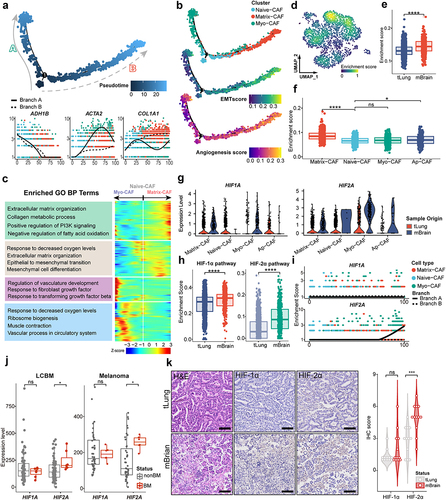
Four distinct functional modules of the differentially expressed genes in CAFs were identified during the transitions from Naive-CAF into Matrix-CAF or Myo-CAF (). In addition to the enrichment of epithelial–mesenchymal transition (EMT) and angiogenesis, a shared pathway in responding to low oxygen levels emerged as a common feature in both branches of differentiation (). In line with the functional annotation of Myo-CAFs and Matrix-CAFs, genes associated with angiogenesis and vasculature development were enriched in the transition toward Myo-CAF, while those related to extracellular matrix (ECM) remodeling in the transition toward Matrix-CAF. Together, CAFs undergo extensive lineage transitions during LCBM, which is associated with their divergent functions.
Hypoxia promotes the lineage transition of CAFs
Hypoxia is a significant hallmark of tumors and plays a pivotal role in tumor metastasis.Citation34–36 Therefore, we hypothesized that the lineage transition of CAFs is driven by hypoxia. We first analyzed the bulk RNA-sequencing data and observed that hypoxia-related pathways are highly enriched in the progression and metastasis of lung cancers (Fig. S2A-S2C). In scRNA-seq data, the overall enrichment of hypoxia pathways in CAFs of LCBM is significantly higher than that in the primary sites (). After examining each CAF subgroup (), we found that hypoxia-related pathways are statistically enriched in Matrix-CAFs and Myo-CAFs.
Hypoxia-induced factors (HIF) mediate the cellular responses to hypoxia.Citation34 In LCBM, both HIF1A and HIF2A are significantly upregulated in CAFs (). To assess the overall activity of these two HIF pathways, we defined key genes downstream of HIF1A and HIF2A (Table S3) and compared pathway scores between primary and brain metastatic CAFs. HIF-1α and HIF-2α pathway activity are both significantly upregulated in LCBM (). In the pseudotime analysis, HIF2A, but not HIF1A, is notably upregulated in branch A (), suggesting that HIF-2α may play a more predominant role in the lineage changes of CAFs.
To confirm the aforementioned findings, we integrated datasets of GSE112996 and GSE141685 which comprise primary lung cancers and LCBM (Fig. S2D). Consistently, we observed the significant upregulation of HIF2A (p = 0.018) but not HIF1A (p = 0.75) (). This was also validated by IHC staining ( and S2e). Furthermore, this was also observed in paired samples of peripheral and brain metastases lesions of melanoma from the DFCI cohort (). Taken together, our results imply that hypoxia pathways could regulate the lineage transition of CAFs in solid tumor brain metastasis.
HIF-2α activation drives the lineage transition of CAFs
To investigate the mechanisms of HIF2A mediated pathways in LCBM, we first examined the expression pattern in various cell types of LCBM. We found that HIF1A and HIF2A are predominantly distributed in CAFs, whose expression levels are significantly increased in LCBM (). This was validated by the protein levels of HIF-1α and HIF-2α by mIF staining of paired lung cancer primary/brain metastasis samples ().
Figure 4. Hypoxia-induced HIF-2α activation drives lineage transition of CAFs.
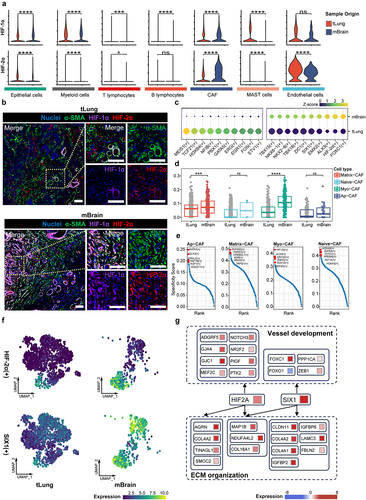
We then employed SCENIC analysis to identify key transcription factors (TF) modules which include the TFs and their downstream targets associated with CAF plasticity and lineage transition. Indeed, the HIF-2α module is highly relevant to LCBM (). The pathway scores of HIF-2α downstream genes are significantly increased in Myo-CAF and Matrix-CAF in LCBM (). In addition, the HIF-2α module is the most specific marker for Myo-CAF, suggesting its pivotal role in reshaping the CAF landscape (). Of note, the HIF-1α module is not identified in SCENIC analysis. It should be noted that the SIX1 module, a hypoxia-responding aerobic glycolysis regulating module,Citation37 is also enriched in LCBM (). Therefore, we analyzed the metabolic characteristics of the three CAFs and found that Myo-CAFs are metabolically inactive, primarily relying on oxidative phosphorylation (OXPHOs). In contrast, Matrix-CAFs exhibit enhanced glycolytic and OXPHO activity compared to Naive-CAFs, with increased activity in the pentose phosphate pathway and amino sugar and nucleotide sugar metabolism, reflecting their rich intracellular biosynthetic processes (Fig. S3a). In LCBM, the overall aerobic glycolysis is significantly upregulated, and Matrix-CAF has the highest aerobic glycolysis level (Fig. S3b-c). Analysis of the regulatory network of HIF-2α and SIX1 revealed the significant roles of these two transcription factors in angiogenesis and ECM remodeling (), shedding light on potential regulatory mechanisms of hypoxia on CAFs. Taken together, we specified HIF-2α and SIX1 as core TFs which are associated with the lineage transition and metabolic reprogramming of CAFs in response to hypoxia in LCBM.
CAFs in LCBM promote tumorigenesis by interacting with TME
As stated above, HIF-2α and SIX1 are associated with angiogenesis and ECM remodeling of CAFs in LCBM. So, we speculated that the signaling transduction patterns between CAFs and other TME components may be reshaped in LCBM. We examined the cell–cell communication and found that the interaction numbers between CAFs and endothelial cells are significantly increased (). Signal analysis shows that the communication probability of PIGF-VEGFR1 is significantly upregulated in the interplay between Myo-CAF and endothelial cells (). PIGF (Placental Growth Factor) is a direct downstream regulatory target of HIF-2α (). In LCBM, Myo-CAFs actively interact with endothelial cells and stimulate vessel growth, which was validated by increased colocalization of Myo-CAFs (marked by α-SMA) and endothelial cells (marked by CD31) (). Our results provided evidence that Myo-CAFs promote angiogenesis by engaging with endothelial cells through the PIGF-VEGFR1 pathway in LCBM.
Figure 5. Transited CAFs in LCBM interact with TME and malignant cells.
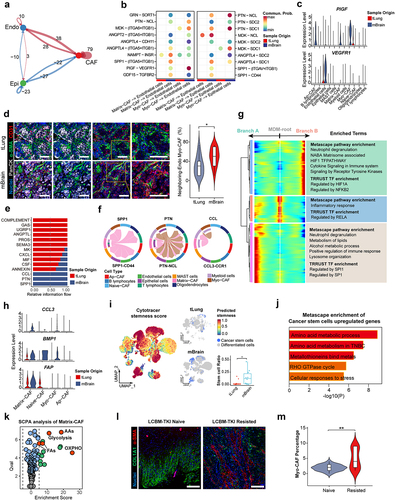
Several studies have uncovered a close interaction between CAFs and the immune microenvironment,Citation38,Citation39 highlighting a particularly tight interplay between CAFs and macrophages. We studied the changes in the interaction between CAFs and macrophages during LCBM and observed a significant increase in the SPP1, PTN, and CCL pathways (). We also traced the lineage changes of macrophages in LCBM and identified two distinctly different fate branches, one of which is to SPP1+ macrophages (), which is defined as an adverse prognostic factor in multiple studies.Citation38,Citation40 FAP+ CAFs were discovered to regulate the chemotaxis of SPP1+ macrophages through CCL3 in colorectal cancer, leading to poor prognosis.Citation41 Our research aligned with this finding and observed an upregulation of CCL3 and FAP expression in Matrix-CAFs within LCBM (). Also, we clustered relevant genes related to macrophage lineage differentiation to SPP1+ phenotype, and found that receptor tyrosine kinase (RTK) pathway and NF-κB mediated pathways may be driving factors (). BMP is a crucial activator of the RTK protein and NF-κB pathways. We observed significant upregulation of BMP1 and other RTK ligands in Matrix-CAF in LCBM ( and S4e). Our study reveals that the hypoxia and HIF-2α regulated lineage transition of CAFs promotes macrophage differentiation toward the pro-tumor SPP1+ phenotype through upregulation of CCL3 and BMP1.
Collectively, our results reveal that under hypoxia and HIF-2α regulation, Myo-CAFs promote angiogenesis by actively interacting with endothelial cells through the PIGF-VEGFR1 pathway in LCBM. On the other hand, Matrix-CAFs may drive macrophage lineage transition toward the SPP1+ phenotype.
CAFs in LCBM promote tumorigenesis by nurturing cancer stem cells
Cancer stem cells (CSC) are a core component in sustaining tumor growth, heterogeneity, and therapy resistance, serving as the initiating factor for malignant progression and metastasis of tumors. Tumor cells with multidirectional differentiation potential and high stemness settle in the brain, leading to LCBM. Several studies have reported a close interconnection between CAFs and tumor cells in terms of cellular communication and metabolism.Citation42 The lineage alterations of CAFs may play a crucial role in supporting the invasiveness of CSC. We defined the genuine malignant tumor cells from epithelial cell subgroups through copy number analysis (CNA) and evaluated the stemness of all tumor cells using the CytoTRACE algorithm (). In LCBM, the proportion of CSC (defined as the top 10% of tumor cells by CytoTRACE stemness score) significantly increased (), indicating their crucial role in LCBM development and drug resistance. Pathway enrichment analysis of upregulated genes related to CSCs in LCBM revealed a prominent elevation in amino acid metabolism pathways. These features resemble amino acid metabolism pathways observed in Triple-Negative Breast Cancer (TNBC), a subtype of breast cancer known for its poor prognosis and high propensity for brain metastasis (). We identified a significant increase in amino acid synthesis pathways in Matrix-CAFs (). Several studies have reported metabolic reprogramming in CAFs induced by tumor cells, promoting tumor growth by synthesizing and secreting the amino acids required by tumor cells.Citation42,Citation43 We speculate that similar mechanisms may also be present in LCBM.
The issue of targeted therapy resistance in LCBM has always been a hot topic. Tyrosine kinase inhibitors (TKI) are now the most common drugs for treating lung cancer, but ultimately all treated LCBM patients will develop resistance to TKI.Citation7 We collected samples from five TKI-naive and five TKI-resistant LCBM patients for mIHC staining. We found a significant increase in Myo-CAF in samples of LCBM that recurred after treatment (). Combined with the promoting role of Myo-CAF in angiogenesis, we speculate that CAF lineage transformation enhances angiogenesis and tumor vascular mimicry to support tumor cell resistance to targeted drugs. Collectively, our results revealed that the adaption of CAFs to hypoxia under HIF-2α regulation is pro-tumorigenic, by directly facilitating the growth of CSCs and enhancing drug resistance.
Discussion
Our investigation reveals the presence of diverse CAF populations during the metastatic progression of lung cancer. Although the stromal composition and immunosuppressive characteristics of CAFs in primary cancers have been intensively studied and unveiled,Citation42,Citation44 the CAF signatures at different stages of metastasis remain poorly understood. By the integrated analysis of scRNA-seq and bulk data, we provided a comprehensive exploration of CAF dynamics during lung cancer metastasis, illustrating a unique CAF landscape of LCBMs compared with their primary counterparts. CAFs undergo substantial lineage changes and functional reprogramming during brain metastasis, primarily mediated through the hypoxia-inducible factor (HIF) pathway ().
Figure 6. Lineage transition of CAFs in LCBM.
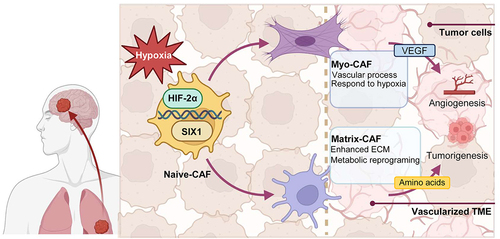
Concordantly, our present work reinforces the previous findings of the plasticity of fibroblasts and CAFs in response to different environmental stimuli, particularly hypoxic TME.Citation17,Citation45 Fibroblasts, normal in their context, can be “educated” by the pro-tumor TME, differentiating into myofibroblast-like CAF and Matrix-CAF, thus promoting tumor and facilitating metastasis. The connection between hypoxic environments and fibroblast plasticity has been observed in various non-tumor pathological settings, emphasizing the role of signaling pathways such as VEGF and PDGF.Citation46 In the context of tumors, the intricate interplay between hypoxia-induced pathways and CAF plasticity remains largely unexplored. Our results emphasize the role of the HIF-2α pathway in mediating the plasticity of CAFs, thereby promoting directed differentiation and functional specialization. This process ultimately facilitates the brain metastasis of lung cancer. HIF signaling is a major pathway responding to hypoxia.Citation34 Given that HIF-1α is associated with short-term acute hypoxia pathways and HIF-2α is associated with long-term chronic hypoxia pathways,Citation47,Citation48 we propose that this observation could be attributed to the tumor gradually adapting to prolonged hypoxia during metastasis and “switching on” to long-term hypoxia regulatory processes.
Targeting TME has emerged as a promising avenue in cancer therapy. Successful applications of immune checkpoint inhibitors underscore the importance of reversing pro-tumorigenic immunosuppressive microenvironments. Our study suggests that targeting HIF-2α, a major player in the transition of CAF lineages to a malignant phenotype, holds therapeutic potential in LCBM. The HIF-2α pathway plays a significant role in multiple biological processes and diseases,Citation49–52 and the blockade of this pathway has recently been proven to be an effective treatment. The FDA-approved HIF-2α antagonist, Belzutifan (MK-6482), initially designed for VHL syndrome-associated renal clear cell carcinoma and other tumors, may offer a viable option for the prevention and treatment of LCBM.Citation53 Recently, Belzutifan has been approved by the FDA for previously treated advanced renal clear cell carcinoma, indicating that the HIF-2α pathway also plays a significant role in somatically mutated tumors.Citation54 The observed changes in the CAF population and function during the progression of lung cancer, driven by the HIF-2α pathway, present unique insights into the underlying mechanisms of LCBM and propose a potential treatment target. A future clinical trial to verify the efficacy of HIF-2α blockade on LCBM is hence needed.
The manuscript still bears some inadequacies. Owing to the inherent heterogeneity of CAFs, a unified classification for CAFs is currently lacking. Hence, the definition of CAF grouping and the analysis of its evolutionary patterns as outlined in this manuscript necessitate validation on a larger scale. The mechanisms we proposed shall be strengthened by further in-depth experimental validation.
In summary, our study sheds light on the distinctive changes in CAF cell population and cellular function driven by the HIF-2α pathway during the progression of lung cancer, particularly in the context of brain metastasis. Our work may serve as a foundation for further exploration of the role of CAF plasticity in tumor progression and the development of effective strategies for the prevention and treatment of lung cancer brain metastasis.
Abbreviations
| LCBM | = | lung cancer brain metastasis |
| CAFs | = | cancer-associated fibroblasts |
| TME | = | tumor microenvironment |
| CNS | = | central nerve system |
| bulk-seq | = | bulk sequencing |
| scRNA-seq | = | single-cell RNA sequencing |
| H&E | = | hematoxylin-eosin staining |
| IHC | = | immunohistochemistry |
| mIF | = | multiplex immunofluorescence |
| CSC | = | cancer stem cell |
| TKI | = | tyrosine kinase inhibitor |
Authors’ contributions
Conceptualization, W.H., Z.Z. and Y.M.; methodology, M.F., M.Y., L.Z. and Y.F.; formal analysis, M. F. and L.Z.; investigation, M.F., Z.S., W.H. and M.Y.; resources, M.Y., Z.S., H.W. and M.Y.; data curation, M. F., L.Z. and F.Y.; writing – original draft, M.Y., M.F.; writing – review & editing, X.Z., W.H. and Y.M.; visualization, M. F., L.Z. and M.Y.; supervision, W.H. and Y.M.; funding acquisition, W.H. and Y.M.
Code availability
The code used for all processing and analysis is available upon request.
Ethics approval
The ethics committee of Huashan Hospital approved the present study. Written consents were obtained from all patients.
Supplemental Material
Download Zip (2.2 MB)Acknowledgments
We sincerely thank Medical Science Data Center in Shanghai Medical College of Fudan University for providing data analysis platforms. We thank Dr. Fengyun Zheng and Core Facility of Shanghai Medical College of Fudan University for support with slide image scanning and data analysis.
Disclosure statement
No potential conflict of interest was reported by the author(s).
Data availability statement
Raw data of all datasets analyzed in this paper are publicly accessible and can be assessed according to the method given in the paper.
Supplementary material
Supplemental data for this article can be accessed online at https://doi.org/10.1080/2162402X.2024.2356942
Correction Statement
This article has been republished with minor changes. These changes do not impact the academic content of the article.
Additional information
Funding
References
- Ganti AK, Klein AB, Cotarla I, Seal B, Chou E. Update of incidence, prevalence, survival, and initial treatment in patients with non-small cell lung cancer in the US. JAMA Oncol. 2021;7(12):1824–14. doi:10.1001/jamaoncol.2021.4932.
- Riihimäki M, Hemminki A, Fallah M, Thomsen H, Sundquist K, Sundquist J, Hemminki K. Metastatic sites and survival in lung cancer. Lung Cancer. 2014 Oct;86(1):78–84. doi:10.1016/j.lungcan.2014.07.020.
- Castrucci WA, Knisely JP. An update on the treatment of CNS metastases in small cell lung cancer. Cancer J. 2008;14(3):138–146. doi:10.1097/PPO.0b013e318172d6e1.
- Hao Y, Li G. Risk and prognostic factors of brain metastasis in lung cancer patients: a surveillance, epidemiology, and end results population‑based cohort study. Eur J Cancer Prev. 2023;32(5):498–511. doi:10.1097/cej.0000000000000790.
- Ettinger DS, Wood DE, Aisner DL, Akerley W, Bauman J, Chirieac LR, D’Amico TA, DeCamp MM, Dilling TJ, Dobelbower M. et al. Non–small cell lung cancer, version 5.2017, NCCN clinical practice guidelines in oncology. J Natl Compr Canc Netw. 2017;15(4):504–535. doi:10.6004/jnccn.2017.0050.
- Chae YK, Arya A, Iams W, Cruz MR, Chandra S, Choi J, Giles F. Current landscape and future of dual anti-CTLA4 and PD-1/PD-L1 blockade immunotherapy in cancer; lessons learned from clinical trials with melanoma and non-small cell lung cancer (NSCLC). J Immunother Cancer. 2018;6(1):39. doi:10.1186/s40425-018-0349-3.
- Eguren-Santamaria I, Sanmamed MF, Goldberg SB, Kluger HM, Idoate MA, Lu BY, Corral J, Schalper KA, Herbst RS, Gil-Bazo I. et al. PD-1/PD-L1 blockers in NSCLC brain metastases: Challenging paradigms and clinical practice. Clin Cancer Res. 2020;26(16):4186–4197. doi:10.1158/1078-0432.Ccr-20-0798.
- Kim N, Kim HK, Lee K, Hong Y, Cho JH, Choi JW, Lee J-I, Suh Y-L, Ku BM, Eum HH. et al. Single-cell RNA sequencing demonstrates the molecular and cellular reprogramming of metastatic lung adenocarcinoma. Nat Commun. 2020;11(1):2285. doi:10.1038/s41467-020-16164-1.
- Wang Z, Wang Y, Chang M, Wang Y, Liu P, Wu J, Wang G, Tang X, Hui X, Liu P. et al. Single-cell transcriptomic analyses provide insights into the cellular origins and drivers of brain metastasis from lung adenocarcinoma. Neuro Oncol. 2023;25(7):1262–1274. doi:10.1093/neuonc/noad017.
- Batlle E, Massagué J. Transforming growth factor-β signaling in immunity and cancer. Immunity. 2019;50(4):924–940. doi:10.1016/j.immuni.2019.03.024.
- Zhang Q, Abdo R, Iosef C, Kaneko T, Cecchini M, Han VK, Li SSC. The spatial transcriptomic landscape of non-small cell lung cancer brain metastasis. Nat Commun. 2022;13(1):5983. doi:10.1038/s41467-022-33365-y.
- Münsterberg J, Loreth D, Brylka L, Werner S, Karbanova J, Gandrass M, Schneegans S, Besler K, Hamester F, Robador JR. et al. ALCAM contributes to brain metastasis formation in non-small-cell lung cancer through interaction with the vascular endothelium. Neuro Oncol. 2020;22(7):955–966. doi:10.1093/neuonc/noaa028.
- Passaro A, Jänne PA, Mok T, Peters S. Overcoming therapy resistance in EGFR-mutant lung cancer. Nat Cancer. 2021;2(4):377–391. doi:10.1038/s43018-021-00195-8.
- Kalluri R. The biology and function of fibroblasts in cancer. Nat Rev Cancer. 2016;16(9):582–598. doi:10.1038/nrc.2016.73.
- Quail DF, Joyce JA. Microenvironmental regulation of tumor progression and metastasis. Nat Med. 2013;19(11):1423–1437. doi:10.1038/nm.3394.
- Sun HF, Li LD, Lao IW, Li X, Xu BJ, Cao YQ, Jin W. Single-cell RNA sequencing reveals cellular and molecular reprograming landscape of gliomas and lung cancer brain metastases. Clin Transl Med. 2022;12(11):e1101. doi:10.1002/ctm2.1101.
- Luo H, Xia X, Huang LB, An H, Cao M, Kim GD, Chen H-N, Zhang W-H, Shu Y, Kong X. et al. Pan-cancer single-cell analysis reveals the heterogeneity and plasticity of cancer-associated fibroblasts in the tumor microenvironment. Nat Commun. 2022;13(1):6619. doi:10.1038/s41467-022-34395-2.
- Ma C, Yang C, Peng A, Sun T, Ji X, Mi J, Wei L, Shen S, Feng Q. Pan-cancer spatially resolved single-cell analysis reveals the crosstalk between cancer-associated fibroblasts and tumor microenvironment. Mol Cancer. 2023 Oct 13;22(1):170. doi:10.1186/s12943-023-01876-x.
- Choi YP, Lee JH, Gao MQ, Kim BG, Kang S, Kim SH, Cho NH. Cancer-associated fibroblast promote transmigration through endothelial brain cells in three-dimensional in vitro models. Int J Cancer. 2014;135(9):2024–2033. doi:10.1002/ijc.28848.
- Chung B, Esmaeili AA, Gopalakrishna-Pillai S, Murad JP, Andersen ES, Kumar Reddy N, Srinivasan G, Armstrong B, Chu C, Kim Y. et al. Human brain metastatic stroma attracts breast cancer cells via chemokines CXCL16 and CXCL12. NPJ Breast Cancer. 2017;3(1):6. doi:10.1038/s41523-017-0008-8.
- Liu D, Schilling B, Liu D, Sucker A, Livingstone E, Jerby-Arnon L, Zimmer L, Gutzmer R, Satzger I, Loquai C. et al. Integrative molecular and clinical modeling of clinical outcomes to PD1 blockade in patients with metastatic melanoma. Nat Med. 2019;25(12):1916–1927. doi:10.1038/s41591-019-0654-5.
- Johnson WE, Li C, Rabinovic A. Adjusting batch effects in microarray expression data using empirical Bayes methods. Biostatistics. 2007;8(1):118–127. doi:10.1093/biostatistics/kxj037.
- Hao Y, Hao S, Andersen-Nissen E, Mauck WM 3rd, Zheng S, Butler A, Lee MJ, Wilk AJ, Darby C, Zager M. et al. Integrated analysis of multimodal single-cell data. Cell. 2021;184(13):3573–87.e29. doi:10.1016/j.cell.2021.04.048.
- Love MI, Huber W, Anders S. Moderated estimation of fold change and dispersion for RNA-seq data with DESeq2. Genome Biol. 2014;15(12):550. doi:10.1186/s13059-014-0550-8.
- Wu T, Hu E, Xu S, Chen M, Guo P, Dai Z, Feng T, Zhou L, Tang W, Zhan L. et al. clusterProfiler 4.0: A universal enrichment tool for interpreting omics data. Innovation (Camb). 2021;2(3):100141. doi:10.1016/j.xinn.2021.100141.
- Subramanian A, Tamayo P, Mootha VK, Mukherjee S, Ebert BL, Gillette MA, Paulovich A, Pomeroy SL, Golub TR, Lander ES. et al. Gene set enrichment analysis: a knowledge-based approach for interpreting genome-wide expression profiles. Proc Natl Acad Sci U S A. 2005;102(43):15545–15550. doi:10.1073/pnas.0506580102.
- Steen CB, Liu CL, Alizadeh AA, Newman AM. Profiling cell type abundance and expression in bulk tissues with CIBERSORTx. Methods Mol Biol. 2020;2117:135–157. doi:10.1007/978-1-0716-0301-7_7.
- Korsunsky I, Millard N, Fan J, Slowikowski K, Zhang F, Wei K, Baglaenko Y, Brenner M, Loh P-R, Raychaudhuri S. et al. Fast, sensitive and accurate integration of single-cell data with harmony. Nat Methods. 2019;16(12):1289–1296. doi:10.1038/s41592-019-0619-0.
- Jin S, Guerrero-Juarez CF, Zhang L, Chang I, Ramos R, Kuan CH, Myung P, Plikus MV, Nie Q. Inference and analysis of cell-cell communication using CellChat. Nat Commun. 2021;12(1):1088. doi:10.1038/s41467-021-21246-9.
- Qiu X, Mao Q, Tang Y, Wang L, Chawla R, Pliner HA, Trapnell C. Reversed graph embedding resolves complex single-cell trajectories. Nat Methods. 2017;14(10):979–982. doi:10.1038/nmeth.4402.
- Van de Sande B, Flerin C, Davie K, De Waegeneer M, Hulselmans G, Aibar S, Seurinck R, Saelens W, Cannoodt R, Rouchon Q. et al. A scalable SCENIC workflow for single-cell gene regulatory network analysis. Nat Protoc. 2020;15(7):2247–2276. doi:10.1038/s41596-020-0336-2.
- Suo S, Zhu Q, Saadatpour A, Fei L, Guo G, Yuan GC. Revealing the critical regulators of cell identity in the mouse cell atlas. Cell Rep. 2018;25(6):1436–45.e3. doi:10.1016/j.celrep.2018.10.045.
- Lendahl U, Muhl L, Betsholtz C. Identification, discrimination and heterogeneity of fibroblasts. Nat Commun. 2022;13(1):3409. doi:10.1038/s41467-022-30633-9.
- Luo Z, Tian M, Yang G, Tan Q, Chen Y, Li G, Zhang Q, Li Y, Wan P, Wu J. et al. Hypoxia signaling in human health and diseases: implications and prospects for therapeutics. Signal Transduct Target Ther. 2022;7(1):218. doi:10.1038/s41392-022-01080-1.
- Wang R, Godet I, Yang Y, Salman S, Lu H, Lyu Y, Zuo Q, Wang Y, Zhu Y, Chen C. et al. Hypoxia-inducible factor-dependent ADAM12 expression mediates breast cancer invasion and metastasis. Proc Natl Acad Sci USA. 2021;118(19). doi:10.1073/pnas.2020490118.
- Hung PF, Hong TM, Chang CC, Hung CL, Hsu YL, Chang YL, Wu C-T, Chang G-C, Chan N-L, Yu S-L. et al. Hypoxia-induced Slug SUMOylation enhances lung cancer metastasis. J Exp Clin Cancer Res. 2019;38(1):5. doi:10.1186/s13046-018-0996-8.
- Li L, Liang Y, Kang L, Liu Y, Gao S, Chen S, Li Y, You W, Dong Q, Hong T. et al. Transcriptional regulation of the warburg effect in cancer by SIX1. Cancer Cell. 2018;33(3):368–85.e7. doi:10.1016/j.ccell.2018.01.010.
- Liu Y, Xun Z, Ma K, Liang S, Li X, Zhou S, Sun L, Liu Y, Du Y, Guo X. et al. Identification of a tumour immune barrier in the HCC microenvironment that determines the efficacy of immunotherapy. J Hepatol. 2023;78(4):770–782. doi:10.1016/j.jhep.2023.01.011.
- Boelaars K, Rodriguez E, Huinen ZR, Liu C, Wang D, Springer BO, Olesek K, Goossens-Kruijssen L, van Ee T, Lindijer D. et al. Pancreatic cancer-associated fibroblasts modulate macrophage differentiation via sialic acid-Siglec interactions. Commun Biol. 2024;7(1):430. doi:10.1038/s42003-024-06087-8.
- Bill R, Wirapati P, Messemaker M, Roh W, Zitti B, Duval F, Kiss M, Park JC, Saal TM, Hoelzl J. et al. CXCL9: SPP1 macrophage polarity identifies a network of cellular programs that control human cancers. Science. 2023;381(6657):515–524. doi:10.1126/science.ade2292.
- Qi J, Sun H, Zhang Y, Wang Z, Xun Z, Li Z, Ding X, Bao R, Hong L, Jia W. et al. Single-cell and spatial analysis reveal interaction of FAP(+) fibroblasts and SPP1(+) macrophages in colorectal cancer. Nat Commun. 2022;13(1):1742. doi:10.1038/s41467-022-29366-6.
- Bertero T, Oldham WM, Grasset EM, Bourget I, Boulter E, Pisano S, Hofman P, Bellvert F, Meneguzzi G, Bulavin DV. et al. Tumor-stroma mechanics coordinate amino acid availability to sustain tumor growth and malignancy. Cell Metab. 2019;29(1):124–40.e10. doi:10.1016/j.cmet.2018.09.012.
- Wang Y, Liang Y, Xu H, Zhang X, Mao T, Cui J, Yao J, Wang Y, Jiao F, Xiao X. et al. Single-cell analysis of pancreatic ductal adenocarcinoma identifies a novel fibroblast subtype associated with poor prognosis but better immunotherapy response. Cell Discov. 2021;7(1):36. doi:10.1038/s41421-021-00271-4.
- Grout JA, Sirven P, Leader AM, Maskey S, Hector E, Puisieux I, Steffan F, Cheng E, Tung N, Maurin M. et al. Spatial positioning and matrix programs of cancer-associated fibroblasts promote t-cell exclusion in human lung tumors. Cancer Discov. 2022;12(11):2606–2625. doi:10.1158/2159-8290.Cd-21-1714.
- Liu J, Li P, Wang L, Li M, Ge Z, Noordam L, Lieshout R, Verstegen MMA, Ma B, Su J. et al. Cancer-associated fibroblasts provide a stromal niche for liver cancer organoids that confers trophic effects and therapy resistance. Cell Mol Gastroenterol Hepatol. 2021;11(2):407–431. doi:10.1016/j.jcmgh.2020.09.003.
- Kawakami T, Mimura I, Shoji K, Tanaka T, Nangaku M. Hypoxia and fibrosis in chronic kidney disease: crossing at pericytes. Kidney Int Suppl. 2014;4(1):107–112. doi:10.1038/kisup.2014.20.
- Jaśkiewicz M, Moszyńska A, Króliczewski J, Cabaj A, Bartoszewska S, Charzyńska A, Gebert M, Dąbrowski M, Collawn JF, Bartoszewski R. et al. The transition from HIF-1 to HIF-2 during prolonged hypoxia results from reactivation of PHDs and HIF1A mRNA instability. Cell Mol Biol Lett. 2022;27(1):109. doi:10.1186/s11658-022-00408-7.
- Lee JW, Ko J, Ju C, Eltzschig HK. Hypoxia signaling in human diseases and therapeutic targets. Experimental & Molecular Medicine. 2019;51(6):1–13. doi:10.1038/s12276-019-0299-y.
- Gao F, Yao Q, Zhu J, Chen W, Feng X, Feng B, Wu J, Pacak K, Rosenblum J, Yu J. et al. A novel HIF2A mutation causes dyslipidemia and promotes hepatic lipid accumulation. Pharmacol Res. 2023;194:106851. doi:10.1016/j.phrs.2023.106851.
- Zhuang Z, Yang C, Lorenzo F, Merino M, Fojo T, Kebebew E, Popovic V, Stratakis CA, Prchal JT, Pacak K. et al. Somatic HIF2A gain-of-function mutations in paraganglioma with polycythemia. N Engl J Med. 2012;367(10):922–930. doi:10.1056/NEJMoa1205119.
- Rosenblum JS, Wang H, Dmitriev PM, Cappadona AJ, Mastorakos P, Xu C, Jha A, Edwards N, Donahue DR, Munasinghe J. et al. Developmental vascular malformations in EPAS1 gain-of-function syndrome. JCI Insight. 2021;6(5). doi:10.1172/jci.insight.144368.
- Yu J, Shi X, Yang C, Bullova P, Hong CS, Nesvick CL, Dmitriev P, Pacak K, Zhuang Z, Cao H. et al. A novel germline gain-of-function HIF2A mutation in hepatocellular carcinoma with polycythemia. Aging (Albany NY). 2020;12(7):5781–5791. doi:10.18632/aging.102967.
- Jonasch E, Donskov F, Iliopoulos O, Rathmell WK, Narayan VK, Maughan BL, Oudard S, Else T, Maranchie JK, Welsh SJ. et al. Belzutifan for renal cell carcinoma in von hippel–lindau disease. N Engl J Med. 2021;385(22):2036–2046. doi:10.1056/NEJMoa2103425.
- Albiges L, Rini BI, Peltola K, De Velasco Oria GA, Burotto M, Suarez Rodriguez C, Ghatalia P, Iacovelli R, Lam ET, Verzoni E. et al. LBA88 Belzutifan versus everolimus in participants (pts) with previously treated advanced clear cell renal cell carcinoma (ccRCC): Randomized open-label phase III LITESPARK-005 study. Ann Oncol. 2023;34:S1329–S30. doi:10.1016/j.annonc.2023.10.090.