
ABSTRACT
Improving cancer immunotherapy efficacy hinges on identifying key T-cell populations critical for tumor control and response to Immune Checkpoint Blockade (ICB). We have recently reported that while the co-expression of PD-1 and CD28 is associated with impaired functionality in peripheral blood, it significantly enhances T-cell fitness in the tumor site of non-small cell lung cancer (NSCLC) patients. To uncover the underlying mechanisms, we explored the role of CD26, a key player in T-cell activation through its interaction with adenosine deaminase (ADA), a crucial intra/extracellular enzyme able to neutralize local adenosine (ADO). We found that an autocrine ADA/CD26 axis enhances CD8+PD-1+CD28+ T-cell function, particularly within an immunosuppressive environment marked by CD39 expression. Then, we interrogated the TCGA and OAK datasets to gain insight into the prognostic/predictive potential of our findings. We identified a signature predicting overall survival (OS) in LUAD patients and response to atezolizumab in advanced LUAD cases. These findings suggest promising avenues for therapeutic intervention targeting the ADA/CD26 axis.
Introduction
Uncovering a T-cell population phenotype capable of effectively controlling tumor growth and positively associated with response to Immune Checkpoint blockade (ICB) is crucial for refining patient stratification and improving cancer immunotherapy outcomes.
Our recent findings indicate that while the co-expression of PD-1 and CD28 is associated with impaired functionality of CD8+ T cells in peripheral blood, it significantly enhances the fitness of these cells in the tumor site of non-small cell lung cancer (NSCLC) patients. This positively impacts both patient survival and response to ICB therapy.Citation1
To investigate the potential mechanisms behind this functional enhancement, we examined CD26, a multifunctional 110 kDa membrane dipeptidyl peptidase 4 (DPP4) involved in immune-mediated tumor control,Citation2 recently proposed as a biomarker for response to PD-1 blockade in melanoma patients.Citation3 CD26 can promote T-cell proliferation through its interaction with adenosine deaminase (ADA),Citation4–6 a multifaceted molecule that can be released in the extra-cellular milieu by stimulated T cells,Citation5 contributing to either an autocrine or paracrine stimulation via interaction with CD26 on neighboring T cells.Citation5–7 One of the ADA’s primary roles is the irreversible enzymatic deamination of adenosine (ADO) into inosine,Citation4 a critical process supporting CD8+ T-cell functionality within the tumor microenvironment (TME).Citation8 Conversely, ADO, the final product of adenosine diphosphate/triphosphate (ADP/ATP) degradation mediated by the combined activity of ectonucleotidases CD39 and CD73, impairs CD8+ T cell functionality through its interaction with the A2A receptor (A2AR).Citation9,Citation10
A high ADO concentration has also been reported in the presence of T cells expressing only CD39,Citation11 suggesting a potential involvement of exogenous CD73 in catalyzing the conversion of AMP to ADO.Citation12
Remarkably, the presence of CD39 and CD73 in the absence of CD26 and ADA has been reported as a feature of immunoregulatory/suppressive T cells in cancer patients.Citation13 Conversely, a high expression of CD26 is a feature of CD4+ T-cell stemness, stable memory capacity, and enhanced intra-tumor migration and persistence, contributing to the regression of solid cancers following adoptive immunotherapy.Citation14
In CD8+ T cells, while the expression of CD26 is associated with robust effector function,Citation15 the impact of the ADA/CD26 axis on the T-cell function is still undefined.
Herein, we explored the potential involvement of the ADA/CD26 axis in the enhanced functionality of CD8+PD-1+CD28+cells from the NSCLC tumor site in a context enriched with immunosuppressive CD39 and CD73 molecules.Citation16
Our results unveil the effects of the ADA/CD26 axis in maintaining the functional fitness of CD8+PD-1+CD28+ T cells as they transition to the immunosuppressive NSCLC tumor site.Citation16 Based on these results, we focused on lung adenocarcinoma (LUAD) and identified a signature associated with enhanced OS in LUAD TCGA patients and improved OS and responsiveness in ICB-treated advanced patients.
These findings offer preliminary insights into the potential therapeutic interventions targeting the ADA/CD26 axis in combination with ICB in LUAD patients.
Materials and methods
Peripheral blood collection and tissue specimens
Briefly, 20 ml of peripheral blood was collected from n = 6 treatment-naïve NSCLC patients in EDTA vacutainer tubes (BD Bioscience 367,864) after written informed consent. Peripheral blood mononuclear cells (PBMC) were isolated using Ficoll-paque (Euroclone, DVCL5020) and cryopreserved in 10% DMSO (Sigma-Aldrich, D2650). Tissue specimens from adjacent non-tumor (NT) and tumor sites (T) were obtained after written informed consent from n = 18 NSCLC treatment-naïve patients who underwent curative resection at the Regina Elena National Cancer Institute between 2016 and 2022 and processed within 20 min by mechanical dissociation, then incubated at 37°C and 5% CO2 for 24–48 h. Lymphocyte-enriched supernatant was collected, filtered through a 70 µM nylon cell strainer (Miltenyi Biotec, 130-095-823) and cryopreserved in 10% DMSO. For a fraction of NSCLC patients (n = 8), samples matched for at least two districts among P, NT, and T were obtained. The main features of the 18 NSCLC patients evaluated in the study are listed in Table S1.
In vitro T-cell activation and flow cytometry studies
Surface staining of PBMC and tissue-infiltrating cells was performed at 4°C for 30 min using various combinations of monoclonal antibodies (mAbs): APC-H7 anti-CD8 (BD 560,179), PerCP-Cy™5.5 anti-PD-1 (BD 561,273), BV650 anti-CD39 (BD 563,681), APC-R700 anti-CD28 (BD 565,181), BV510 anti-CD26, PE anti-CD73 (BD 550,257), PE anti-A2AR (R&D, FAB94971P), APC anti-tumor necrosis factor (TNF)-α (BD 554,514), PE-Cy™7 anti-interferon (IFN)-γ (BD 5,576,643), and BV421 anti-granzyme (GrzB) (BD 563,389). The Anti-ADA Ab (LSBio, LS‑C156031) was conjugated to the Alexa Fluor 488 secondary Ab by using the Lightning-Link Rapid Dylight 488 Antibody Labeling kit (Novus Biologicals, 322–0010), according to the manufacturer’s instructions. Assessment of intracellular ADA, IFN-γ, TNF-α, and GrzB was performed using the Intrasure kit (BD 641,778), according to the manufacturer’s instructions.
For functional analyses, 2–3 × 10⁵ cells were activated with plate-bound anti-CD3 mAb and recombinant human (rh) IL-2 for 5–6 h in the presence of protein transport inhibitors Golgistop (BD 554,724) and Golgiplug (BD 555,029), before staining with diverse combinations of mAbs specific for surface and intracellular molecules. For ADA blocking experiments, cells were incubated with the specific inhibitor erythro-9-(2-Hydroxy-3-nonyl) adenine hydrochloride (EHNA) (Calbiochem 51,350-19-7) at 10 μM, according to an in-house time course blockade, while stimulated with plate-bound anti-CD3 mAb for 6 h. The protein transport inhibitors Golgistop and Golgiplug were added during the last three hours of stimulation.
Cell analysis was conducted using BD FACSCantoII and BD FACSCelesta flow cytometers, and data were analyzed with BD FACSDiva and Flowjo software.
Statistical analysis
Friedman test and Wilcoxon U-test were used to compare matched patients and intra-individual assessments. Non-parametric Kruskal-Wallis test and Mann-Whitney U-test were employed for comparisons between unmatched patients. All p values were adjusted with Bonferroni correction for multiple comparisons. Box graphsdisplayed the 25th and 75th percentiles, median values, and outliers, while scatter-plot graphs showed median values with an interquartile range. A p value ≤ 0.05 was considered significant, with significance levels represented as *p ≤ 0.05, **p ≤ 0.01, ***p ≤ 0.001. Statistical analysis was performed using SPSS 21.0 for Windows.
Patients’ stratification and survival analysis
To explore the influence of specific T-cell signatures on the prognosis and response to ICB in LUAD NSCLC patients, we interrogated TCGA and OAK datasets. For both datasets, we included patients with an Overall Survival (OS) longer than 1 month. For the TCGA dataset, only M0 patients were selected. Only lung ADC samples that underwent ICB therapy (atezolizumab) were selected for the OAK dataset. Before the downstream analysis, gene expression was z-scored in both datasets. To simulate a scenario of tumor lymphocyte infiltration and ensure the presence of CD8+PD1+CD39+ADA+CD26+ T cells, patients from both datasets were initially stratified based on the gene expression levels of CD8, PDCD1 (PD-1), ENTPD1 (CD39), ADA, and DPP4 (CD26). Patients with a mean expression level above the 25th percentile for all the genes were classified as a CD8+PD1+CD39+ADA+CD26+ cohort. Subsequently, these cohorts were further stratified into CD28 “high” and CD28 “low” based onCD28 gene expression, considering the highest tertile as “high” and the lowest tertile as “low.” Survival outcomes were analyzed using Kaplan-Meier (KM) curves, employing the “survival” and “survminer” packages within the R statistical software (version 4.1.2), and differences were assessed using the log-rank test. We leveraged the OAK dataset to assess the impact of the above T-cell signature on the efficacy of ICB therapy in NSCLC patients. Patients were first stratified according to the CD8+PD1+CD39+ADA+CD26+ signature expression levels as described above. We then correlated CD28 levels with clinical outcomes, categorizing patients into Responders (R) and Non-Responders (NR). Responders included those with Partial Response (PR), Complete Response (CR), and Stable Disease (SD) with Progression Free Survival (PFS) exceeding 6 months. Non-responders comprised patients with Progressive Disease (PD) and Stable Disease (SD) with PFS less than 6 months. An identical approach was applied to examine the impact of the signature in CD4+ T-cell enriched NSCLC. p values were determined by performing the Fisher’s Exact test on a contingency table with columns indicating clinical benefit and rows indicating the signature levels. Adjusted p values < 0.05 were considered statistically significant.
Results
Deciphering the role of CD26, CD39, CD73, and ADA in shaping PD-1+CD28− and PD-1+CD28+ CD8+ T-cell subset distribution across peripheral blood, normal tissue, and tumor site in NSCLC patients
We recently reported the CD28 pivotal role in improving the functional state of PD-1+ CD8+ T cells in the tumor site of NSCLC patients.Citation1 To explore the potential mechanisms underlying the functional advantage of PD-1+ CD8+ T cells within the immunosuppressive, CD39-enriched NSCLC tumor site, we investigated whether the ADA/CD26 axis might counteract this immunosuppressive phenotype.
First, we assessed the impact of the individual CD26, CD39, CD73, and ADA expression on the distribution and functional state of the two CD8+ subsets characterized by PD-1 with or without CD28 in peripheral blood, non-tumor lung tissue and tumor site of 18 NSCLC patients.
CD26 expression was low in PD-1+CD28− T cells in the periphery but significantly increased at the tumor site. In contrast, PD-1+CD28+ cells consistently showed high CD26 expression across all regions ( and Supplementary Figure S1a). In the periphery, both the PD-1+CD28− and PD-1+CD28+ T-cell subsets exhibited low CD39 expression (). However, within the tumor site, the PD-1+CD28− T-cell population showed the highest CD39 expression, with levels significantly increased, compared to those in the periphery (Supplementary Figure S1a). Conversely, CD73 expression remained stable across sites () and was consistently highest in PD-1+CD28+ T cells (Suplementary Figure S1a). ADA levels showed no significant differences across sites.
Figure 1. The ADA/CD26 axis provides a higher functional advantage to PD-1+CD28+ T cells, whether as a whole subset or when co-expressing CD39, ADA, and CD26. (a) Representative multicolor flow cytometry plots showing CD26, CD39, CD73, and ADA expression, gated on ex vivo unstimulated PD-1+CD28− and PD-1+CD28+ T-cell subsets from different districts of NSCLC patients; (b) Frequencies of individual CD26, CD39, CD73, and ADA expression in ex vivo unstimulated PD-1+CD28− and PD-1+CD28+ T cells from peripheral blood (P), distal non-tumor tissue (NT), and tumor site (T); (c) Comparison of the frequencies of subpopulations with distinctive CD39, ADA, and CD26 co-expression, between ex vivo unstimulated PD-1+CD28− and PD-1+CD28+ T cells from P, NT, and T; (d) IFN-γ, TNF-α, and GrzB production by subgroups with distinctive co-expression patterns of CD39, ADA, and CD26 within PD1+CD28− and PD1+CD28+ T cells from T of NSCLC patients and stimulated by anti-CD3 mAb (5-6h). p values were calculated using the Wilcoxon rank test with Bonferroni correction for multiple comparisons. *p ≤ 0.05, **p ≤ 0.01. Plots show median values with interquartile range.
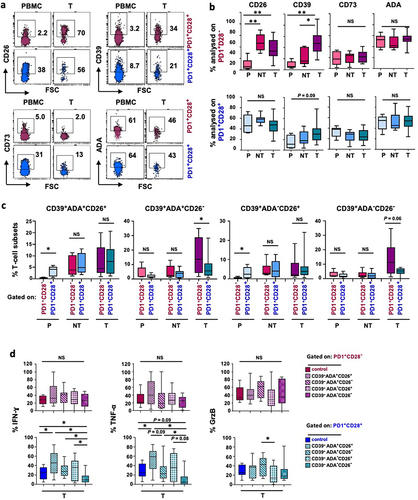
Next, we analyzed the impact of single CD26, CD39, CD73, and ADA expression on T-cell functionality. In peripheral blood, CD26 provided a significant functional advantage to PD-1+CD28− T cells specifically in terms of GrzB expression. PD-1+CD28− T cells, either as a whole population or analyzed based on single CD39, CD73, or ADA expression, exhibited higher IFN-γ and GrzB compared to PD-1+CD28+ T cells (Supplementary Figure S1b, c). However, this functional benefit declined from the periphery to the distal tissue and the tumor site, with IFN-γ and TNF-α levels reaching those of their CD28+ counterparts, although GrzB production remained elevated in CD28− T cells in the tumor (Supplementary Figure S1c).
These findings suggest that although differently distributed within the two subsets across the different districts, the individual CD26, CD39, CD73, or ADA expression does not impact PD-1+CD8+ T-cell functionality in the tumor site of NSCLC patients.
ADA/CD26 axis impacts the functional fitness of CD8+ PD-1+CD28+ CD39+T cells in NSCLC tumor site
We then assessed how diverse CD39, ADA, and CD26 co-expression patterns are distributed within PD-1+CD28− and PD-1+CD28+ T-cell subsets across the three sites in NSCLC patients. CD39 and CD26 co-expression, with or without intracellular ADA, was notably low among PD-1+CD28− T cells in the periphery ( and Supplementary Figure S2a), also compared to their CD28+ counterparts (). Conversely, the frequencies of the CD39+ADA+CD26+ phenotype did not show statistically significant differences between the PD-1+CD28− and PD-1+CD28+ T-cell subsets at the tumor site. The highest CD39+CD26− phenotype observed among PD-1+CD28− T cells in the tumor, with or without intracellular ADA ( and Supplementary Figure S2a), suggests a regulatory-like phenotype associated with CD39+CD26− T cells, as previously reported,Citation13 only in the absence of CD28.
Considering the poor frequencies of peripheral CD39+ subsets and the role of CD39 ectonucleotidase activity in generating immunosuppressive ADO, primarily at the tumor site,Citation17,Citation18 we first focused on the functional impact of the CD26/ADA axis on PD-1+CD28− and PD-1+CD28+ T cells expressing CD39 in the tumor. Simultaneous ADA and CD26 expression in CD39+ T cells provided a substantial functional benefit in terms of IFN-γ and TNF-α production exclusively to PD-1+CD28+ T cells (). This functional advantage was significant, whether over the whole subset or cells lacking both ADA and CD26 (CD39+ADA−CD26−), which exhibited a marked functional decline (, lower panels). Furthermore, the absence of both ADA and CD26 had a more pronounced negative impact on IFN-γ and TNF-α production by PD-1+CD28+ T cells compared to the single lack of either ADA (CD39+ADA−CD26+) or CD26 (CD39+ADA+CD26−) (, lower panels). Overall, the ADA/CD26 axis had minimal impact on GrzB production in both subsets.
When we compared IFN-γ and TNF-α production between CD28− and CD28+ in cells co-expressing ADA and CD26, we detected apparent higher cytokine levels in PD-1+CD28+ T cells, although the differences did not reach statistical significance. Conversely, CD39 expression in the absence of ADA and CD26 provided significantly higher functionality to CD28− T cells at the tumor site (Supplementary Figure S2b).
To rule out a direct role of ADA in counteracting ADO engagement on its receptor, we analyzed the expression of A2AR in PD-1+CD28− and PD-1+CD28+ T cells and in CD39+ subsets with diverse co-expression patterns of ADA and CD26. Notably, total PD-1+CD28+ T cells isolated from the tumor exhibited the highest A2AR expression (Supplementary Figure S2c, upper panel), indicating heightened sensitivity to ADO’s immunosuppressive activity. However, when comparing the frequency of A2AR expression between the CD39+ subgroups with or without ADA and CD26, we did not observe differences between PD-1+CD28+ and PD-1+CD28+ T cells (Supplementary Figure S2c, bottom panel). These findings suggest a distinct mechanism from neutralizing the immunosuppressive effects of ADO through A2AR engagement, instead mediated by ADA and CD26 co-expression as a co-stimulatory axis conferring functional advantage to PD1+CD28+ CD39+ T cells.
When examining PD-1+CD28− and PD-1+CD28+ T cells co-expressing CD39 and CD73, we found that the subgroups, with or without ADA and CD26, were expressed at low frequencies (Supplementary Figure S2d, upper panel). Notably, the co-expression of ADA and CD26 conferred a significant functional advantage in terms of IFN-γ production to PD-1+CD28+ T cells co-expressing CD39 and CD73 compared to both the entire subset (p = 0.009) and cells lacking ADA and CD26 (p = 0.007).
ADA impacts PD-1+CD8+ T cell functionality in the tumor site
We aimed to establish the direct influence of ADA on the functional capability of CD8+ PD-1/CD28 subsets within the NSCLC tumor site using the specific ADA inhibitor EHNA,Citation19 focusing on the production of IFN-γ, a primary functional target affected by ADA deficiency.Citation20
ADA inhibition proved detrimental in the whole PD-1+CD28+ T-cell population (, bottom panel) and in the subgroup co-expressing CD39, ADA, and CD26 (, left bottom panel).
Figure 2. In a CD39-enriched setting, PD1+CD28+ T-cell functionality relies on an autocrine ADA/CD26 axis, which emerges as a predictive signature for OS and responsiveness to ICB. (a-b) Effect of ADA inhibition (ADAi) with the specific inhibitor EHNA on IFN-γ production in T cells isolated from NSCLC tumor sites, stimulated by anti-CD3 mAb (5-6h). ADAi impact was assessed on PD-1+CD28− and PD-1+CD28+ T cells (a) and on subgroups with distinctive co-expression patterns of CD39, ADA, and CD26 (b, left panels) or CD39, CD73, ADA, and CD26 (b, right panels). p values were calculated using the Wilcoxon rank test. *p ≤ 0.05, **p ≤ 0.01. (c) Kaplan-Meier curve showing OS probability of adenocarcinoma patients from the TCGA-LUAD and OAK datasets. Patient numbers at risk and P-values are displayed. Significance was assessed using the log-rank test; (d) Bar plots showing the percentage of patients from the OAK cohort stratified according to the High/Low scores of our signature and categorized as Responders (R) and Non-Responders (NR) to ICB based on CD28high (left panel) and CD28low (right panel) expression. Significance was determined through the Fisher’s Exact test.
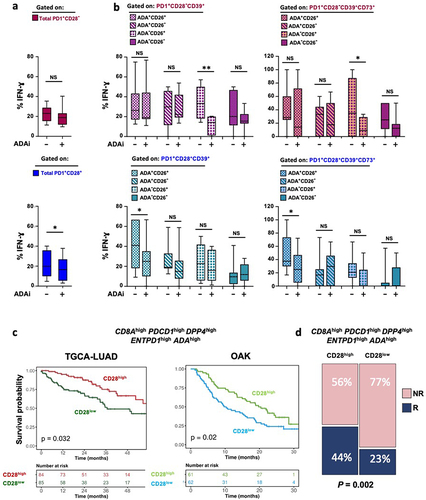
Conversely, a non-significant impact was observed on the whole PD-1+CD28− population following ADA inhibition (, upper panel). Notably, PD-1+CD28− T cells co-expressing CD39 and CD26 but lacking intracellular ADA showed significant IFN-γ reduction mediated by ADA inhibition (, left upper panel). These results were consistent in T-cell subsets co-expressing CD39 and CD73 (, right panels).
Since ADA can be released into the extracellular milieu and engage with CD26 on neighboring T cells,Citation7 our findings suggest a pivotal role for exogenous ADA in delivering a co-stimulatory signal via interaction with CD26 on CD8+PD-1+ T cells lacking CD28 within the NSCLC tumor site. Conversely, the functional fitness of PD-1+CD28+ T cells appears to rely more on an autocrine ADA/CD26 axis.
The ADA/CD26 axis in CD8+PD-1+CD28+ T cells provides a signature predicting outcomes in lung ADC and ICB Response in advanced NSCLC
To translate our findings into the clinical setting and identify patients gaining benefit from the ADA/CD26 axis on PD-1+CD28+ T cells in the context of an immunosuppressive tumor environment enriched with CD39, we constructed a signature based on our multiparametric results. The signature included CD8, PDCD1 (PD-1), ENTPD1 (CD39), ADA, and DPP4 (CD26) and was initially assessed in the lung adenocarcinoma TCGA-LUAD dataset, stratified into CD28high or CD28low groups. Remarkably, high CD28 expression correlated strongly with improved survival outcomes in NSCLC patients harboring our signature in the LUAD TCGA (p = 0.032) and OAK datasets, the latter involving patients with advanced lung adenocarcinoma undergoing atezolizumab treatment (p = 0.02) ().
To validate our findings in terms of response prediction to ICB, we delved into data from the OAK database and found that our signature was significantly associated with higher response to ICB in NSCLC patients when CD28 expression was high at the tumor site (p = 0.02 ).
Notably, recognizing the potential impact of CD4+CD26+ T-cell subpopulation in ICB response,Citation3 we analyzed the same signature in CD4+ T cells within the TCGA and OAK datasets. As shown for CD8+ T cells, we found that this signature discriminates survival (p = 0.015, p = 0.021) (Supplementary Figure S3a, b) and response to ICB (p = 0.02 Supplementary Figure 3b) in NSCLC patients, in the presence of CD4+ T cells and high CD28 expression.
In conclusion, our findings establish a compelling link between high CD28 expression and the ADA/CD26 axis in improving survival outcomes in LUAD patients, featuring our identified signature as a potential prognostic and predictor of favorable responses to ICB.
Discussion
To explore the mechanism driving the beneficial influence of CD28 expression on CD8+ PD-1+ T cells in the transition from the periphery to the NSCLC tumor site, as we have recently reported,Citation1 we focused on the ADA/CD26 axis within a microenvironment enriched in CD39-expressing T cells.
Our findings shed light on the potential significance of the ADA/CD26 axis in sustaining the functional fitness of PD-1+CD28+ T cells, correlated with enhanced OS in LUAD patients and treatment responsiveness in advanced patients undergoing ICB therapy.
Notably, co-expression of ADA and CD26 confers a remarkable functional benefit specifically to PD-1+CD28+ T cells, particularly in terms of IFN-γ and TNF-α production. This advantage was evident when compared to either the whole PD-1+CD28+ subset or cells lacking both ADA and CD26, which exhibited an evident functional impairment (), and was confirmed in PD1+CD28+ T cells co-expressing CD39 and CD73 (Supplementary Figure S2d).
It would be of interest to evaluate whether CD26 expression in CD8+PD-1+CD28+ T cells is associated with elevated secretion of the pro-inflammatory cytokine IL-6, as recently reported for CD4+ T cells.Citation3 This analysis could provide further insights beyond the well-defined cytotoxic molecules.
The comparable levels of A2AR found across subgroups characterized by CD39, ADA, and CD26 within both PD-1+CD28− and PD-1+CD28+ T cells (Supplementary Figure S2c, lower panel) suggest that the functional benefit observed in CD28+ T cells within a CD39-enriched environment primarily stems from ADA’s interaction with CD26 rather than the neutralization of extracellular ADO.Citation9,Citation21 These findings highlight a specific role of the autocrine ADA/CD26 axis in counteracting the detrimental effect of CD39 in tumor-associated PD-1+CD28+ T cells.
Blockade experiments further confirmed the significant impact of ADA on the functional capability of CD8+PD-1+CD28+ T cells, both as a whole population and a CD39+ADA+CD26+ subgroup, suggesting a heightened reliance on autocrine ADA. Conversely, the functionality of the PD-1+CD28− subset appears to rely more on CD26 engagement of ADA produced by neighbor cells (). This aligns with previous studies reporting that CD8+CD28+ T cells release a higher extracellular ADA with respect to the CD28− subset, while ADO decreases the CD28 expression.Citation22,Citation23 We envision that the progressive Ag-mediated terminal differentiation of T cells, leading to CD28 loss, diminishes their ability to release ADA,Citation23 potentially increasing their reliance on exogenous ADA, likely produced by CD28+ T cells. Further studies are required to unveil whether this heightened reliance of PD-1+CD28+ T cells on intracellular ADA may reflect a possible increase of inosine mediated by ADA, critical for sustaining T-cell metabolism and functionality, especially under conditions of glucose restriction.Citation8
When we compared IFN-γ and TNF-α production between CD28− and CD28+ in cells co-expressing ADA and CD26, we found noticeably higher cytokine levels in PD-1+ CD28+ T cells. Although these differences did not reach statistical significance, we envisage that a larger sample size could better validate the functional advantage of the ADA/CD26 axis in the CD28+ population compared to CD28− T cells. Conversely, the superior functionality observed in CD39+ADA−CD26−CD28− T cells confirms that CD8+CD28− T cells are less dependent on the autocrine ADA/CD26 axis for their functionality and possibly indicates a CD39+ADA−CD26−CD28− regulatory T-cell phenotype with functional effector features. This possibility aligns with previous indicationsCitation24 and warrants further investigation.
Notably, the positive impact of the ADA/CD26 axis on the functionality of PD-1+CD28+ T cells within a CD39-enriched context may have significant clinical implications.
ADA overexpression has been reported to enhance the anti-tumor efficacy of Chimeric Ag Receptor-Engineered (CAR) T cells in preclinical models,Citation25 while CD26 has recently been proposed as a response biomarker to PD-1 blockade.Citation3 On the other hand, CD28 expression in CD8+ T cells has been advocated as a crucial biomarker of ICB response.Citation1,Citation26 Our focus on a specific PD-1+CD28+ T-cell subpopulation, which benefits the most from ADA and CD26 co-expression, enhances the comprehension of the intricate interplay regulating anti-tumor responses. On these bases, our signature predicts survival outcomes and response to ICB in LUAD patients and paves the way for the ADA/CD26 axis as a promising target for innovative approaches aimed at improving the efficacy of immunotherapeutic interventions in NSCLC.
Consent for publication
All Authors reviewed and approved the manuscript.
Ethics approval and consent to participate
The study was conducted according to the guidelines of the Declaration of Helsinki and approved by the Ethics Committee of the IRCCS Lazio (N. 1008/17). Patients donated biological samples, after written informed consent.
List of Abbreviations
| ADA | = | Adenosine deaminase |
| ADO | = | Adenosine |
| ADP. | = | Adenosine diphosphate |
| ATP. | = | Adenosine triphosphate |
| AMP. | = | Adenosine monophosphate |
| A2AR | = | Adenosine 2A receptor |
| EHNA | = | Erythro-9-(2-hydroxy-3-nonyl) adenine |
| GrzB | = | Granzyme B |
| HS | = | Human serum |
| ICB | = | Immune Checkpoint Blockade |
| IFN | = | Interferon |
| LUAD | = | Lung adenocarcinoma |
| NR | = | Non-Responder |
| NSCLC | = | Non-small cell lung-cancer |
| NT | = | Adjacent non-tumor tissue |
| mAb | = | Monoclonal antibody |
| OS | = | Overall survival |
| P | = | Peripheral blood |
| PBMC | = | Peripheral blood mononuclear cell |
| PD-1 | = | Programmed cell death protein 1 |
| PD-L1 | = | Programmed cell death-ligand 1 |
| R | = | Responder |
| rhIL-2 | = | Recombinant human Interleukin-2 |
| T | = | Tumor site |
| TCGA | = | The cancer genome atlas |
| TNF | = | Tumor necrosis factor |
Table_S1.docx
Download MS Word (64.8 KB)Fig_S1a.jpeg
Download JPEG Image (366 KB)
Fig_S2b.jpeg
Download JPEG Image (230.9 KB)
Fig_S3.jpeg
Download JPEG Image (142.3 KB)
Fig_S2a.jpeg
Download JPEG Image (197 KB)
Fig_S1b.jpeg
Download JPEG Image (267.5 KB)
Acknowledgments
Tissue samples were provided by Biobank IRCCS-Regina Elena National Cancer Institute (BBIRE), Rome, Italy. The authors thank the patients for participating in the study and for the sample donation. The Authors are grateful to Maria Vincenza Sarcone for secretarial assistance. This work partly relies on data from the TCGA Research Network: https://www.cancer.gov/tcga.
Disclosure statement
No potential conflict of interest was reported by the author(s).
Data availability statement
Flow cytometry data that support the findings of this study are available from the corresponding Authors, PN and OF, upon reasonable request. TCGA LUAD dataset was downloaded from https://xenabrowser.net/. OAK dataset was downloaded from https://ega-archive.org/ after a formal request to Genentech.
Supplementary material
Supplemental data for this article can be accessed online at https://doi.org/10.1080/2162402X.2024.2371051
Correction Statement
* These authors contributed equally.This article has been republished with minor changes. These changes do not impact the academic content of the article.
Additional information
Funding
References
- Palermo B, Franzese O, Frisull G, D’Ambrosio L, Panetta M, Campo G, D’Andrea D, Sperduti I, De Nicola F, Goeaman F, et al. CD28/PD1 Co-expression: Dual impact on CD8+ T cells in peripheral blood and tumor tissue and its significance in NSCLC patients’ survival and ICB response. J Exp Clin Cancer Res. 2023;42(1):287. doi:10.1186/s13046-023-02846-3.
- Klemann C, Wagner L, Stephan M, von Hörsten S. Cut to the chase: a review of CD26/dipeptidyl peptidase-4‘s (DPP4) entanglement in the immune system. Clin Exp Immunol. 2016;185(1):1–8. doi:10.1111/cei.12781.
- Galati D, Zanotta S, Capone M, Madonna G, Mallardo D, Romanelli M, Simeone E, Festino L, Sparano F, Azzaro R, et al. Potential clinical implications of CD4+CD26high T cells for nivolumab treated melanoma patients. J Transl Med. 2023;21(1):318. doi:10.1186/s12967-023-04184-6.
- Cortés A, Gracia E, Moreno E, Mallol J, Lluís C, Canela EI, Casadó V. Moonlighting adenosine deaminase: a target protein for drug development. Med Res Rev. 2015;35(1):85–125. doi:10.1002/med.21324.
- Dong RP, Kameoka J, Hegen M, Tanaka T, Xu Y, Schlossman SF, Morimoto C. Characterization of adenosine deaminase binding to human CD26 on T cells and its biologic role in immune response. J Immunol. 1996;156(4):1349–1355. doi:10.4049/jimmunol.156.4.1349.
- Pacheco R, Martinez-Navio JM, Lejeune M, Climent N, Oliva H, Gatell JM, Gallart T, Mallol J, Lluis C, Franco R. CD26, adenosine deaminase, and adenosine receptors mediate costimulatory signals in the immunological synapse. Proc Natl Acad Sci U S A. 2005;102(27):9583–9588. doi:10.1073/pnas.0501050102.
- Cordero OJ, Salgado FJ, Fernández-Alonso CM, Herrera C, Lluis C, Franco R, Nogueira M. Cytokines regulate membrane adenosine deaminase on human activated lymphocytes. J Leukoc Biol. 2001;70(6):920–930. doi:10.1189/jlb.70.6.920.
- Wang T, Gnanaprakasam JNR, Chen X, Kang S, Xu X, Sun H, Liu L, Rodgers H, Miller E, Cassel TA, et al. Inosine is an alternative carbon source for CD8±T-cell function under glucose restriction. Nat Metab. 2020;2(7):635–647. doi:10.1038/s42255-020-0219-4.
- Ma SR, Deng WW, Liu JF, Mao L, Yu GT, Bu LL, Kulkarni AB, Zhang WF, Sun ZJ. Blockade of adenosine A2A receptor enhances CD8+ T cells response and decreases regulatory T cells in head and neck squamous cell carcinoma. Mol Cancer. [2017 June 7]. 16(1):99. doi:10.1186/s12943-017-0665-0.
- Shevchenko I, Mathes A, Groth C, Karakhanova S, Müller V, Utikal J, Werner J, Bazhin AV, Umansky V. Enhanced expression of CD39 and CD73 on T cells in the regulation of anti-tumor immune responses. Oncoimmunology. 2020;9(1):1744946. doi:10.1080/2162402X.2020.1744946.
- Ziebart A, Huber U, Jeske S, Laban S, Doescher J, Hoffmann TK, Brunner C, Jackson EK, Schuler PJ. The influence of chemotherapy on adenosine-producing B cells in patients with head and neck squamous cell carcinoma. Oncotarget. 2017;9(5):5834–5847. doi:10.18632/oncotarget.
- Schuler PJ, Saze Z, Hong CS, Muller L, Gillespie DG, Cheng D, Harasymczuk M, Mandapathil M, Lang S, Jackson EK, et al. Human CD4+CD39+ regulatory T cells produce adenosine upon co-expression of surface CD73 or contact with CD73+ exosomes or CD73+ cells. Clin Exp Immunol. 2014;177:531–543. doi:10.1111/cei.12354.
- Mandapathil M, Szczepanski M, Harasymczuk M, Ren J, Cheng D, Jackson EK, Gorelik E, Johnson J, Lang S, Whiteside TL. CD26 expression and adenosine deaminase activity in regulatory T cells (Treg) and CD4(+) T effector cells in patients with head and neck squamous cell carcinoma. Oncoimmunology. [2012 Aug 1]. 1(5):659–669. doi:10.4161/onci.20387.
- Bailey SR, Nelson MH, Majchrzak K, Bowers JS, Wyatt MM, Smith AS, Neal LR, Shirai K, Carpenito C, June CH, et al. Human CD26high T cells elicit tumor immunity against multiple malignancies via enhanced migration and persistence. Nat Commun. 2017;8(1):1961. doi:10.1038/s41467-017-01867-9.
- Hatano R, Ohnuma K, Yamamoto J, Dang NH, Morimoto C. CD26-mediated co-stimulation in human CD8(+) T cells provokes effector function via pro-inflammatory cytokine production. Immunology. 2013;138(2):165–172. doi:10.1111/imm.12028.
- Giatromanolaki A, Kouroupi M, Pouliliou S, Mitrakas A, Hasan F, Pappa A, Koukourakis MI. Ectonucleotidase CD73 and CD39 expression in non-small cell lung cancer relates to hypoxia and immunosuppressive pathways. Life Sci. 2020;259:118389. doi:10.1016/j.lfs.2020.118389.
- Ramakers BP, Pickkers P, Deussen A, Rongen GA, van den Broek P, van der Hoeven Jg, Smits P, Riksen NP. Measurement of the endogenous adenosine concentration in humans in vivo: methodological considerations. Curr Drug Metab. 2008;9(8):679–685. doi:10.2174/138920008786049249.
- Blay J, White TD, Hoskin DW. The extracellular fluid of solid carcinomas contains immunosuppressive concentrations of adenosine. Cancer Res. 1997;57(13):2602–2605.
- Cristalli G, Eleuteri A, Franchetti P, Grifantini M, Vittori S, Lupidi G. Adenosine deaminase inhibitors: synthesis and structure-activity relationships of imidazole analogues of erythro-9-(2-hydroxy-3-nonyl)adenine. J Med Chem. 1991 Mar;34(3):1187–1192. doi:10.1021/jm00107a044.
- Cassani B, Mirolo M, Cattaneo F, Benninghoff U, Hershfield M, Carlucci F, Tabucchi A, Bordignon C, Roncarolo MG, Aiuti A. Altered intracellular and extracellular signaling leads to impaired T-cell functions in ADA-SCID patients. Blood. 2008;111(8):4209–4219. doi:10.1182/blood-2007-05-092429.
- Mastelic-Gavillet B, Navarro Rodrigo B, Décombaz L, Wang H, Ercolano G, Ahmed R, Lozano LE, Ianaro A, Derré L, Valerio M, et al. Adenosine mediates functional and metabolic suppression of peripheral and tumor-infiltrating CD8+ T cells. J Immunother Cancer. 7(1):257. doi:10.1186/s40425-019-0719-5.
- Parish ST, Kim S, Sekhon RK, Wu JE, Kawakatsu Y, Effros RB. Adenosine deaminase modulation of telomerase activity and replicative senescence in human CD8 T lymphocytes. J Immunol. 2010;184(6):2847–2854. doi:10.4049/jimmunol.0903647.
- Butler JJ, Mader JS, Watson CL, Zhang H, Blay J, Hoskin DW. Adenosine inhibits activation-induced T cell expression of CD2 and CD28 co-stimulatory molecules: role of interleukin-2 and cyclic AMP signaling pathways. J Cell Biochem. 2003;89(5):975–991. doi:10.1002/jcb.10562.
- Dikiy S, Rudensky AY. Principles of regulatory T cell function. Immunity. [2023 Feb 14]. 56(2):240–255. doi:10.1016/j.immuni.2023.01.004.
- Qu Y, Dunn ZS, Chen X, MacMullan M, Cinay G, Wang HY, Liu J, Hu F, Wang P. Adenosine deaminase 1 overexpression enhances the antitumor efficacy of chimeric antigen receptor-engineered t cells. Hum Gene Ther. 2022;33(5–6):223–236. doi:10.1089/hum.2021.050.
- Duraiswamy J, Turrini R, Minasyan A, Barras D, Crespo I, Grimm AJ, Casado J, Genolet R, Benedetti F, Wicky A, et al. Myeloid antigen-presenting cell niches sustain antitumor T cells and license PD-1 blockade via CD28 costimulation. Cancer Cell. 2021;39(12):1623–1642.e20. doi:10.1016/j.ccell.2021.10.008.