
ABSTRACT
Isolation of tumor-specific T cells and their antigen receptors (TCRs) from malignant pleural effusions (MPE) may facilitate the development of TCR-transduced adoptive cellular immunotherapy products for advanced lung cancer patients. However, the characteristics and markers of tumor-specific T-cells in MPE are largely undefined. To this end, to establish the phenotypes and antigen specificities of CD8+ T cells, we performed single-cell RNA and TCR sequencing of samples from three advanced lung cancer patients. Dimensionality reduction on a total of 4,983 CD8+ T cells revealed 10 clusters including naïve, memory, and exhausted phenotypes. We focused particularly on exhausted T cell clusters and tested their TCR reactivity against neoantigens predicted from autologous cancer cell lines. Four different TCRs specific for the same neoantigen and one orphan TCR specific for the autologous cell line were identified from one of the patients. Differential gene expression analysis in tumor-specific T cells relative to the other T cells identified CXCL13, as a candidate gene expressed by tumor-specific T cells. In addition to expressing CXCL13, tumor-specific T cells were present in a higher proportion of T cells co-expressing PDCD1(PD-1)/TNFRSF9(4-1BB). Furthermore, flow cytometric analyses in advanced lung cancer patients with MPE documented that those with high PD-1/4-1BB expression have a better prognosis in the subset of 57 adenocarcinoma patients (p = .039). These data suggest that PD-1/4-1BB co-expression might identify tumor-specific CD8+ T cells in MPE, which are associated with patients’ prognosis. (233 words)
Background
Lung cancer is one of the most commonly occurring solid tumors and one of the leading causes of cancer death worldwideCitation1. Malignant pleural effusion (MPE) is a serious complication of advanced lung cancer, signifying relatively high morbidity, severely affecting patient survival. Chemotherapy, targeted therapy, immunotherapy, or combinations thereof are now available as therapeutic options for advanced lung cancer patients.Citation2 Of these, the recent development of immune checkpoint inhibitors (ICI) has revolutionized treatment success.Citation3 Nonetheless, although lung cancer is one of the most ICI-sensitive cancers, this approach is still only effective in a fraction of patients.Citation4–6 Therefore, developing novel therapeutic strategies for more efficacious immunotherapy for advanced lung cancer with MPE is urgently needed.
Cell transfer therapies using activated lymphocytes originating from MPE through intrapleural infusion have been conducted previously, but these strategies did not focus on antigen-specific T-cell populations.Citation7 CAR-T therapy for cancers expressing targets such as mesothelin has been attempted in lung mesothelioma.Citation8 However, lung cancer is void of possible safe CAR-T targets expressed specifically on the tumor cell surface. Cytotoxic CD8+ T cells (CTLs) are critical immune cells that can specifically eliminate tumor cells expressing tumor antigens.Citation9 Mutation-derived neoantigens are important tumor-specific targets for both naturally induced and ICI-reactivated CTLs.Citation10 Thus, isolation of tumor-specific CTLs from MPE and the characterization of their antigen receptors (TCRs) recognizing tumor-specific antigens may guide the development of TCR-transduced adoptive cellular immunotherapiesCitation11 for advanced lung cancer patients. In addition, their characterization may also accelerate the development of biomarkers for patients’ prognosis.
Several previous studies have attempted to identify tumor-specific T cells by repeated lymphocyte stimulation in vitro or through the isolation of T cells with activation or exhaustion markers such as PD-1, 4-1BB and CD39 expressed on tumor infiltrating lymphocytes (TILs).Citation12–14 Recently, we and others have reported that single-cell sequencing reveals heterogeneous populations of TILs in several different cancer entities, and demonstrated that T-cells that recognize tumor antigens can be identified by their particular cell surface phenotypes.Citation15–18 However, to the best of our knowledge, there has been no attempt to perform similar analyses in advanced lung cancer MPE.
Accordingly, in the present study, we performed high-throughput single-cell RNA sequencing (scRNA-sq) and single-cell TCR sequencing (scTCR-seq) on CD8+ T cells in MPE from advanced lung cancers. We investigated tumor-specific T-cell populations by phenotyping and TCR analyses and their responses to mutation-derived neoantigens. We compared the tumor antigen-specific T cell genes in MPE to lung TILs from surgically resected tumor tissues (Stage I-III). We further investigated associations between the frequency of putative tumor-specific CD8+ T cells in MPE and the patient’s prognosis.
Materials and methods
Patients
Malignant pleural effusions (MPE) and matched blood samples were collected from 69 patients with advanced lung cancer (Stage IV or recurrent cancer) treated at the Aichi Cancer Center, Nagoya University, and the Tokyo Metropolitan Cancer and Infectious Disease Center, Komagome Hospital between April 2019 and July 2020. All patients underwent a standard thoracocentesis procedure to collect MPE. MPE cells were centrifuged, washed twice with PBS, filtered through a 100-μm strainer (Greiner Bio-One, Frickenhausen, Germany), and counted manually in a hemocytometer. MPE cells (2–5×10⁶ cells/tube) were cryopreserved with CP-1 (Kyokutoseiyaku, Tokyo, Japan) and stored at −135°C until use. We succeeded in establishing cancer cell lines from six cases. Of these six, single-cell analysis was performed in three patients from whom abundant MPE cells could be harvested. All procedures were in accordance with the ethical standards of the institutions and with the 1964 Helsinki Declaration and its later amendments or comparable ethical standards. This study was approved by the Ethics Committees of Aichi Cancer Center (2018-2-20) and other institutions. Written informed consent was obtained from all individual participants included in the study.
Whole exome sequencing (WES) and RNA sequencing (RNA-seq)
WES and RNA-seq were performed as previously described.Citation19 Briefly, for WES, sequencing libraries of genomic DNA from three cell lines (KOM002, LK006, and LK208 derived from MPE Pt1, MPE Pt2, and MPE Pt3, respectively) and matched PBMCs were prepared using the SureSelect Human All Exon V6 probe (Agilent Technologies) following the manufacturer’s protocols. The enriched libraries were sequenced as 150-bp paired-end reads using the Novaseq (Illumina, San Diego, CA, USA) at Veritas Genetics (Danvers, MA, USA). Exome reads were independently mapped to the human genome (GRCh38/hg38) using the Burrows–Wheeler Aligner (BWA, RRID:SCR_010910). Putative somatic mutations were detected using the EBcall (Empirical Bayesian mutation Calling) algorithm.Citation20
For RNA-seq, an RNA-seq library was prepared from the three cell lines using the NEBNext® Ultra™ RNA Library Prep Kit for Illumina ® (New England Biolabs, Ipswich, MA, USA) following the manufacturer’s protocols. The enriched libraries were sequenced as 150-bp paired-end reads using NovaSeq (Illumina) at Veritas Genetics. RNA-seq data were analyzed using SalmonCitation21 and RNA reads were mapped to the reference genome (GRCh38/hg38) using BWA (RRID:SCR_010910). Gene expression values were calculated as transcripts per million (TPM) using GENCODE v 33.
Neoantigen prediction
The neoantigen prediction technology applied here was identical to our previous study.Citation18 In summary, the immunogenicity of tumor-specific mutations was estimated using the NEC Immune Profiler (NIP) software from NEC OncoImmunity, comprising several proprietary machine-learning (ML) prediction algorithms. The algorithm considers the following features when predicting the immunogenicity of a candidate:
The binding affinity of the peptide to HLA alleles. NIP exploits several binding affinity ML predictors that compute IC50 (nM) scores for each mutated peptide.
The peptide’s ability to be efficiently handled by the antigen processing machinery (APM). An ensemble of 13 Support Vector Machines (SVM) included in NIP and trained on validated mass spectrometry immunopeptidome datasets determine which peptides have the optimal features to be efficiently processed by the APM, which include the probability of cleavage by the proteasome and antigen processing transport (TAP) efficiency.
The expression of the candidate neoantigen. The expression of each candidate was computed by summing the values (TPMs) of all the isoforms coding for the specific peptides under consideration. To determine the specific abundance of the mutated peptide, the sum of the levels of all the isoforms containing the peptide was adjusted according to the variant allele frequency (VAF) computed at the RNA level.
The ability of the somatic mutation’s originator protein to generate peptides with adequate properties to be antigen processed.
HLA Class I neoantigen predictions were made for each of the three patients for peptides of 9 and 10 residues.
Flow cytometry
Exhaustion-related markers were stained on 69 lung cancer MPE specimens, of which 35 with sufficient sample stock were additionally stained for CXCL13 intracellularly. The cryopreserved MPE cells were thawed in 2%FBS/PBS and then stained after blocking Fc receptors using Human BD Fc Block™ (BD Biosciences, San Jose, CA, USA). Antibodies used in this study are summarized in Supplementary Table S1. For CXCL13 staining, 1 µL of BD GolgiPlug™ Protein Transport Inhibitor (BD Biosciences, San Jose, CA, USA) was added to 1 mL of cell culture medium and incubated for 5 h, followed by blocking Fc receptors. After staining cell surface antigens, Fixation/Permeabilization solution was added to fix and permeabilize the cells. Zombie NIR™ Fixable Viability Kit (BioLegend) was used to exclude dead cells. Stained cells were analyzed using an LSRFortessa flow cytometer (BD Biosciences) and the data processed using FlowJo 10.0.7 (FlowJo, RRID:SCR_008520).
Preparation of single-cell cDNA libraries
Cryopreserved MPE cells were thawed in RPMI and then stained using the following monoclonal antibodies (mAbs): APC anti-human CD3 (clone UCHT1; Cat. No. 300439, RRID: AB_2562045; BioLegend) and FITC anti-human CD8 (clone SK1; Cat. No. 344704, RRID: AB_1877178; BioLegend). Zombie NIR™ Fixable Viability Kit (BioLegend) was used to exclude dead cells. CD3+CD8+ cells were sorted on an Aria III (BD Biosciences).
GEM (Gel Bead-In EMulsions) generation and barcoding from single-cell suspensions (5,000–10,000 CD8+ T cells) was performed using the Chromium Next GEM Single Cell 5’ GEM Kit v2 (PN-1000244) on the Chromium Next GEM Chip K Single-Cell Kit (PN-1000286) according to the manufacturer’s instructions (10× Genomics, Pleasanton, CA). After GEMs were broken and pooled cDNAs were amplified, TCR target amplification was done using a TCR amplification Kit (PN-1000252). The TCR and gene expression cDNA libraries were constructed using the Library Construction Kit (PN-1000190). The cDNA quality was assessed using an Agilent 2100 bioanalyzer system (Agilent, Santa Clara, CA) and sequenced using a HiSeq System (Illumina, San Diego, CA) with a pair-end 150 bp sequencing strategy.
Preprocessing of paired scRNA-seq and scTCR-seq data
Raw sequencing data for RNA expression and VDJ from human CD8+ T scRNA sequencing were processed using Cell Ranger software (version 6.0.1; 10× Genomics). RNA expression data were aligned to the GRCh38 reference genome and VDJ sequencing data to the GRCh38 VDJ reference pre-built by 10X Genomics (refdata-gex- GRCh38–2020-A) (Zheng et al., 2017). Gene expression count matrices were imported into the R package Seurat [https://doi.org/10.1016/j.cell.2021.04.048] (version 4.3.0) using R (version 4.3.0). Genes found to be expressed in <3 cells, as well as cells with <200 expressed genes, were excluded from the analysis. TCR genes were also removed from the count data. Cells filtered to retain those with ≤10% mitochondrial RNA content and with several unique molecular identifiers (UMIs) numbered between 200 and 5,000. RNA expression data were normalized against total expression per cell and natural log-transformed with a scale factor of 10,000.
After batch effect correction, we created an ‘integrated’ data assay for downstream analysis. We found a set of anchors using the FindIntegrationAnchors function and used these to integrate the three datasets. Counts were log-normalized, scaled, and centered. The 2000 most-variable features were calculated with variance-stabilizing transformation and used for principal component (PC) analysis. Clustering was performed with Seurat: FindClusters with the resolution set to 0.4. Dimension reduction was performed with uniform manifold approximation and projection (UMAP). For pseudotime analysis, the Seurat object was converted to a CellDataset object and Monocle 3 (version 1.3.1) was used to infer and build the developmental trajectory using naïve T cells as the root cluster.
Differential Expression (DE) analysis and Gene Set Enrichment Analysis (GSEA)
To identify genes differentially expressed between tumor-specific T cells (n = 29) and the others (n = 4,954), we used the FindMarkers() in Seurat using the “wilcox” (Wilcoxon rank sum test). Fast Gene Set Enrichment Analysis (fgsea) (version 1.26.0) was performed to evaluate T cell signaling, proliferation and cytokine production using gene sets in MSigDB v2022.1.HS (https://www.gsea-msigdb.org/gsea/msigdb).
Generation of autologous B cell antigen-presenting cells (B-APCs)
Autologous B-APCs were generated from the peripheral blood mononuclear cells (PBMCs) of each patient. γ-irradiated (96 Gy) human CD40L-transfected NIH3T3 cellsCitation22 (t-CD40L; kindly provided by Dr G. Freeman, Dana-Farber Cancer Institute, Boston, MA) were plated in six-well plates and cultured overnight at 37°C in 5% CO2. PBMCs were cultured at 4–6×10⁶ cells/well on t-CD40L cells in the presence of IL-4 (4 ng/ml; PeproTech, Cranbury, NJ).
Screening of TCR antigen specificity using transcriptionally active PCR (TAP) fragments
Screening of TCR antigen specificity using transcriptionally active PCR (TAP) fragments was performed as previously reported.Citation23 Briefly, eBlocks genes (IDT) encoding variable regions of the TCRα and β chains were amplified by PCR. The amplified DNAs were assembled into linearized plasmid vectors containing a constant region of a TCRα or TCRβ chain by the Gibson Assembly method. TAP fragments of TCRα and TCRβ together with the pGL4.30 [luc2P/NFAT-RE/Hygro] vector (Promega E8481) were transfected into the ΔTCRβ Jurkat cell-line J.RT3-T3.5 (ATCC Cat# TIB-153, RRID:CVCL_1316) expressing CD8α (CD8-J2)Citation24 by electroporation (Neon Electroporation System, Thermo Fisher) (CD8-J2-Luc-TCR). 5 × 10⁴ CD8-J2-Luc-TCR cells were cultured overnight in the presence of autologous B-APC (2×10⁴) or tumor cell-line cells (5×10⁴) with or without antigenic peptides. Activation of the NFAT reporter gene was measured by the Steady-Glo Luciferase Assay System (Promega).
Generation of CD8-J2 cells stably expressing TCRs (stable CD8-J2-TCR cells)
To express TCRs stably, the synthesized TCRβ chain gene encoding a VDJ region (eBlocks), codon-optimized gene encoding the TCRβ constant region conjugated with the self-cleaving P2A peptide, the synthesized TCRα chain gene encoding a VJ region (eBlocks), and the codon-optimized TCRα constant region gene were assembled together in a linearized pMXs-IRES-puro retroviral vector (Cat. No. RTV-014, CELL BIOLABS INC) using the NEBuilder HiFi DNA Assembly Master Mix (New England Biolabs, E2621). The constructed plasmid vector, pMXs-TCRβ-P2A-TCRα-IRES-puro, was utilized for retrovirus production. We used a retrovirus-packaging cell line (PhoenixGP-GaLV)Citation25 to produce a retrovirus for transducing TCR genes. The CD8-J2 cells retrovirally transduced with TCRs were cultured in the presence of puromycin (1 µg/ml) for selection (stable CD8-J2-TCR cells).
Generation of γδT cells expressing TCRs and their specificity against autologous cell lines
The γδT cells in PBMC were expanded with 100 U/ml IL-2 (PeproTech) and 5 μM zoledronate (Novartis) followed by the addition of 25 μg/ml of IL-7 and IL-15 (PeproTech). The cloned TCRαβ as well as the CD8 gene were retrovirally transduced into γδT cells in recombinant human fibronectin fragment CH-296 (Retronectin; Takara Bio)-coated 24-well plates (FALCON). TCRαβ-transduced γδT cells were purified by puromycin selection. TCR-transduced γδT cells (6 × 10⁴/ml) were incubated with KOM002 cells (6 × 10⁵/ml) in RPMI with 1% FBS overnight, and the amount of IFN-γ in the culture supernatant was measured in a triplicate assay using an IFN-γ ELISA test kit (Life Technologies, Inc) in accordance with the manufacturer’s instructions.
Specificity of stable CD8-J2-TCR cells determined using autologous cancer cells
Autologous cancer cells (5×10⁴) were plated with stable CD8-J2-TCR cells (5×10⁴) transduced with the pGL4.30 [luc2P/NFAT-RE/Hygro] vector. Purified anti-human HLA-A, B, C antibody (clone W6/32; Cat. No. 311402, RRID: AB_314871; BioLegend) was used for blocking HLA-restricted responses. After 4-h incubation, activation of the reporter gene driven by the NFAT-response element was measured by the Steady-Glo Luciferase Assay System according to the manufacturer’s instructions (Promega).
Statistical analysis
All data were analyzed using R version 4.3.0 (R Project for Statistical Computing, RRID:SCR_001905). The comparison of T-cell marker expression was performed using Mann–Whitney U-test. Overall survival (OS) was evaluated using the Kaplan–Meier method by the log-rank test. A value of p < 0.05 was considered statistically significant.
Results
Characteristics of patients included in the single-cell analysis cohort
In this study, we performed single-cell analysis on three advanced lung cancer patients with malignant pleural effusion (MPE). Their characteristics are summarized in . All had Stage IV adenocarcinomas.
Table 1. Characteristics of three patients with single-cell analysis.
Phenotypic and TCR clonal analyses of CD8+ T cells in MPE
The overall approach to identify tumor-specific CD8+ T cells and their cognate antigens is shown schematically in . We performed high-throughput CD8+ single-cell RNA sequencing (scRNA-seq) and single-cell TCR sequencing (scTCR-seq) to characterize the phenotype and clonality of MPE CD8+ T cells. A total of 4,983 CD8+ T cells (MPE Pt1, 2,041; MPE Pt2, 1,018; MPE Pt3, 1,924) were classified by the UMAP dimensionality reduction algorithm into 10 clusters based on the expression of T cell-related genes (). These clusters were consistent with the T cell subsets designated C1-LEF1, C2-IL-7 R, C3-RPL13, C4-CX3CR1, C5-PDCD1, C5-ZNF683, C7-MKI67, C8-LMNA, C9-IFIT2, and C10-S100A9. The numbers of CD8+ T cells in these 10 clusters were highest in C5, C2, and C4 in MPE Pt1, MPE Pt2, and MPE Pt3, respectively (). Using hierarchical cluster analysis, we found that C5 exhibited a gene expression pattern similar to the Tex cluster in lung TILs of our previous study,Citation18 namely, the T cell exhaustion-related genes PDCD1 (PD-1), CTLA4, ENTPD1 (CD39), ITGAE (CD103) and CXCL13Citation15 ( and Supplementary Figure S1). Pseudo-time trajectory analysis showed that the differentiation of CD8+ T cells followed a characteristic trajectory from naive T cells to exhausted T cells ().
Figure 1. Phenotypic and TCR clonal analyses of CD8+ T cells from MPE.
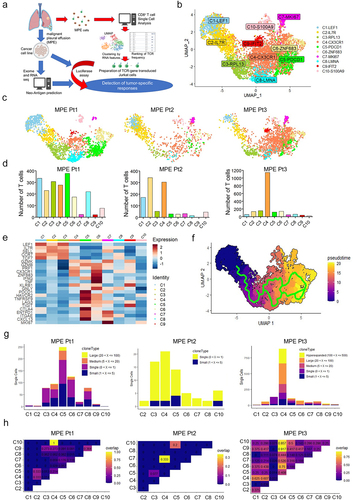
In single-cell TCR sequence analysis, high numbers of TCRs with oligoclonality were observed in clusters C5 and C4 in MPE Pt1 and MPE Pt3, respectively, but not in MPE Pt2 ( and Supplementary Table S2–4). The TCRs in C5 in MPE Pt1 overlapped with those in C2 and C4 clusters ( and Supplementary Table S2). The TCRs in C4 in MPE Pt3 overlapped greatly with those in other clusters, due to the presence of one highly clonal TCR (TCRB CDR3: CASGSLAGGPMYEQYF, n = 283) in C4 overlapping with other clusters’ TCRs including exhausted clusters ( and Supplementary Table S4).
Identification of tumor antigens recognized by CD8+ T cells
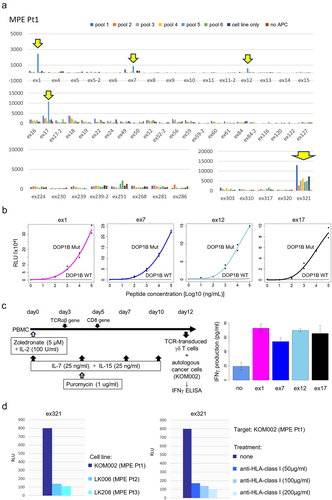
To investigate tumor-specific CD8+ T cell populations, we focused on exhausted clusters according to our previous study.Citation18 For this, we selected TCR clonotypes represented at least twice in descending order of frequency in the cluster C5, but also even TCR clonotypes represented only once but overlapping with other clusters’ TCRs in MPE Pt1. This resulted in the evaluation of a total of 54 TCR clonotypes (Suplementary Table S2). To test for recognition of the target antigens, we synthesized 56 potential neoantigen peptides predicted from the somatic missense mutations, insertion/deletion and fusion gene variations (Supplementary Table S5). Fifty-four TCR TAP fragment/luciferase-transduced CD8-J2 (TCR TAP/luc-CD8-J2) cells were then cocultured with autologous B-APC or the autologous cancer cell-line KOM002 pulsed with 11 pooled peptides (5–6 peptides/pool) (). After several rounds of stimulation, we identified four different Tex-TCRs (ex1, ex7, e×12 and ex17) recognizing the same pooled peptides (pool 5). We also found that the e×321TCR recognized the KOM002 cell line itself (). Subsequent analyses showed that four different Tex-TCRs (ex1, ex7, e×12 and ex17) were specific for the same neoantigen DOP1B pH1997N. These TCRs did not recognize the DOP1B wild-type counterpart peptide (). Furthermore, we also confirmed that the TCR-transduced γδ T cells recognized the autologous cell-line KOM002 and produced IFNγ (), suggesting that the four different TCRs recognized mutant DOP1B pH1997N peptide naturally processed in the cancer cells. The e×321TCR also recognized the autologous KOM002 cell line, but not other cell lines (LK006 and LK208), in an HLA-class I restricted manner ().
Figure 2. Identification of tumor antigens recognized by CD8+ T cells.
In the analyses for patients 2 and 3, we performed the same screening as for MPE Pt1 (Supplementary Figure S2). For MPE Pt2, we tested the reactivity of 30 TCR clonotypes (Supplementary Table S3) to 47 neoantigen epitopes (Supplementary Table S6) and for MPE Pt3, the reactivity of 47 TCR clonotypes including highly clonal TCR in C4 (Supplementary Table S4) to 38 neoantigen epitopes (Supplementary Table S7). However, we failed to detect any specific responses.
Collectively, these data demonstrate that four different TCR clonotypes specific for neoantigens, and one orphan TCR specific for the autologous cancer cell line, were identified from one of three patients (Supplementary Table S8).
Gene expression analysis of tumor-specific CD8+ T cells from MPE
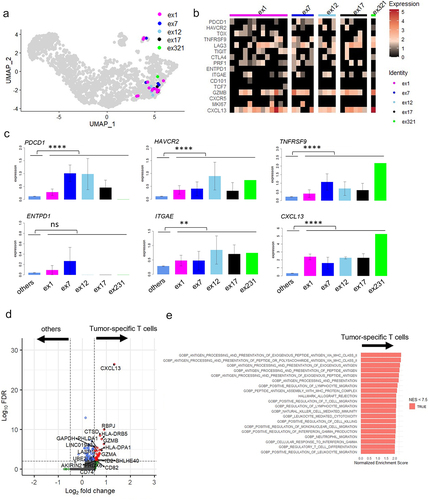
All identified TCR clones (n = 29) from five different clonotypes from MPE Pt1 were projected onto UMAPs (). We analyzed the gene expression of tumor-specific T cells with each of these TCR (). As expected, genes in the C5 cluster, PDCD1, HAVCR2, TNFRSF9, ITGAE and CXCL13 were more highly expressed in tumor-specific T cells than in the other T cells (). Expression of ENTPD1 (CD39), which was identified as a tumor-specific marker in lung cancer patients in previous studies,Citation18,Citation26 was not differentially expressed. We also performed differential expression (DE) analysis in tumor-specific T cells compared to the other T cells, finding that CXCL13 was exclusively expressed in the former (p < 3.81E–27, avg_log2FC = 1.33) (). Gene Set Enrichment Analysis (GSEA) using MSigDB v2022.1.HS revealed that gene sets related to HLA class II antigen processing were enriched in the tumor-specific T cells. This suggests T cell activation was induced in the tumor-specific MPE T cells ( and Supplementary Table S9).
Figure 3. Gene expression analysis of tumor-specific CD8+ T cells from MPE.
Comparison of biomarkers for tumor-specific CD8+ T cells in MPE and TIL
To further characterize tumor-specific T cells in MPE, we compared their gene expression with that of TILs from our previous study.Citation18 We combined single-cell data from three surgically resected tumors (Stage I-III) to the current data from 3 MPE and again performed dimensional reduction using UMAP ( and Supplemental Figure S3A). The tumor-specific TCRs identified in MPE (left) and TILs (right) were mostly localized in the newly-created cluster C6-PDCD1 ( and Supplementary Figure S3b). The expression of representative genes in this cluster was compared in six patients. Overall, the expression of these genes was lower in MPE than in TILs. The gene expression pattern in MPE Pt1, but not MPE Pt2 or MPE Pt3, appeared similar to that in the TILs from three patients (). Some of these gene expressions were confirmed by flow cytometry (Supplementary Figure S4). For tumor-specific T cells, the expression of PDCD1, ENTPD1, and ITGAE was significantly lower in MPE than in TILs. On the other hand, HAVCR2, TNFRSF9 and CXCL13 expressions were not different between them (). Taken together, these data suggest that the phenotype of antigen-specific T cells in MPE and TILs was similar, except for the lower level of expression of certain genes such as ENTPD1 in MPE.
Figure 4. Comparison of tumor specific CD8+ T cells between MPE and TILs.
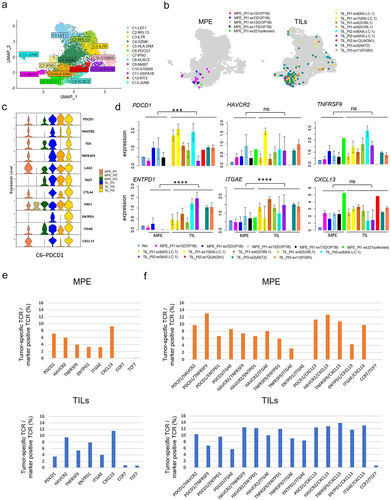
To identify markers characterizing tumor-specific T cells in MPE, we calculated the percentage of such cells within the CD8+ T cell population expressing a single marker gene (RNA expression, >0.5) (Supplementary Figure S5) or combination of marker genes (RNA expression of both > 0.5) (Supplementary Figure S6), compared to TILs. When limited to a single T cell marker, the frequency of tumor-specific T cells was highest in the CXCL13+ population (25/271, 9.2%) ( upper). The same trend was observed in TILs ( lower). However, the frequency was much higher in PDCD1/TNFRSF9 double-positive T cells (6/46, 13.04%) among any combinations, even with CXCL13 ( upper). In TILs, the frequency tended to be higher in HAVCR2/TNFRSF9 double-positive T cells, or in combination with CXCL13, than in PDCD1/TNFRSF9 double-positives ( lower). These data suggest that co-expression of PDCD1 and TNFRSF9 may mark tumor-specific T cells in MPE but not in TILs.
Tumor-specific CD8+ T cell subsets in MPE are associated with patients’ prognosis
We next quantified tumor-specific T cells in 69 patients including MPE Pt1, MPE Pt2 and MPE Pt3 by flow cytometry and investigated their association with clinical outcome. The clinicopathological characteristics of all patients are summarized in . MPE T cells were stained for the cell surface markers CD8, PD-1, TIM3, 4-1BB, CD39 and CD103 in all patients and for intracellular CXCL13 in 35. The frequencies of PD-1+4-1BB+ cells and CXCL13+ cells within the CD8+ T cell subset ranged from 0% to 27.8% and from 0.034% to 4.76%, respectively (). As expected, the frequency of positive cells in MPE Pt1 was higher than in MPE Pt2 or MPE Pt3.
Figure 5. Associations of tumor specific CD8+ T cell fractions in MPE with patients’ prognosis.
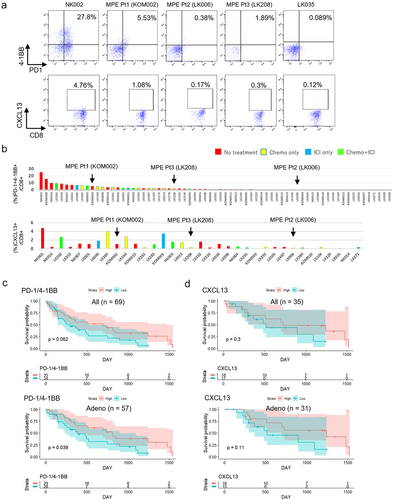
Table 2. Characteristics of patients with flow cytometric analysis.
Finally, we examined whether the frequencies of tumor-specific T cells in MPE had any impact on prognosis. We divided patients (n = 69) into two groups by median values of marker expression. Patients with high PD-1/4-1BB expression had no better prognosis than those with low expression (p = .062) ( upper). However, in a subgroup analysis focusing on adenocarcinoma patients only (n = 57), the association achieved statistical significance (p = .039) ( lower). The same analysis using other combinations of markers (TIM3/4-1BB or CD39/CD103), which tended to be higher in TILs, revealed no differences between groups with high and low expression either in the whole cohort or in the 57 patients with adenocarcinoma (Supplementary Figure S7). Patients with high CXCL13 expression had no better prognosis either in all lung cancer patients or in the 57 patients with adenocarcinoma (), similar to other single markers such as PD-1, TIM3, 4-1BB, CD39, or CD103 (n = 69 or n=57) (Supplementary Figure S8). Collectively, these data suggest that the presence of tumor-specific MPE T cells expressing surface PD-1/4-1BB may be associated with a better prognosis of advanced lung cancer.
Discussion
Here, we employed single-cell sequencing to phenotype T cells from the MPE of advanced lung cancer patients. To identify CD8+ T cells recognizing tumor antigens, we selected patients from whom cancer cell lines could be established from the MPE. This allowed us to predict mutation-derived cancer neoantigens. We found that CD8+ T cells with an exhausted phenotype, similar to but in some respects different from TILs, recognized certain neoantigens, or the autologous cancer cell line.
Advanced lung cancer metastasizing to the pleural space results in malignant MPE that harbors not only tumor cells but many immune cells including diverse lymphoid and myeloid subsets.Citation27 Flow cytometric phenotyping of CD8+ T cells in MPE revealed that the frequency of effector memory (Tem, CCR7(-) CD45RA(-)) and central memory (Tcm, CCR7(+) CD45RA(-)) subsets expressing higher levels of PD-1 and CD39 was increased in advanced NSCLC.Citation28 In addition, Tem and Tcm cells from MPE produced greater amounts of cytokines than terminally differentiated effector memory cells (TemRA, CCR7(-) CD45RA(+)) and naïve T cells (Tnaive, CCR7(+) CD45RA(+)),Citation28 although the assay was not focused on tumor-specific T cells in that study. On the other hand, pleural effusion CD8+ T cells that responded to the tumor antigens MAGE-A3 and WT-1 (identified as CD137+ (4-1BB+) cells) expressed higher levels of PD-1, but not TIM3,Citation29 suggesting that tumor antigen-specific MPE T cells are not completely exhausted. However, more precise phenotyping and T-cell clonality investigations of CD8+ T cells recognizing tumor cells or tumor antigens in lung cancer MPE had not been performed in these earlier studies.
The advent of single-cell analysis integrating gene expression and TCR sequencing has allowed tumor-specific CD8+ TIL phenotypes in solid cancers to be profiled at high resolution.Citation15,Citation17 Tumor antigens, including shared and unique antigens, are mostly recognized by CD8+ T cells with an exhausted phenotype (dysfunctional differentiated phenotypes) and rarely by those with memory properties.Citation15,Citation17 We also reported similar exhausted phenotypes of CD8+ TILs with high clonality recognizing tumor antigens in resected lung cancers.Citation18 Here, we applied single-cell analysis to CD8+ T cell populations from the MPE of three advanced lung cancer patients. It has been reported that particular TCRβ variable genes can be overexpressed in MPE T cells,Citation30 suggesting that some of them had undergone clonal expansion. Moreover, the TCR clonality and the number of expanded TCR clones was reported as greater in ICI responders than non-responders,Citation31 suggesting that these expanded T cells may contribute to anti-tumor immune responses re-activated by ICI. We also found expanded T cell clones in two patients (MPE Pt1 and Pt3). As we observed for TILs from our previous lung cancer cases, MPE Pt1 exhibited CD8+ T cells with relatively high clonality in MPE, residing in exhausted cluster C5. We were able to identify a tumor antigen recognized by the T cells in this cluster. In contrast, we found one highly expanded T cell clone present predominantly in the CX3CR1-containing cluster C4, but also present in other clusters, including the exhausted cluster, in MPE Pt3. However, we were unable to identify the tumor antigens recognized by these T cells, possibly due to the limited number of antigens in our survey, or due to these T cells not being tumor-specific [potentially virus-specific (e.g. CMV pp65) as previously reportedCitation29]. Nonetheless, we found five different TCR clonotypes in the exhausted T cell cluster in MPE Pt1 that did recognize neoantigens or the autologous cancer cell line. In this study, no tumor tissues were available from three MPE patients. It will be necessary to verify whether the findings from MPE are representative of the whole tumor response if both are obtained from the same patient in the future.
Recently, CD39/CD103 or CXCL13 expression has been suggested to mark tumor-specific T cells in several reports.Citation13,Citation14,Citation26 However, ENTPD1 (CD39) was not highly expressed in tumor-specific MPE T cells in our patients. It might be due to the limited number of tumor-specific T cells against limited antigens. On the other hand, CXCL13 was exclusively expressed in tumor-specific MPE T cells, suggesting that it may represent such a marker in MPE as well as in TILs. Additionally, we showed that PDCD1/TNFRSF9 co-expression is a candidate marker for tumor-specific T cells in MPE but not in TILs. The frequency of tumor-specific T cells in PDCD1(PD-1)/HAVCR2(TIM3) in MPE was not higher than in TILs, consistent with a previous report.Citation29 Using these putative markers of tumor-specific T cells, we documented that patients with high PD-1/4-1BB tended to have a better prognosis, which became statistically significant in the subset of adenocarcinoma patients. These findings suggest that the presence of tumor-specific T cells and their responses against cancer cells in MPE may contribute to longer patients’ survival despite the highly immune-suppressive MPE environment.Citation32 These results imply that a strategy utilizing antigen-specific T cells from MPE may be feasible in advanced lung cancer patients.
A recent clinical trial described the use of T cells derived from MPE and malignant ascites in combination with cisplatin [10]. Infusion of effusion-derived T cells was associated with longer progression-free survival and better quality of life than cisplatin alone. However, expansion of T cells recognizing tumor antigens might be compromised due to the exhausted phenotype of such cells, as documented in the present study. Nonetheless, approaches using MPE-derived T cells may have several advantages over TILs derived from surgical resections or biopsies of solid cancers. Because MPE is easily obtained in the clinic, the number of T-cells that could be isolated is much higher than from surgically resected or biopsy-derived samples. Moreover, TILs derived from solid tumors display spatial heterogeneity, resulting in potential differences in function and specificity depending on the location resected. This heterogeneity would not be expected in MPE. It is also the case that recurrent MPE is common, providing an opportunity for longitudinal analysis of the tumor site in a clinical setting. Therefore, identification and isolation of tumor-specific T cells from MPE may facilitate the development of promising approaches such as TCR-transduced adoptive cellular immunotherapy, as well as assisting in establishing appropriate monitoring for immunotherapy efficacy.
There are several limitations to the present study. We analyzed only 3 MPE derived from advanced lung cancer patients with different treatment backgrounds. Moreover, since 2 of the 3 patients in this study harbor EGFR mutation-positive lung adenocarcinoma, the findings in this study might not be generalized to other patients with NSCLC with other driver mutations. Given that we could not identify tumor antigens from highly clonal T cells in MPE Pt3, broader landscapes of tumor antigensCitation33,Citation34 need to be examined. The limited numbers of patients, limited clusters of T cells, and limited types of tumor antigens analyzed in this study may have resulted in biased data for the characterization and markers of tumor-specific T cells. Despite these limitations, we demonstrated that candidate tumor-specific T cell subsets present in MPE may be different from those in TILs. Further investigations will be required to validate these findings.
Author contributions
Conceptualization: Y. Sugita, D. Muraoka, K. Onoguchi, Y. Yamashita, H. Matsushita; Data curation: Y. Sugita, R. Nishida, C. Takashima; Formal analysis: Y. Sugita, H. Komuro, R. Yamaguchi; Investigation: Y. Sugita, A. Demachi-Okamura, K. Masago, E. Sasaki, Y. Fukushima, T. Matsui, S. Shinohara, Y. Takahashi; Resources: T. Yamaguchi, Y. Horio, K. Hashimoto, I. Tanaka, H. Kuroda; Methodology: H. Hamana, H. Kishi, D. Miura, Y. Tanaka, K. Onoue, K. Onoguchi, Y. Yamashita, R. Stratford, T. Clancy; Supervision: H. Kishi, Y. Yamashita, H. Ishibashi, K. Okubu, H. Matsushita; Writing-original draft: Y. Sugita, H. Matsushita; All authors reviewed the manuscript.
Supplementary figure.pdf
Download PDF (1.7 MB)Supplementary table.xlsx
Download MS Excel (74.9 KB)Acknowledgments
We are grateful to all the patients who participated in this study. We acknowledge the excellent technical assistance of Seiko Shibata, Yoshiko Suzuki, Naoko Takeda and Masami Iwano for the preparation of tumor tissue specimens or plasmid constructs, and Yasuko Fujihara and Yuki Abe for assisting with the analysis of patient information. The super-computing resource was provided by Human Genome Center, the Institute of Medical Science, the University of Tokyo.
Disclosure statement
This study was partly funded by NEC Corporation.
Data availability statement
Data are available upon reasonable request.
Supplementary material
Supplemental data for this article can be accessed online at https://doi.org/10.1080/2162402X.2024.2371556.
Additional information
Funding
References
- Barta JA, Powell CA, Wisnivesky JP. Global epidemiology of lung cancer. Ann Glob Health. 2019;85(1). doi:10.5334/aogh.2419.
- Thai AA, Solomon BJ, Sequist LV, Gainor JF, Heist RS. Lung cancer. Lancet. 2021;398(10299):535–14. doi:10.1016/S0140-6736(21)00312-3.
- Doroshow DB, Sanmamed MF, Hastings K, Politi K, Rimm DL, Chen L, Melero I, Schalper KA, Herbst RS. Immunotherapy in non–small cell lung cancer: facts and hopes. Clin Cancer Res. 2019;25(15):4592–4602. doi:10.1158/1078-0432.CCR-18-1538.
- Borghaei H, Paz-Ares L, Horn L, Spigel DR, Steins M, Ready NE, Chow LQ, Vokes EE, Felip E, Holgado E. et al. Nivolumab versus docetaxel in advanced nonsquamous non–small-cell lung cancer. N Engl J Med. 2015;373(17):1627–1639. doi:10.1056/NEJMoa1507643.
- Brahmer J, Reckamp KL, Baas P, Crino L, Eberhardt WE, Poddubskaya E, Antonia S, Pluzanski A, Vokes EE, Holgado E. et al. Nivolumab versus docetaxel in advanced squamous-cell non–small-cell lung cancer. N Engl J Med. 2015;373(2):123–135. doi:10.1056/NEJMoa1504627.
- Herbst RS, Baas P, Kim DW, Felip E, Perez-Gracia JL, Han JY, Molina J, Kim J-H, Arvis CD, Ahn M-J. et al. Pembrolizumab versus docetaxel for previously treated, PD-L1-positive, advanced non-small-cell lung cancer (KEYNOTE-010): a randomised controlled trial. Lancet. 2016;387(10027):1540–1550. doi:10.1016/S0140-6736(15)01281-7.
- Chu H, Du F, Gong Z, Lian P, Wang Z, Li P, Hu B, Chi C, Chen J. Better clinical efficiency of TILs for malignant pleural effusion and ascites than cisplatin through intrapleural and intraperitoneal infusion. Anticancer Res. 2017;37(8):4587–4591. doi:10.21873/anticanres.11857.
- Adusumilli PS, Zauderer MG, Riviere I, Solomon SB, Rusch VW, O’Cearbhaill RE, Zhu A, Cheema W, Chintala NK, Halton E. et al. A phase I trial of regional mesothelin-targeted CAR T-cell therapy in patients with malignant pleural disease, in combination with the anti–PD-1 agent pembrolizumab. Cancer Discov. 2021;11(11):2748–2763. doi:10.1158/2159-8290.CD-21-0407.
- Matsushita H, Vesely MD, Koboldt DC, Rickert CG, Uppaluri R, Magrini VJ, Arthur CD, White JM, Chen Y-S, Shea LK. et al. Cancer exome analysis reveals a T-cell-dependent mechanism of cancer immunoediting. Nature. 2012;482(7385):400–404. doi:10.1038/nature10755.
- Schumacher TN, Schreiber RD. Neoantigens in cancer immunotherapy. Science. 2015;348(6230):69–74. doi:10.1126/science.aaa4971.
- Rosenberg SA, Restifo NP. Adoptive cell transfer as personalized immunotherapy for human cancer. Science. 2015;348(6230):62–68. doi:10.1126/science.aaa4967.
- Lu YC, Zheng Z, Lowery FJ, Gartner JJ, Prickett TD, Robbins PF, Rosenberg SA. Direct identification of neoantigen-specific TCRs from tumor specimens by high-throughput single-cell sequencing. J Immunother Cancer. 2021;9(7):e002595. doi:10.1136/jitc-2021-002595.
- Simoni Y, Becht E, Fehlings M, Loh CY, Koo SL, Teng KWW, Yeong JPS, Nahar R, Zhang T, Kared H. et al. Bystander CD8(+) T cells are abundant and phenotypically distinct in human tumour infiltrates. Nature. 2018;557(7706):575–579. doi:10.1038/s41586-018-0130-2.
- Duhen T, Duhen R, Montler R, Moses J, Moudgil T, de Miranda NF, Goodall CP, Blair TC, Fox BA, McDermott JE. et al. Co-expression of CD39 and CD103 identifies tumor-reactive CD8 T cells in human solid tumors. Nat Commun. 2018;9(1):2724. doi:10.1038/s41467-018-05072-0.
- Oliveira G, Stromhaug K, Klaeger S, Kula T, Frederick DT, Le PM, Forman J, Huang T, Li S, Zhang W. et al. Phenotype, specificity and avidity of antitumour CD8(+) T cells in melanoma. Nature. 2021;596(7870):119–125. doi:10.1038/s41586-021-03704-y.
- Caushi JX, Zhang J, Ji Z, Vaghasia A, Zhang B, Hsiue EH, Mog BJ, Hou W, Justesen S, Blosser R. et al. Transcriptional programs of neoantigen-specific TIL in anti-PD-1-treated lung cancers. Nature. 2021;596(7870):126–132. doi:10.1038/s41586-021-03752-4.
- Lowery FJ, Krishna S, Yossef R, Parikh NB, Chatani PD, Zacharakis N, Parkhurst MR, Levin N, Sindiri S, Sachs A. et al. Molecular signatures of antitumor neoantigen-reactive T cells from metastatic human cancers. Science. 2022;375(6583):877–884. doi:10.1126/science.abl5447.
- Komuro H, Shinohara S, Fukushima Y, Demachi-Okamura A, Muraoka D, Masago K, Matsui T, Sugita Y, Takahashi Y, Nishida R. et al. Single-cell sequencing on CD8 + TILs revealed the nature of exhausted T cells recognizing neoantigen and cancer/testis antigen in non-small cell lung cancer. J Immunother Cancer. 2023;11(8):e007180. doi:10.1136/jitc-2023-007180.
- Shinohara S, Takahashi Y, Komuro H, Matsui T, Sugita Y, Demachi-Okamura A, Muraoka D, Takahara H, Nakada T, Sakakura N. et al. New evaluation of the tumor immune microenvironment of non-small cell lung cancer and its association with prognosis. J Immunother Cancer. 2022;10(4):e003765. doi:10.1136/jitc-2021-003765.
- Shiraishi Y, Sato Y, Chiba K, Okuno Y, Nagata Y, Yoshida K, Shiba N, Hayashi Y, Kume H, Homma Y. et al. An empirical Bayesian framework for somatic mutation detection from cancer genome sequencing data. Nucleic Acids Res. 2013;41(7):e89. doi:10.1093/nar/gkt126.
- Evans E. Salmon. Midwives Chron. 1972;86(11):118–119.
- Schultze JL, Cardoso AA, Freeman GJ, Seamon MJ, Daley J, Pinkus GS, Gribben JG, Nadler LM. Follicular lymphomas can be induced to present alloantigen efficiently: a conceptual model to improve their tumor immunogenicity. Proc Natl Acad Sci USA. 1995;92(18):8200–8204. doi:10.1073/pnas.92.18.8200.
- Hamana H, Shitaoka K, Kishi H, Ozawa T, Muraguchi A. A novel, rapid and efficient method of cloning functional antigen-specific T-cell receptors from single human and mouse T-cells. Biochem Biophys Res Commun. 2016;474(4):709–714. doi:10.1016/j.bbrc.2016.05.015.
- Ohta R, Demachi-Okamura A, Akatsuka Y, Fujiwara H, Kuzushima K. Improving TCR affinity on 293T cells. J Immunol Methods. 2019;466:1–8. doi:10.1016/j.jim.2018.11.010.
- Kondo E, Topp MS, Kiem HP, Obata Y, Morishima Y, Kuzushima K, Tanimoto M, Harada M, Takahashi T, Akatsuka Y. et al. Efficient generation of antigen-specific cytotoxic T cells using retrovirally transduced CD40-activated B cells. J Immunol. 2002;169(4):2164–2171. doi:10.4049/jimmunol.169.4.2164.
- Hanada KI, Zhao C, Gil-Hoyos R, Gartner JJ, Chow-Parmer C, Lowery FJ, Krishna S, Prickett TD, Kivitz S, Parkhurst MR. et al. A phenotypic signature that identifies neoantigen-reactive T cells in fresh human lung cancers. Cancer Cell. 2022;40(5):479–93 e6. doi:10.1016/j.ccell.2022.03.012.
- Huang ZY, Shao MM, Zhang JC, Yi FS, Du J, Zhou Q, Wu F-Y, Li S, Li W, Huang X-Z. et al. Single-cell analysis of diverse immune phenotypes in malignant pleural effusion. Nat Commun. 2021;12(1):6690. doi:10.1038/s41467-021-27026-9.
- Zhang Y, Li W, Zhai J, Jin Y, Zhang L, Chen C. Phenotypic and functional characterizations of CD8(+) T cell populations in malignant pleural effusion. Exp Cell Res. 2022;417(1):113212. doi:10.1016/j.yexcr.2022.113212.
- Prado-Garcia H, Romero-Garcia S, Puerto-Aquino A, Rumbo-Nava U. The PD-L1/PD-1 pathway promotes dysfunction, but not “exhaustion”, in tumor-responding T cells from pleural effusions in lung cancer patients. Cancer Immunol Immunother. 2017;66(6):765–776. doi:10.1007/s00262-017-1979-x.
- Duncan SR, Elias DJ, Roglic M, Pekny KW, Theofilopoulos AN. T-cell receptor biases and clonal proliferations in blood and pleural effusions of patients with lung cancer. Hum Immunol. 1997;53(1):39–48. doi:10.1016/S0198-8859(96)00296-0.
- Zhang J, Ji Z, Caushi JX, El Asmar M, Anagnostou V, Cottrell TR, Chan HY, Suri P, Guo H, Merghoub T. et al. Compartmental analysis of T-cell clonal dynamics as a function of pathologic response to neoadjuvant PD-1 blockade in resectable non–small cell lung cancer. Clin Cancer Res. 2020;26(6):1327–1337. doi:10.1158/1078-0432.CCR-19-2931.
- Principe N, Kidman J, Lake RA, Lesterhuis WJ, Nowak AK, McDonnell AM, Chee J. Malignant pleural effusions—a window into local anti-tumor T cell immunity? Front Oncol. 2021;11:672747. doi:10.3389/fonc.2021.672747.
- Simpson AJ, Caballero OL, Jungbluth A, Chen YT, Old LJ. Cancer/testis antigens, gametogenesis and cancer. Nat Rev Cancer. 2005;5(8):615–625. doi:10.1038/nrc1669.
- Kalaora S, Nagler A, Nejman D, Alon M, Barbolin C, Barnea E, Ketelaars SLC, Cheng K, Vervier K, Shental N. et al. Identification of bacteria-derived HLA-bound peptides in melanoma. Nature. 2021;592(7852):138–143. doi:10.1038/s41586-021-03368-8.