
 ?Mathematical formulae have been encoded as MathML and are displayed in this HTML version using MathJax in order to improve their display. Uncheck the box to turn MathJax off. This feature requires Javascript. Click on a formula to zoom.
ABSTRACT
Smart product design (SPD) is more complex than traditional product design (TPD), requiring intense interdisciplinary collaboration. It is well understood that prototypes are an effective means to facilitate communicating design concepts. However, there is limited research concerning prototyping preferences of design disciplines involved in SPD. The research explores the use of prototyping in smart product development. Specifically, it aims to understand the preferences and dimensions of fidelity of different prototyping tools that can support communication in the SPD process for various stakeholders. This paper presents two surveys. The first investigates the use of prototyping tools by different disciplines involved in SPD versus TPD. The second compares elements of key prototyping tools used across disciplines within SPD. Results show that the interactivity and environment dimensions of fidelity of prototyping tools motivate differences in preference between SPD and TPD. Moreover, user depiction and contextual information are key elements of prototyping that support designers in communicating interactive and environmental qualities of SPD concepts.
1. Introduction
Smart products (SPs) are increasingly available on the market. Enabled by advances in computing technology, concepts like the internet of things (IoT) are driving a trend for consumer products to increasingly integrate software functions with their hardware functions. These, in turn, connect products to wider cyber-physical systems, such as Google Home or similar services. This increasing prevalence of SPs drives research interest in their continuing design and development (Alter, Citation2020; Feliciano Filho et al., Citation2017; Raff et al., Citation2020). There is a substantial breadth of products that can be described as ‘smart;’ our focus in this paper is SP within the consumer product category. We contend they are particularly challenging to design as user needs and desirability are important alongside technical requirements, thus a wide range of different stakeholder interests are relevant for the development. Likewise, a wide range of prototyping tools will be required to visualize and communicate all relevant aspects of the design.
Since the 1990s, when the concept of an SP first emerged, its defining characteristics have evolved along with the technology that enables its creation. An SP is often defined as ‘a physical product with embedded information technologies (IT), namely software programming and sensors’ (Dhebar, Citation1996). Advancing from this, according to Allmendinger and Lombreglia (Citation2005), a product uses built-in intelligence to become smart, employing both awareness and connectivity. In recent studies, the focus has also expanded to include the service function of SPs (Beverungen et al., Citation2019; Langley et al., Citation2021; Raff et al., Citation2020). The service focus is also reflected in its definition: Tomiyama et al. (Citation2019) defined the SP as Cyber-physical systems (CPS) integrating internet-based services, which means SPs are software-intensive, data-driven, and feature service integration. Raff et al. (Citation2020) have asserted that an SP is a cyber-physical device with distinct material nature and software-based digital capabilities. With the advent of more complex software-based functionality, SPs are equally becoming increasingly complex.
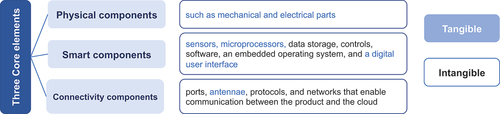
To proceed, we offer the following definition/framing of SP based on pertinent characteristic elements (illustrated in ). We find three core elements: physical components, smart components, and connectivity components (Li et al., Citation2019; Porter & Heppelmann, Citation2015). As illustrated in , this results in a product comprised of both tangible (blue text) and intangible components (black text). The characteristics of tangible components of SPs may help other intangible components (such as services and systems) to establish connections to other devices (Scharfenberger et al., Citation2014).
Figure 1. Three core elements of the SP adapted from (Porter & Heppelmann, Citation2015).
The complexity of SP in terms of tangible and intangible components along with more complex functionality, means they require a fundamental rethinking of the way they are created (Porter & Heppelmann, Citation2015), as product development shifts from physical, technical design tasks to genuinely interdisciplinary tasks at all levels. Raff et al. (Citation2020) suggest that SPs’ tangible and intangible properties may require differently structured development processes, ideally involving parallel development of tangible and intangible elements (Tomiyama et al., Citation2019). As such, the SPD process presents new challenges in terms of managing the design of a more multifaceted product involving communication between a broader range of stakeholders.
The SP is an outcome of an integration process over multiple disciplines: on the one hand, interdisciplinary cooperation and communication greatly improve product functionality (ElMaraghy et al., Citation2012; Tomiyama et al., Citation2007); on the other hand, the design of SPs is becoming increasingly challenging (Berger et al., Citation2019), and it increases the complexity of the design process (Tomiyama et al., Citation2019). As SPD is inherently interdisciplinary by nature, the clear communication of design goals among stakeholders in SPD poses a challenging task because the multiple components may complicate the visualization of the SP and the depiction of connections and relations between its components (Valencia Cardona et al., Citation2014). For instance, intangible components such as services, the information described through the service may vary considerably across different usage contexts, complicating the overall visualization. Camburn et al. (Citation2017) explained that true collaboration is more than distributing tasks across a skilled team, as it also involves rich multi-modal communication and co-development. However, communication barriers between members of multiple disciplines, such as jargon (Kleinsmann & Valkenburg, Citation2008). That is, the types of information intended to explain and communicate the designer’s representation differ according to their professional backgrounds; this can lead to misunderstandings that can provoke costly redesign cycles (Self, Citation2019). Just as in the design of traditional products, prototyping is essential in SPD (Nunes et al., Citation2017). Prototypes can support the communication between disciplines (Lauff et al., Citation2020) by serving as so-called ‘boundary objects’ (Carlile, Citation2002) that transform knowledge, improving the exchange of ideas about concepts, interrelation, and functions in early design stages. These benefits contributes to supporting the wider range of stakeholders involved in SPD in their communication. This paper addresses the broad interdisciplinary communication between different disciplines such as design and engineering, as well communication between different disciplines within the broader design discipline. Communication is related to discourse, engagement, and collaboration between different individuals, which is known to facilitate creative thought and ideation, which can lead to innovative ideas and integrations (Jordan & Babrow, Citation2013). Our work focuses on this area of communication and its role in fostering creativity and innovation.
The specific lens/point of interest with which this paper explores these challenges is prototyping. It is well established in the design research literature that the effective use of prototypes offers numerous benefits within the design process (Lauff et al., Citation2020). They provide a valuable means of communicating designs, which can be used for evaluating ideas (Self, Citation2019), convincing the team about the functionality of an idea, as well as function as a medium for the integration of multiple ideas into a final concept (Lauff et al., Citation2020). Prototypes enable such communication by facilitating the creation of a shared mental model between designers, thus reducing the cognitive burden during an abstract, verbal conversation (Lauff et al., Citation2018). Beyond design teams, prototypes facilitate the engagement of designers and other stakeholders in this process, such as within the organization’s communication (Bogers & Horst, Citation2014; Jensen et al., Citation2017; Lauff et al., Citation2020) and user testing (BenMahmoud‐Jouini & Midler, Citation2020). In short, prototyping is instrumental in new product development (NPD).
The research reported in this paper explores the use of prototyping in SP development. Specifically, it aims to understand the preferences and dimensions of fidelity of different prototyping tools that can support communication in the SP development process for various stakeholders. The paper proceeds with a review of the literature on different stakeholders’ preferences for using different prototypes, dimensions of fidelity of prototypes to be used as a framework within the study, and similarly a framing of using prototypes as a basis to communicate with stakeholders. SPD requires a wide range of stakeholders, and within that group, there is a wide range of design disciplines. The areas of study particularly pertinent to this paper include industrial design, UI/UX design, and product design, and these disciplines are highlighted by Rowland et al. (Citation2015). For the remainder of the paper, we use the terminology design disciplines to describe the range of designer stakeholders. The method adopted is explained in Section 2, and two consecutive studies are presented along with results in Sections 4 and 4. A discussion of the findings is given in Section 6, and conclusions are drawn in Section 7.
2. Literature review
2.1. Preferences for the use of prototypes by different design disciplines
Several articles discuss the different prototyping preferences between industrial designers and engineering designers; see, e.g., Pei et al. (Citation2011). Pei states that industrial designers typically use representations of appearance and usability and provide sketches and physical models according to aesthetic attributes. Engineering designers tend to prefer high-fidelity prototypes to test functional mechanisms, engineering principles and production issues and, at the same time, provide technical details for manufacturing based on performance, quality and cost. Engineering designers hence tend to use models that are able to illustrate questions/issues around the production of the design/product at hand. More recent arguments suggest the opposite result; for novice designers (e.g., students), engineering designers preferred low-fidelity prototypes, while industrial designers often used high-fidelity ones (Carfagni et al., Citation2020). This shows that the preference of the prototype by industrial designers and engineering designers for the fidelity is still fuzzy within the actual design process. Further different views to industrial designer and engineer, interaction design practitioners are inclined to appreciate and use frameworks that do not prescribe but support reflection and decision-making (design patterns, ways of using prototypes, styles of interaction, etc.) (Stolterman, Citation2008). Yu et al. (Citation2018) also find that the prototyping processes and activities of engineers and (industrial and interaction) designers are notably different in the early phase but become more similar in the middle and final phases of product development. Compared to engineers, designers were more receptive to the range of prototyping materials and tools, particularly low-fidelity prototypes, to explore the design space and find new opportunities. This also illustrates the diversity of tool preferences of different designer disciplines.
Rogers (Citation2004) reports on a study in which the success of theoretical approaches in practice is measured by how many practitioners know about the approaches that research has developed and to what extent they use them. This also shows that when a designer thinks that this prototyping tool is not easy to use, it may be because he has never used or rarely used it. The unfamiliarity with tools, such as storyboards and low-tech and software prototyping, increases the difficulty of communication (to explain concepts or collect feedback) between designers and their team members. The transition between physical and virtual domains often presents additional challenges (Kent et al., Citation2021; Liker & Pereira, Citation2018), such as having the associated skill and resource requirements for complex multi-domain prototyping, transition cost (time and money), and difficulty in determining the most appropriate domain to resolve product definition questions (Ulrich & Eppinger, Citation2011). As Tomiyama et al. (Citation2019) mentioned that SPs include many stakeholders (e.g., users, consumers, manufacturers, service providers), physical environment (enterprise, surrounding physical infrastructure), and linked product devices. SPs result from an integration process involving many disciplines. So, designers need to cooperate even more widely; designers from industrial, product, interaction and user experience design, plus design engineers who support/collaborate with these designers, are especially relevant disciplines in this paper. Prototype preference is still a challenge worth exploring in depth since the usage of prototyping tools in SPD is relatively understudied.
2.2. Fidelity of prototype
Several authors use fidelity as a lens to investigate prototypes (Bao et al., Citation2018; Fiorineschi & Rotini, Citation2019; Mathias et al., Citation2019; Ranscombe et al., Citation2020). Fidelity here is considered as a measurement of how close the prototype is to the final product (Hallgrimsson, Citation2012; Houde & Hill, Citation1997; M. C. Yang, Citation2004; Zink et al., Citation2017). High-fidelity and low-fidelity prototypes are most commonly distinguished based on their level of closeness to the final product (Virzi, Citation1989). It is worth noting that, as suggested by Mathias et al. (Citation2019), generally speaking, the higher the fidelity of the representation, the more skill and time required for its creation.
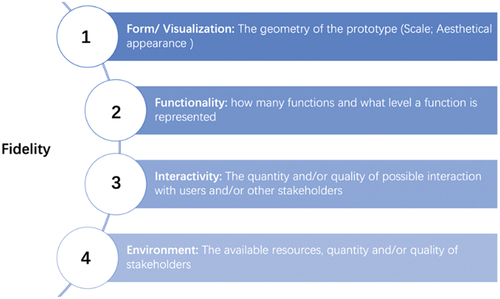
As an essential feature for prototypes, fidelity can be measured by four dimensions: degree of functionality, aesthetic refinement, the similarity of interaction, and breadth of features (McCurdy et al., Citation2006; Sauer et al., Citation2010). Fiorineschi and Rotini (Citation2019) expand these dimensions of prototype fidelity to include the relationship of data, prototyping technique, material (for physical prototypes), and performance to the functionality proposed in McCurdy et al. (Citation2006). Finally, the environment dimension was added by Fiorineschi and Rotini (Citation2019). Specifically, form/visualization and functionality are the most frequently mentioned dimensions in previous studies. Considering the characteristics of SPs, such as connectedness and smart human interaction (Tomiyama et al., Citation2019), UX and interaction design play a vital role in designing SPs, designers need to understand the user’s habits and reasons to create effective functions (Wu & Pillan, Citation2017), and producers need to prioritize UX and interaction design as key strategies (Pan & Wang, Citation2019). Q. Yang et al. (Citation2020) have identified that traditional human-centered design processes don’t always work well for autonomous, SPs that interact with humans, data, the environment and other smart objects, which is challenge for designers (Rodda et al., Citation2022). Therefore, environment and interactivity dimensions are important in SP prototyping, and they will be included in this study ().
The form/visualization dimension refers to the closeness with the final product in terms of scale, aesthetical appearance, tolerances, etc. Generally, this dimension covers all the attributes related to the geometry of the prototype.
The functionality dimension refers to the closeness with the final product in terms of the quantity of implemented functions;
The interactivity dimension is used to describe the closeness with the final product in terms of quantity and/or quality of possible interaction with users and/or other stakeholders;
The environment dimension describes the closeness of the prototyping environment with that expected for the final product in terms of available resources, quantity and/or quality of stakeholders (e.g., expertise of users).
Figure 2. The dimensions of fidelity adapted from (McCurdy et al., Citation2006) and (Fiorineschi & Rotini, Citation2019).
The prototyping tools are in both digital and physical domains (Goudswaard et al., Citation2021). They are digital or physical tools used to create and test early concepts or mockups of a product. demonstrates that SPs possess numerous characteristics and that different tools are available to support the prototyping of these various features. It is important to understand the characteristics of these tools and how they connect to the context of SPD.
Table 1. Typical prototyping tool characteristics with respect to the characteristics of SPs.
2.3. Communication with prototypes
According to Kleinsmann and Dong (Citation2007), a shared understanding among team members is essential for efficient communication. Furthermore, Kleinsmann and Valkenburg (Citation2008) also claimed that barriers and enablers that influence the creation of shared understanding influenced face-to-face communication and project management and project organization, showing the complexity of collaborative design. Expressive collaboration celebrates open exchange in which team members support each other, extending to clients, users, and other stakeholders. Lauff et al. (Citation2020) proposed three categories to define communication between stakeholders: internal/internal, internal/external, and external/external, and the explanation can be found as follows:
Internal/internal communication (inside the design team): Designers communicate design intentions to team members (other designers or engineers). King and Anderson (Citation1995) emphasized that compared to individuals, groups have more willingness to make risky decisions, which can be an advantage if innovation is being hindered by too much caution. Hart and Baker (Citation1994) noted that interdisciplinary teamwork is necessary for the success of a new product. Because the process of NPD involves several tasks and problems that need to be undertaken by different industries, the lack of professionals may lead to the neglect of important issues that affect the success of new products. Nevertheless, some specific terms (e.g., ‘iterate’ and ‘prototype’) also have different, already established meanings inside the team (Carlgren et al., Citation2016).
Internal/external communication (inside the company but outside the design team): Designers communicate design intentions to non-designers, including clients, users and stakeholders. The need for quality inputs to the process is another factor that affects success (Hart & Baker, Citation1994). Update and accurately grasp the technical and market information that need to be related to the immediate communication. People in different positions use different visual representations to express their views. When information cannot be directly translated into technical requirements, they cannot proceed to the next step due to their inconsistent understanding of information. Differences in communication styles can affect the process (Carlgren et al., Citation2016).
External/external communication (being outside the company but having some connection to the product (Jensen et al., Citation2017): the stakeholders that are outside the company, like sales representatives or users (Jensen et al., Citation2017).
In this paper, we focus on the communication within the design team (internal/internal communication). As stated above, a challenge in SP development stems from the interdisciplinarity required. We contend internal/internal represents the kind of communication which is more challenging being the communication between different types of designer using a greater range of prototyping tools. Some research on this topic has compared the roles of different occupations in the design process; for instance, Li et al. (Citation2019) discuss how engineers and data scientists collaborate to develop SPs. Similarly, Akoğlu and Er (Citation2015) explore the collaboration of interaction designers and industrial designers. Few studies have specifically addressed the internal/internal communication in prototyping SP. Thus, it is still unclear what the preferences for prototyping tools are for SPD among the range of design occupations and stakeholders involved.
2.4. Summary
Returning to the overall aim of this study, which is to understand more about prototyping in SPD, the above review offers some important insights. First subsection 1.1 explores recent literature on the breadth of prototyping tools used across various design disciplines. We found that there is still a need for a more detailed understanding of the preferences and needs of different disciplines, especially in SP prototyping. Subsection 1.2 explains fidelity as the lens with which the wide variety of tools used will be analyzed and compared. Subsection 1.3 highlights the importance of communication and frames the type of communication addressed in our study (internal/internal communication). With the dimension of fidelity outlined in , we will explore SP prototyping tools to communicate product concepts, identifying gaps between TP and SP prototyping for a more detailed understanding of the preferences and needs of different disciplines.
3. Methodology
The research reported in this paper adopts a mixed-methods approach combining quantitative and qualitative analysis. Mixed-method research allowing researchers to explore diverse perspectives and uncover relationships that exist between the SP prototyping tools and design disciplines. When prototyping SP, we require information on prototype-related conceptions and practices from various designers, since this study emphasizes the range of employing prototyping tools. The use of survey aligns the research with other scholars who also choose surveys (Deininger et al., Citation2017; E. Coutts & Pugsley, Citation2018; E. R. Coutts et al., Citation2019; Häggman et al., Citation2015; Isa et al., Citation2015) as their research method as an efficient way to ask many participants about the tools they use, their experiences and opinions. This study follows the same rationalization, aiming to understand experiences from a large sample.
There are two surveys in this study. They are conducted sequentially such that the second survey can build on the findings of the first survey. The questionnaire was accessed by participants mainly from Australia and China through Qualtrics. As our focus is on the Asia Pacific Region, rather than a single country, we acknowledge that there may be cultural differences among the respondents. All participants were identified with numbers instead of names to ensure anonymity. The goal of the first survey was broad, to understand any differences in the way designers of SPs approach prototyping compared with those who focus on designing traditional products. It represents a comparison study between the practices and preferences in relation to prototyping and communicating emerging design concepts of designers with experience in SP development versus the experiences and preferences of those with experience only in traditional product development. This first survey uses the dimensions of fidelity (we do use the same dimensions that were used in section 1.2: Form/Visualization, Functionality, Interactivity and Environment) adopted as the lens to compare the different prototyping tools. The research questions addressed in the first survey are:
RQ1: What difference can be observed between the preferences of SP designers and TP designers when using prototyping tools when collaborating with others from different disciplines in internal/internal communication?
RQ2: Which dimensions of fidelity motivate SP designers use of prototypes when communicating concepts during the early phase of SP development?
Having established key points of difference between TPD and SPD scenarios, the second survey exclusively investigates designers with SP experience to understand the preliminary insights gathered from the first survey at a deeper level. As such, the specific research questions formulated for the second survey (named RQ3 and RQ4) are given in section 6, following results from the first survey.
4. Survey 1
4.1. Survey 1 design
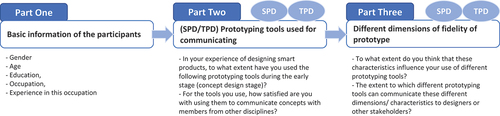
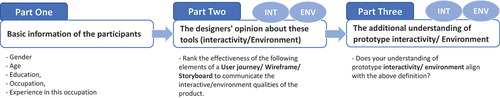
There is a mix of questions encompassing multiple choice, open ended and ranking by use of Likert scales. The questionnaire is divided into three parts (). The first part collects information about the participants, including age, gender, and occupation. It also asks participants to self-assess their experience in SPD versus TPD for categorizing them within the SP or TP group, respectively. The second part focuses on the frequency of using prototyping tools and satisfaction with them for communicating concepts (explain and understand concepts) with stakeholders from different disciplines. The purpose of this analysis is to explore the preferred practices of the SP group and TP group by analyzing the prototyping tools’ frequency of use and the participants’ satisfaction with these tools in communicating concepts within their respective teams or disciplines. And these common prototyping tools mentioned in the questionnaire are shown in . In the third part, participants are questioned on how the different dimensions of fidelity of prototypes help to communicate design concepts as they emerge.
Figure 3. The flow diagram of survey 1.
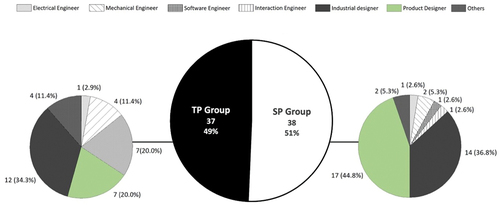
We acknowledge that the participants’ context may vary among individuals. Therefore, we made an effort to survey a wide range of different people in order to identify broader differences between the two groups (those with and those without experience in SPD). As stated, the first survey seeks insights from stakeholders in the product development process with and without experience in SP development. A total of 75 valid responses to the survey were collected. As shown in , 38 participants have experience in SPD, while others without SP design experience make up the TP group. Within those groups, we have designers from different design disciplines and engineers.
Figure 4. Occupation distribution in Survey 1.
59% of participants were male, and 41% were female. 92% of participants had a bachelor’s degree or above. All participants had at least one year of professional experience. 57% of the participants had design or engineering practical experience of more than five years, and 43% had less than five years. We contend that having participants with a mix of experience (i.e., not only very experienced designers) is important. While seniority is important, we also wanted to gather experiences of emerging designers, as often more-junior designers are the adopters of new tools and technology.
4.2. Data analysis
First, all completed questionnaires were screened and all quantitative answers were transferred into IBM SPSS for statistical analysis. Many of the questions in the questionnaire were of the Likert-scale type and were statistically analyzed for potential correlation. For the open-ended questions, the collected data was coded using inductive, thematic coding (Miles, Citation1994), the purpose of which was to explain or elaborate on findings from quantitative questions. Two researchers were jointly involved in the coding to reduce bias in the analyzing. The dimensions of fidelity of prototyping tools were used in data analysis as a guideline for mapping, interpreting, and presenting the data (the four dimensions listed in are codes).
The dimensions of fidelity of prototyping tool were used in data analysis as a guideline for mapping, interpreting, and presenting the data. To be specific, a coding scheme is given in , derived from relevant studies (Fiorineschi & Rotini, Citation2019; McCurdy et al., Citation2006) and adjusted for this particular study.
4.3. Survey 1 findings
4.3.1. Different patterns of using prototyping tools between SP and TP group
This section gives an overview of responses, aiming to understand the frequency with which tools are used and satisfaction, compared between SP and TP groups (RQ1). As such, it forms the basis for viewing overarching patterns/differences in the use of prototyping tools between the SP and TP groups (). We do not just want to understand frequency. Satisfaction with using tools to communicate is an interesting metric to identify where potential improvements could be made.
Table 2. Prototyping tools used for communicating concepts with members from other disciplines.
Concerning the frequency of use, the tools designers use with the highest proportion for the SP group are Hand sketches (32%), followed by CAD (31%). The tool with the lowest average frequency of use is LEGO (1.89), close to ‘sometimes used’, and the highest is CAD (3.83), which is used ‘most of the time’. For the TP group, tools used with the highest proportion are Hand sketches (36%), followed by CAD (35%). The majority of participants never use tools like VR (70%) and AR (64%). The tool with the lowest average frequency of use is VR (1.48), which is ‘sometimes’ used, and the highest is CAD (3.62), which indicates the Likert category used ‘most of the time’.
Concerning satisfaction with communication concepts with the various tools, designers were extremely satisfied with tools like CAD (57%) for the SP group, followed by LEGO (36%). They were extremely dissatisfied with tools like AR (5%). The tool with the lowest average satisfaction is Cardboard (3.25), and the highest is CAD (4.37). For the TP group, designers were extremely satisfied with tools like CAD (43%), followed by 3D printing (30%). The tool with the lowest average satisfaction is Wireframe (2.86)- close to ‘no change,’ and the highest is CAD (4.21).
The results of the Pearson correlation indicate that there was a significant positive association between the frequency of use and the satisfaction with the tool, r(13)= .792, p = .001 (SP group); r(13)= .556, p = .049 (TP group). Thus, this finding indicates that tools used more frequently are also the tools that the designers are more satisfied with. The larger the r-value, the stronger the correlation between the two variables, the correlation between frequency of tool use and satisfaction is stronger in the SP group than in the TP group. Therefore, a wider range of tools with higher frequency was employed in the SP group than in the TP group.
The following analysis investigates which tools are used with relatively high frequency but are deemed less satisfactory by SP designers. This is conducted to identify tools worthy of further research in the SP context as opportunities to better support prototyping. A four-quadrant chart was created where the X-axis and the Y-axis represent tool’s frequency of use and satisfaction with communicating concepts, respectively ().
Figure 5. Four-quadrant chart.
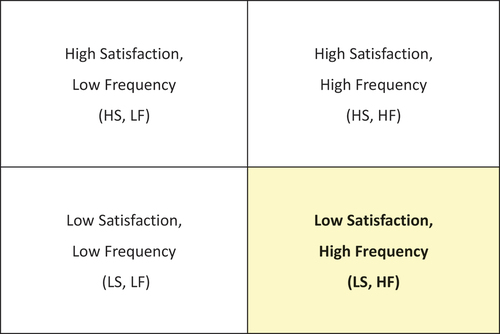
Figure 6. Four groups of four-quadrant chart.
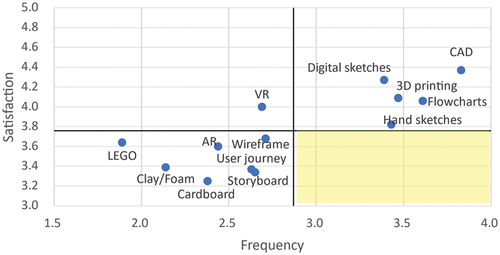
Special attention is paid to the yellow quadrant in , the X-axis represents the ranked frequency of tool usage by the participants, while the Y-axis represents the ranked satisfaction level of tool usage by the participants. Similarly, tools around the yellow quadrant (LS, HF) are also worth investigating. These are Wireframe, User journey, and Storyboard.
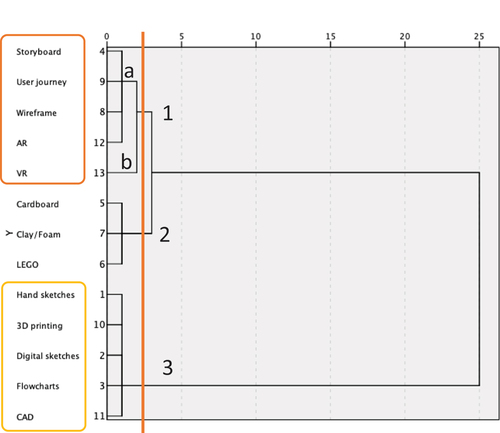
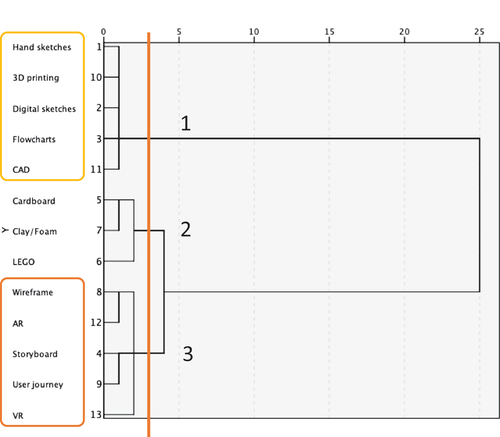
Cluster analysis is used to supplement the classification clustering tools on similarity in ratings for satisfaction and frequency of use, the X-axis is the distance between the clusters, and the Y-axis represents the tools, this time we specify three cluster solution. In this case, the cluster analysis is not used as a separate methodological approach but rather as a complementary method for validating trends suggested in . The clustering was performed based on the method of Ward (Citation1963). Results of the cluster analysis (shown in ) show that User journey, Wireframe and Storyboard are included in cluster 1a; this indicates low satisfaction but frequent use of these three tools.
Figure 7. Tree diagram for the thirteen tools (two variables: frequency and satisfaction).
4.3.2. The dimensions of fidelity of each prototyping tool to explain the use of tools
In this section, we further describe the tools mentioned in section 4.2.1 by analyzing the dimensions of the prototyping tools to understand how different dimensions of the tools might motivate designers’ choices to use them (RQ2).
The question related to asked participants about the connection between dimensions of fidelity and the user tools, this is presented as a multiple-choice question, and the scale is derived from the Likert scale used in questions, where five means stronger Influence while one means weaker Influence. The data from this part of the survey will help the answer of prototyping tool’s dimensions, i.e., dimension with strong influence indicates great support for communication of concepts.
Figure 8. The average of tool dimensions (To what extent that these dimensions of fidelity influence your use of different prototyping tools).
Figure 9. Tree diagram for these 13 tools (4 variables: frequency, satisfaction, interactivity, environment).
Overall, the importance of these four dimensions to prototyping tools falls into the ‘moderately strong Influence’ answer category when communicating concepts (their average number is almost 4, the meaning of Scale 4 in the questionnaire is: Moderately Strong Influence). The dimension with the greatest difference between groups is functionality. SP designers, it seems, pay more attention to the functionality of the prototype, and TP designers pay more attention to the form of the prototype. Moreover, the ratings of interactivity and environment dimensions of fidelity (in ) differ between the SP and TP groups. SP designers find these two dimensions have a stronger influence in using prototyping tools to communicate concepts. There are two possible reasons; firstly, the intangible aspects of SP are getting more complicated (Tomiyama et al., Citation2019), which influences the use of prototyping tools in SP design. Therefore, in this study, the interactivity environment dimensions are valuable in prototyping the intangible aspects of SP. Secondly, while interactivity and environment dimensions mentioned in the literature (Fiorineschi & Rotini, Citation2019) is relevant to SPD, there is still a lack of literature explaining how those dimensions of fidelity should be addressed. Therefore, we add the other two variables (interactivity and environment) in the hierarchical clustering to explore which prototyping tool is better for communicating them. For further confirmation, in , User journey, Wireframe, and Storyboard are also included in cluster 3; we will not discuss AR and VR for now as they are high-fidelity tools. In terms of these abilities, we already know frequency and satisfaction; they are related in terms of dimensions of fidelity.
In summary, Survey 1 offers a primary examination of how prototyping tools are used in SPD (RQ1). Data shows that interactivity and environment are the dimensions of fidelity that motivate SP designers to use prototypes when communicating concepts during the early phase of SP development (RQ2). Furthermore, we identify several prototyping tools (User journey, Wireframe and Storyboard) that highly scored in these two dimensions. Therefore, Survey 2 seeks to achieve a richer/detailed understanding of said tools scoring highly on the interactivity and environment dimensions of fidelity discussed above, and the patterns of use of these tools between different design disciplines in the SP design process.
5. Survey 2
Key findings from the first survey regarding the tools used and dimensions of fidelity are the basis for developing the second survey. Namely, dimensions of interactivity and environment are important for SP designers communicating concepts. And key tools of interest for further study are User journey, Wireframe and Storyboard. The second survey aims to explore these trends uncovered in the first survey in more detail. Specifically, it seeks to understand the patterns of using prototyping tools between different design disciplines involved in the SP design process and the elements and qualities of these tools that help communicate the various aspects of emergent designs. The specific research questions addressed through the second survey are:
RQ3: What are the patterns of use of the ‘key tools’ used across different design disciplines?
RQ4: Which elements of the above tools are most important to communicate the interactive/environmental qualities of the emergent design?
Survey 1 has few responses from UX/UI designers, and we note that prototyping tools such as User journey, Wireframe and Storyboard are regularly used in user experience (UX) design and interaction design. Hence it was important to include these design occupations in Survey 2. The differences between these tools and their respective elements are summarized in .
Table 3. The elements of the user journey, wireframe and storyboard.
5.1. Survey 2 design
This study follows the same structure as Survey 1. It is survey is divided into three parts as illustrated in . The first part gathers participant information. The second part is the designers’ views these three tools concerning the two dimensions of interactivity and environment. We divide each tool into different elements (‘Form’, ‘Function’, ‘Interactivity’ and ‘Environment’ as mentioned in ) to understand the degree of influence of various elements on the quality of communication; for example, Rank the effectiveness of the following elements of a user journey to communicate the interactive qualities of the product. In the third part, we explore the designer’s understanding of prototype interactivity and environment in the context of SP (Subsection 5.3.2).
Figure 10. The flow diagram of survey 2.
We have chosen a four category of designers from backgrounds such as industrial design, product design, UI/UX and interaction design, considering that the questions in this section are mainly related to the interactivity dimensions of SPs. A total of 458 questionnaires were distributed, and 115 complete questionnaires were returned. After a preliminary screening of the data to remove responses with missing information, containing logical errors and those from participants with less than three years of experience in SPD, the final number of valid questionnaires was 100, including 25 each for industrial designers, product designers, UI/UX designers and interaction designers. The age of the participants in this survey ranged from 23 to 43. The work experience ranged between 3 and 18 years. A bachelor’s degree and above accounted for 75% of the participants.
5.2. Survey 2 data analysis
The majority of questions in the questionnaire are the following: single choice, ranking and open-ended questions. The data will be richer to gain insight into the elements of the tools in survey 2 in the following three parts. Firstly, the ranking of the three tools will be explored to understand the application of the three tools in practice. We paid specific attention to whether participants used the three tools frequently or occasionally as a primary or secondary tool to understand how often the three tools were used in practice. Secondly, the analysis of two main types of ranking questions is included: Data analysis of the ranking of important elements to communicate interactivity and environment within each tool; Data analysis of the ranking of most helpful/suitable combinations. Thirdly, analysis of open-ended questions was carried out in NVivo 12. For instance, are there any other important elements in each tool that designers mention when communicating the quality of the interactivity/environment? And we sought to explore different design disciplines’ understanding of prototype interactivity and environment (mainly in contrast to the authors’ views).
5.3. Survey 2 findings
5.3.1. Ranking of key elements in the user journey, storyboard and wireframe to communicate interactive and environmental qualities
The first survey revealed as a key finding that interactivity and environment dimensions are important dimensions discussed in SPD. Cluster analysis on how different tools represent different dimensions of fidelity showed how SP designers view the three tools as useful in communicating interactive and environmental qualities. However, specific elements or qualities of tools that support communicating these dimensions are not entirely clear. This subsection will explain the different elements of these three tools in detail first, which form the basis of the Survey 2. The data from Survey 2 highlight the key elements of each tool to communicate these two qualities; the preference of different design disciplines will be used to answer RQ3 and RQ4.
Different patterns of using User journey, Storyboard and Wireframe between UI/UX designers, Interaction designers, Industrial designers and Product designers
The frequency of use of the three tools will be explored to understand how often the three tools were used in practice by different design disciplines ().
Figure 11. Frequency of using user journey, wireframe and storyboard in a different occupation.
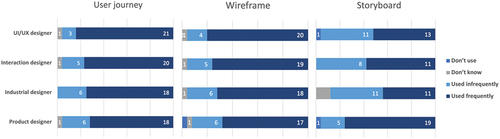
The use of User journey and Wireframe between occupations are almost the same, and it is only in Storyboard where there is significant difference (). After doing the One-Way ANOVA of each tool, only for Storyboard (), are the differences between means statistically significant (P = .028, F (3,96) = 3.176). The significant differences in using Storyboards exist between interaction designers and industrial designers (P = .013) and between industrial designers and product designers (P = .007) in .
Ranking of important elements of User journeys, Wireframes, and Storyboards to communicate interactive and environmental qualities in the
Table 4. Results of one-way ANOVA of the design discipline groups’ preference for user journeys.
Table 5. Results of one-way ANOVA of the design discipline groups’ preference for wireframes.
Table 6. Results of one-way ANOVA of the design discipline groups’ preference for storyboards.
Table 7. Result for four design discipline groups’ preference for storyboards, significant differences in bold.
This section provides the participant’s ranking of the constituent elements to communicate interactive and environmental qualities within each tool by different design disciplines. The data in are the average for each element. A ranking of 5 corresponds to ‘extremely important;’ a ranking of 1 corresponds to ‘not important.’
Figure 12. Elements of prototyping tools ranked by UI/UX designers according to their importance in communicating the interactivity (green) and environment (yellow) qualities of a design.
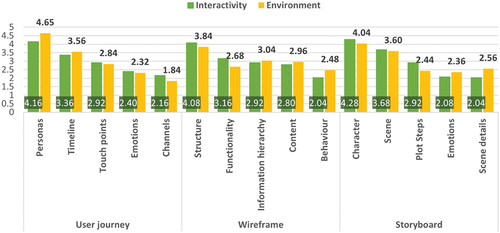
Figure 13. Elements of prototyping tools ranked by interaction designers according to their importance in communicating the interactivity (green) and environment (yellow) qualities of a design.
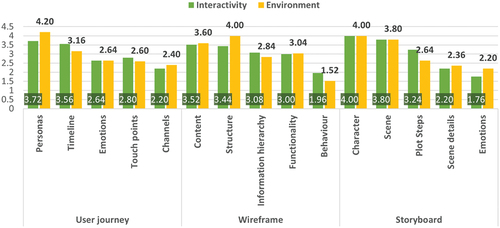
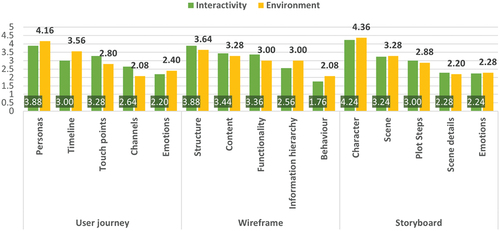
Figure 14. Elements of prototyping tools ranked by industrial designers according to their importance in communicating the interactivity (green) and environment (yellow) qualities of a design.
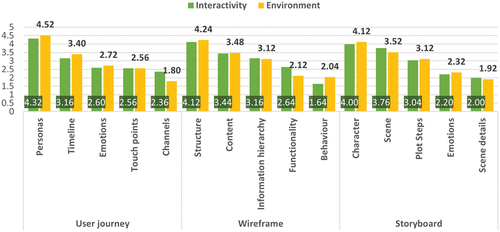
Figure 15. Elements of prototyping tools ranked by product designers according to their importance in communicating the interactivity (green) and environment (yellow) qualities of a design.
Comparisons of the perceptions of the same tools between different occupations is summarized in , where the text with an underline indicates the differences between the four design disciplines.
Table 8. The summary of key elements (ranking) in these tools.
The differences between the means are not statistically significant (One-Way ANOVA) in User journey () and Wireframe (). Data presented in are analyzed to identify similarities and differences between elements of tools from different occupations. For User journey, all designers agree that Personas and Timeline are the two most important key elements. UI/UX designers and Product designers respond that Touch points are more important than Emotions, but Interaction designers and Industrial designers have the opposite opinion. For Wireframe, all designers agree that Structure is the most key element. For Storyboard, all designers agree that Character and Scene are the two most key elements.
After analyzing designers’ frequency of using these three tools (User Journeys, Wireframes, and Storyboards), the findings indicate an overall trend of similar frequency of use across the four design disciplines. However, despite broad similarities, there are some nuances in the way disciplines employ these prototyping tools (discussed in the following sections).
5.3.2. The understanding of interactivity and environmental qualities across different occupations
In part three (), the final data collected was in the form of open-ended questions to understand RQ4 (Which elements of the above tools are most important to communicate the interactive/environmental qualities of the emergent design), which provided a deeper insight of the interactive and environmental qualities. This will be used to explore whether any different views on these dimensions explain or enrich the findings from earlier sections of Survey 2. We find the following insights: there are nuances in the discussion of interactive and environmental qualities between different disciplines of designers.
Equivalent to Survey 1, we conducted thematic, inductive coding in NVivo 12. Two researchers were jointly involved in the coding to reduce bias in the analyzing. The first step in coding would be to understand if they agree or not and/or what other factors they add. Then, if they add factors these can be coded (). The sub codes of Prototype related factors include Visualizing, Function, Hardware & System factor Community factor and Psychological factor. The first two of them are related to interactive qualities, and the others (blue words) are related to environmental qualities.
Table 9. Coding scheme.
In , the additional elements for interactive qualities are divided into three categories: user-related factors (24 citations), prototype-related factors (18 citations), and process-related factors (7 citations). The function (14 citations) and visualization (4 citations) are further divisions of prototype-related factors.
Table 10. The values represent the number of designers citing each code (interactive qualities).
Overall, about half of these additional elements are related to the user, and most of the four groups’ understanding of interactive quality is also associated with user-related factors. Designers consider user-related factors to be the most important in interactive qualities compared to other factors. This is aligned with the findings in , where Personas and Character are considered to be the most important elements in communicating interactive and environmental qualities of the tool.
From the answers to the open-ended questions, we find the following differences in the way interactivity is viewed: For UI/UX designers, when they describe user-related factors, they are based on the following two points: first, user experience, such as ‘Users have clickable buttons in locations where they need to click, and the button is prominent and memorable. (ID: 96);’ Secondly, the user process, for instance: ‘The human inputs instructions to the computer through the human-computer interface, and the computer presents the output results to the user after processing. (ID:53).’ For Interaction designers, topics of user related, and process related factors also focused on the relationship between users and prototypes, ‘Oriented by user needs and striving to create and establish meaningful relationships between people and products and services. (ID:52).’ Product designers are more concerned about the user needs ‘Understand user needs and facilitate users to make quick choices about content. (ID: 28).’
Product designers talk about the Function (Prototype related) factors, ‘The prototype of a product is also a communication tool that helps (digital) designers (experts) to communicate their ideas to users or customers (nonspecialist audience) and then use this feedback to improve the product. (ID: 15).’ About Visualization factors: ‘Prototype interactions allow us to better visualize the interaction and basic logic of the entire page based on company strategy, content, and structure. (ID:80, UI/UX designer).’
UI/UX designers and Interaction designers talk more about Process-related factors than others. Interaction designer ‘Representing product requirements on a diagram and transforming abstract textual product requirements into concrete graphical product options after a series of analyses. (ID:60);’ UI/UX designers ‘Based on the prototype, designers can refine the concept step by step, test its feasibility and become the most powerful tool for early marketing. (ID: 116).’
In , the additional elements for environmental qualities are divided into user-related factors (6 citations) and prototype-related factors (17 citations), with prototype-related factors being further broken into hardware & system (10 citations), community (5 citations), and psychological (2 citations) factors.
Overall, about half of these additional elements are related to the Hardware & System (Prototype related, mentioned in ). Most of the four groups’ understanding of environmental quality is also associated with the Prototype Hardware & System factors.
Table 11. The value represents the number of designers citing each code (Environmental qualities).
All four groups of designers refer to User related factors: ‘It should be used by specific user groups based on product content’ (ID: 80, UI/UX designer); ‘According to the social environment, the meaning should be permeated in the prototype to deepen the user’s understanding of the system.’ (ID:59, Interaction designer); ‘Develop prototypes with target users and build user scenarios based on the user’s location and environment at the time of use.’ (ID: 27, Industrial designer); ‘My understanding of the characteristics of the prototype environment is that it can be modified according to the needs of the user.’ (ID: 85, Product designer).
Similarly, all four groups of designers refer to Hardware & System-related factors: ‘A prototype is a system that can be run, repeatedly modified, and continuously improved.’ (ID: 53, UI/UX designers); ‘The prototype technique enables the rapid implementation of a preliminary model of the system for developers and users to communicate in order to obtain a more accurate picture of the user’s needs.’ (ID: 46, Interaction designer); ‘Prototype development environment including regular programming environment and prototype environment.’ (ID: 7, Industrial designer); ‘ … includes programming’ (ID:81, Product designer).
UI/UX designers and Interaction designers mentioned the Psychological factors. ‘Good prototyping cannot be done without a product mind-set. Product mind-set mainly includes the three directions of visitors, scenarios, and iterations. From these three directions, we can extend the visitor portrait, behavioral characteristics, demand scenarios, data burial points and other content.’ (ID:106, UI/UX designer); ‘The archetypes of ideal environmental patterns constructed in the human consciousness, derived from the ontological culture.’ (ID: 60, Interaction designer).
About the Community factors: ‘The prototype has to be adapted to more scenarios and groups. It has to have a broader scope of interaction so that it could be more convenient in use.’ (ID:121, Interaction designer); ‘Product prototypes can be made to different degrees by different teams, different environments, and different target points.’ (ID:15, Product designer).
The overall finding from this section of Survey 2 is that designers typically identify with user-related factors when it comes to communicating interactive qualities using prototypes. Furthermore, designers are more likely to associate them with prototypes related factors when it comes to environmental qualities.
6. Discussion
6.1. Differences in preferences between SP and TP group for the using prototyping tools
Data from Survey 1 provides answers to RQ1 (different preferences between SP designers vs TP designers). First, the data indicate that the SP group uses a wider range of tools than the TP group. This is expected to some extent as literature shows SPs have a greater complexity in terms of components and in turn design process (Raff et al., Citation2020) Tomiyama et al. (Citation2019) (Porter & Heppelmann, Citation2015).; Indeed, this finding confirms our underlying reasons for researching prototyping in SPs, i.e., that there is still a need for an understanding of the preferences and needs of different disciplines in SP prototyping. Within this pattern, we see that several tools are used by both groups with similar frequency and preference (for example Hand sketches and CAD, as summarized in subsection 3.2.1). More importantly we also see within the SP group that Wireframe, User journey, and Storyboard were used by SP designers more frequently than TP designers. Notably, they are tools used more frequently, but receive relatively low score for satisfaction in terms of communicating design intent.
The second research question uses dimensions of fidelity as a framework to explore the motivations for designers choice of tools. As with preferences, we find some differences in the dimensions of fidelity motivate tool use. Form/Visualization is the greatest motivator for tool choice in the TP group, while the SP group are more motivated by Functionality, Interactivity and Environment dimensions of fidelity. We contend this reflects how the utility and value of SPs going beyond their physical qualities, SPs have these user and contextual elements. With respect to specific tools, data showed that Wireframe, User journey, and Storyboard are clustered as being most suited to prototype/represent interactivity and environment dimensions of fidelity. Thusly, this study highlights the prototyping tools for which designers have greater need in SPD, in addition to what is known generally about TPD prototyping tools.
We contend the findings from Survey 1 indicate patterns of prototyping that reflect the core differences in SPD versus TPD. Namely, complexity embodied in the products brings a greater range of qualities/aspects that must be designed (Raff et al., Citation2020). Furthermore, a number of these qualities/aspects can be classed as ‘intangible’ qualities/aspects (Tomiyama et al., Citation2019). Thus, it makes sense that User journey, Storyboard and Wireframe are used more frequently by SP designers because they offer prototyping of said intangible qualities with particular concern for interactive and environmental qualities compared to those preferred by the TP group. The survey offers essential empirical evidence that these three tools, which are often considered the domain of UX/UI and Interaction designers (Canziba, Citation2018) are necessary tools for any designer involved in the early phases of developing SPs. In other words, knowledge of these tools is an important capability across design teams if they are to enact best practice outlined in Raff et al. (Citation2020) of developing tangible and intangible concurrently.
In summary, while it is known that SP prototyping requires more disciplines, these surveys offer empirical evidence/understanding of this in terms of dimensions of fidelity. SP designers surveyed in the study clarify specifically the heightened need to communicate dimensions of interactivity and environment alongside form and function.
6.2. Different elements of prototyping tools that support communicating interactive and environmental qualities
This section addresses the extent to which data from survey two answers RQ3 and RQ4. The third research question explores prototyping practices of different design stakeholders (Industrial designers, product designers, UX/UI, and Interaction designers). This is first examined by analyzing their frequency of using User Journeys, Wireframes and Storyboards. The findings indicate an overall trend of similar frequency of use across the four design disciplines (). That is, User journey and Wireframe are more frequently used than Storyboard across all four design disciplines. Still, with Storyboard, there are significant differences between Interaction designers and Industrial designers, and between Industrial designers and Product designers. Hence despite broad similarities, there are some subtle differences in the way disciplines employ these prototyping tools (User journey, Wireframe and Storyboard).
The fourth research question aimed to further assess the use of User Journeys, Storyboards and Wireframes in terms of their core elements and how these elements contribute to communicating interactive and environmental qualities of a design. As with overall patterns of using these tools, there are similarities in the respective importance of elements across design disciplines. Likewise, there are strong similarities in the ranking of elements to communicate both interactive and environmental qualities, specifically that the element of Personas and Character (User journey), Timeline and Scene (Storyboard) and Structure and Content (Wireframe) are rated most effective in communicating interactive and environmental qualities. We view this pattern as suggesting two themes: user depiction and contextual information. As such, we contend these themes (and elements within each tool) are the most important elements for all disciplines when communicating the interactive and environmental qualities of a design. For user information, all disciplines have in common a focus on the needs and requirements of the user from the responses to open-ended questions in . For contextual information, it is a higher level of the user information, which is often focused on usability and user experience, as well as accessibility. That is aligned with Yu et al. (Citation2018)’s view that engineers and designers both understood the importance of the user’s involvement beginning in the early stages of the process through prototyping. This likely reflects how many products are developed with a user-centered design approach, where the user is involved in the process of development (Figliolia et al., Citation2020). The finding of the user depiction and contextual information in this research adds to the literature suggesting that the important thing for a prototyping tool is that it depicts and understands the user alongside the prototype.
Section 4.2.2 further addresses the RQ4 responses by uncovering the different design disciplines’ understanding of interactive and environmental qualities. Based on the element level, concerning the design occupations, we can group Interaction designers and UI/UX designers as being mainly concerned with user-related factors, such as factors related to the user operation, including user experience, user feedback, user process (the process of using the product/prototype). On the other hand, Product designers and Industrial designers are seen as a group that is more concerned with the physical qualities/characteristics of the prototype/design. Thus, this difference may explain their respective prototyping usage preferences. Namely, that Product and Industrial designers prefer to use tools representing products, while Interaction and UI/UX designers prefer to use tools that explore user-related information. These findings enrich previous research by understanding in detail the preferences for use of prototyping tools among different design occupations. Participants in Survey 1 include designers and engineers in different occupations, while in Survey 2, we narrow the scope into four different groups of designers: UI/UX designers, Interaction designers, Product designers and Industrial designers. Thus, extending the work by Carfagni et al. (Citation2020); Pei et al. (Citation2011) that only compare engineers and industrial designers. The difference in preference is also consistent with the points made by Diefenbach et al. (Citation2019); that is, user experience research and testing of prototypes with actual target groups is essential, and UX designers have a heightened concern for user considerations in the development process.
Our focus is on the early design process with communication within teams where design requires relatively low fidelity prototypes. As such our findings suggest elements of user journey and wireframe, that offer a helpful low fidelity alternative to fully interactive prototypes. In other words, we can see how the elements might act as a ‘proxy’ or low fidelity version that teams use to consider these elements but at lower fidelity before they reach such testing.
In summary, through the two surveys, we provide a further empirical evidence of the pattern of the tools used across design disciplines. Survey 2 also offers empirical data on using User journey, Wireframe, and Storyboard as instrumental tools to communicate these qualities. Furthermore, we also provide novel insights on the specific elements of these tools that support communication. Lastly, we also provide insights in terms of the similarities in using prototyping tools between different designers, that they are broadly similar. We understand that effective communication can have a positive impact on overall creativity, by identifying these factors, we can ideally enhance communication and, as a result, promote creativity.
6.3. Limitations and future work
Limitations around sample size are important to consider for generalizing results. Specifically, the relatively small sample size and countries of origin of participants (most of the participants come from Australia and China), the demographics and culture of the participants are not taken into account in this study. However, the participants employ identical tools, albeit in diverse languages or versions, and the research on SP prototyping tools remains valuable. Another potential limitation is the wide range of experience among participants, ranging from 3 to 18 years (M = 6.9, SD = 3.4). However the standard deviation indicates the majority of participants have a relatively similar level of experience.
The results of this study provide an important step toward understanding the usage of prototyping tools in the new paradigm of SP. It is noted however, our study has a specific focus on the early phases of the SPD process. Hence our findings are limited to practices that occur in the early stages of NPD. Thus, an obvious next step is to extend the research into later phases of the process where a requirement for high fidelity could lead to different preferences and motivations for using different prototyping tools.
We also contend further design research in the area of prototyping should also be extended to specific professional populations in real projects, that is another limitation. The outcome is still valid as our intention is preliminary research addressing differences in prototyping tool usage between SPD and TPD.
The detailed findings on the way certain elements are more or less important for different design occupations also present opportunities for researchers interested in developing new and hybrid design tools. Namely that this understanding can be the basis to experiment with hybrid tools that might create more efficient creation of prototypes, these may be explored further for use either by specific disciplines or used collaboratively by multiple designers. The study also revealed specific potential additions to the prototyping tool (subsection 4.2.2), including the interactive and environmental qualities of tools. As in subsection 3.2.1, the data shows that these three tools (User journey, Storyboard and Wireframe are high frequency used tools which provides strong evidence that low fidelity prototyping tools are worth pursuing further. They offer the potential for designers to communicate design objectives more effectively through a natural, creative design process. Hence, these findings provide a clearer picture of the more important elements of existing tools in the practice of SPD. The findings of this paper set the foundation to create and test such combined and hybrid prototyping approaches. It follows that future research will test their efficacy in communicating the qualities of SPs holistically to a range of stakeholders.
7. Conclusions
In response to limited existing research on SP prototyping tools, this paper addresses the preferences and dimensions of fidelity of different prototyping tools that can support communication in the SPD process for various stakeholders. The two survey studies focused on the early-stage design phase, answering questions about designers’ prototyping tool preferences in communicating concepts in SPD. The research demonstrates that SP designers use a wider range of tools more frequently than TP designers. At the same time, the results indicate that SP designers are motivated to use prototyping tools related to interaction design, such as User journey, Wireframe and Storyboard, more frequently than TP designers. Furthermore, we find similar use of these tools across four design disciplines, with slight variances in the elements of the tool that influence communicating interactive and environmental qualities.
This paper contributes an important clarification of the differences and similarities between the use of prototyping tools in SPD versus TPD. It also contributes a level of resolution by specifying the dimensions of fidelity and elements of prototyping tools that offer support in SP development. SP designers have a greater focus on the interactivity and environment dimensions of fidelity when prototyping compared to TP designers. As such, we contend to contribute important additions to the literature on prototyping reflecting the trend for a range of design disciplines to work together on increasingly wide array of SPs.
Disclosure statement
There are no relevant financial or non-financial competing interests to report.
References
- Akoğlu, C., & Er, H. A. (2015). The role of interaction design in smart product development activities. Online Journal of Art and Design, 3(4), 51–65. https://eresearch.ozyegin.edu.tr/handle/10679/6376
- Allmendinger, G., & Lombreglia, R. (2005). Four strategies for the age of smart services. Harvard Business Review, 83(10), 131.
- Alter, S. (2020). Making sense of smartness in the context of smart devices and smart systems. Information Systems Frontiers, 22(2), 381–393. https://doi.org/10.1007/s10796-019-09919-9
- Bao, Q., Faas, D., & Yang, M. (2018). Interplay of sketching & prototyping in early stage product design. International Journal of Design Creativity & Innovation, 6(3–4), 146–168. https://doi.org/10.1080/21650349.2018.1429318
- BenMahmoud‐Jouini, S., & Midler, C. (2020). Unpacking the notion of prototype archetypes in the early phase of an innovation process. Creativity and Innovation Management, 29(1), 49–71. https://doi.org/10.1111/caim.12358
- Berger, A., Bischof, A., Totzauer, S., Storz, M., Lefeuvre, K., & Kurze, A. (2019). Sensing home: Participatory exploration of smart sensors in the home. Social Internet of Things, 123–142. https://doi.org/10.1007/978-3-319-94659-7_7
- Beverungen, D., Müller, O., Matzner, M., Mendling, J., & Vom Brocke, J. (2019). Conceptualizing smart service systems. Electronic Markets, 29(1), 7–18. https://doi.org/10.1007/s12525-017-0270-5
- Bogers, M., & Horst, W. (2014). Collaborative prototyping: Cross‐fertilization of knowledge in prototype‐driven problem solving. Journal of Product Innovation Management, 31(4), 744–764. https://doi.org/10.1111/jpim.12121
- Camburn, B. A., Auernhammer, J. M., Sng, K. H. E., Mignone, P. J., Arlitt, R. M., Perez, K. B., Huang, Z., Basnet, S., Blessing, L. T., & Wood, K. L. (2017, August 6–9). Design innovation: A study of integrated practice. ASME 2017 international design engineering technical conferences and computers and information in engineering conference, Cleveland, Ohio, USA.
- Canziba, E. (2018). Hands-on UX design for developers: Design, prototype, and implement compelling user experiences from scratch. Packt Publishing Ltd.
- Carfagni, M., Fiorineschi, L., Furferi, R., Governi, L., & Rotini, F. (2020). Usefulness of prototypes in conceptual design: Students’ view. International Journal on Interactive Design & Manufacturing (IJIDeM), 14(4), 1305–1319. https://doi.org/10.1007/s12008-020-00697-2
- Carlgren, L., Elmquist, M., & Rauth, I. (2016). The challenges of using design thinking in industry–experiences from five large firms. Creativity and Innovation Management, 25(3), 344–362. https://doi.org/10.1111/caim.12176
- Carlile, P. R. (2002). A pragmatic view of knowledge and boundaries: Boundary objects in new product development. Organization Science, 13(4), 442–455. https://doi.org/10.1287/orsc.13.4.442.2953
- Coutts, E., & Pugsley, C. (2018). Physical versus Virtual prototyping and their effect on design solutions. DS 89: Proceedings of The Fifth International Conference on Design Creativity (ICDC 2018), University of Bath, Bath, UK.
- Coutts, E. R., Wodehouse, A., & Robertson, J. (2019, August 5–8). A comparison of contemporary prototyping methods. Proceedings of the Design Society: International Conference on Engineering Design, Delft, The Netherlands.
- Deininger, M., Daly, S. R., Sienko, K. H., & Lee, J. C. (2017). Novice designers’ use of prototypes in engineering design. Design Studies, 51, 25–65. https://doi.org/10.1016/j.destud.2017.04.002
- Dhebar, A. (1996). Information technology and product policy: ‘Smart’products. European Management Journal, 14(5), 477–485. https://doi.org/10.1016/0263-2373(96)00041-2
- Diefenbach, S., Christoforakos, L., Maisch, B., & Kohler, K. (2019, August 5–8). The state of prototyping practice in the industrial setting: Potential, challenges and implications. Proceedings of the Design Society: International Conference on Engineering Design, Delft, The Netherlands.
- ElMaraghy, W., ElMaraghy, H., Tomiyama, T., & Monostori, L. (2012). Complexity in engineering design and manufacturing. CIRP Annals, 61(2), 793–814. https://doi.org/10.1016/j.cirp.2012.05.001
- Feliciano Filho, M., Liao, Y., Loures, E. R., & Junior, O. C. (2017). Self-aware smart products: Systematic literature review, conceptual design and prototype implementation. Procedia Manufacturing, 11, 1471–1480. https://doi.org/10.1016/j.promfg.2017.07.278
- Figliolia, A. C., Sandnes, F. E., & Medola, F. O. (2020). Experiences using three app prototyping tools with different levels of fidelity from a product design student’s perspective. International Conference on Innovative Technologies and Learning, Porto, Portugal.
- Fiorineschi, L., & Rotini, F. (2019, August 5–8). Unveiling the multiple and complex faces of fidelity. Proceedings of the Design Society: International Conference on Engineering Design, Delft, The Netherlands.
- Goudswaard, M., Gopsill, J., Harvey, M., Snider, C., Bell, A., & Hicks, B. (2021, August 16–20). Revisiting prototyping in 2020: A snapshot of practice in UK design companies. Proceedings of the Design Society, Gothenburg, Sweden. (Vol. 1, pp. 2581–2590).
- Häggman, A., Tsai, G., Elsen, C., Honda, T., & Yang, M. C. (2015). Connections between the design tool, design attributes, and user preferences in early stage design. Journal of Mechanical Design, 137(7). https://doi.org/10.1115/1.4030181
- Hallgrimsson, B. (2012). Prototyping and modelmaking for product design. Laurence King Publishing.
- Hart, S. J., & Baker, M. J. (1994). The multiple convergent processing model of new product development. International Marketing Review, 11(1), 77–92. https://doi.org/10.1108/02651339410057536
- Houde, S., & Hill, C. (1997). What do prototypes prototype? In Handbook of human-computer interaction (pp. 367–381). Elsevier.
- Isa, S. S., Liem, A., & Steinert, M. (2015). The value of prototypes in the early design and development process. DS 80-5 Proceedings of the 20th International Conference on Engineering Design (ICED 15) Vol 5: Design Methods and Tools-Part 1, Milan, Italy, 27-30.07. 15.
- Jensen, M. B., Elverum, C. W., & Steinert, M. (2017). Eliciting unknown unknowns with prototypes: Introducing prototrials and prototrial-driven cultures. Design Studies, 49, 1–31. https://doi.org/10.1016/j.destud.2016.12.002
- Jordan, M. E., & Babrow, A. S. (2013). Communication in creative collaborations: The challenges of uncertainty and desire related to task, identity, and relational goals. Communication Education, 62(2), 210–232. https://doi.org/10.1080/03634523.2013.769612
- Kent, L., Snider, C., Gopsill, J., & Hicks, B. (2021). Mixed reality in design prototyping: A systematic review. Design Studies, 77, 101046. https://doi.org/10.1016/j.destud.2021.101046
- King, N., & Anderson, N. (1995). Innovation and change in organizations. Routledge.
- Kleinsmann, M., & Dong, A. (2007). Investigating the affective force on creating shared understanding. ASME 2007 International Design Engineering Technical Conferences and Computers and Information in Engineering Conference, Los Vegas, Nevada, USA.
- Kleinsmann, M., & Valkenburg, R. (2008). Barriers and enablers for creating shared understanding in co-design projects. Design Studies, 29(4), 369–386. https://doi.org/10.1016/j.destud.2008.03.003
- Langley, D. J., van Doorn, J., Ng, I. C., Stieglitz, S., Lazovik, A., & Boonstra, A. (2021). The internet of everything: Smart things and their impact on business models. Journal of Business Research, 122, 853–863. https://doi.org/10.1016/j.jbusres.2019.12.035
- Lauff, C. A., Knight, D., Kotys-Schwartz, D., & Rentschler, M. E. (2020). The role of prototypes in communication between stakeholders. Design Studies, 66, 1–34. https://doi.org/10.1016/j.destud.2019.11.007
- Lauff, C. A., Kotys-Schwartz, D., & Rentschler, M. E. (2018). What is a prototype? What are the roles of prototypes in companies? Journal of Mechanical Design, 140(6). https://doi.org/10.1115/1.4039340
- Liker, J. K., & Pereira, R. M. (2018). Virtual and physical prototyping practices: Finding the right fidelity starts with understanding the product. IEEE Engineering Management Review, 46(4), 71–85. https://doi.org/10.1109/EMR.2018.2873792
- Li, Y., Roy, U., & Saltz, J. S. (2019). Towards an integrated process model for new product development with data-driven features (NPD3). Research in Engineering Design, 30(2), 271–289. https://doi.org/10.1007/s00163-019-00308-6
- Maioli, L. (2018). Fixing bad UX designs: Master proven approaches, tools, and techniques to make your user experience great again. Packt Publishing Ltd.
- Mathias, D., Snider, C., Hicks, B., & Ranscombe, C. (2019). Accelerating product prototyping through hybrid methods: Coupling 3D printing and LEGO. Design Studies, 62, 68–99. https://doi.org/10.1016/j.destud.2019.04.003
- McCurdy, M., Connors, C., Pyrzak, G., Kanefsky, B., & Vera, A. (2006). Breaking the fidelity barrier: An examination of our current characterization of prototypes and an example of a mixed-fidelity success. Proceedings of the SIGCHI conference on Human Factors in computing systems, Montréal, Québec, Canada.
- Miles, M. B. (1994). Qualitative data analysis : An expanded sourcebook (2nd ed. ed.). Sage.
- Nunes, M. L., Pereira, A., & Alves, A. C. (2017). Smart products development approaches for Industry 4.0. Procedia Manufacturing, 13, 1215–1222. https://doi.org/10.1016/j.promfg.2017.09.035
- Pan, S., & Wang, Z. (2019). The exploration of smart object design method—applying user experience five elements for smart object design from theory research to design practice. Journal of Physics: Conference Series.
- Pei, E., Campbell, I., & Evans, M. (2011). A taxonomic classification of visual design representations used by industrial designers and engineering designers. Design Journal, 14(1), 64–91. https://doi.org/10.2752/175630610X12877385838803
- Porter, M. E., & Heppelmann, J. E. (2015). How smart, connected products are transforming companies. Harvard Business Review, 93(10), 96–114. https://hbr.org/2015/10/how-smart-connected-products-are-transforming-companies
- Raff, S., Wentzel, D., & Obwegeser, N. (2020). Smart products: Conceptual review, synthesis, and research directions. Journal of Product Innovation Management, 37(5), 379–404. https://doi.org/10.1111/jpim.12544
- Ranscombe, C., Bissett-Johnson, K., Mathias, D., Eisenbart, B., & Hicks, B. (2020). Designing with LEGO: Exploring low fidelity visualization as a trigger for student behavior change toward idea fluency. International Journal of Technology and Design Education, 30(2), 367–388. https://doi.org/10.1007/s10798-019-09502-y
- Rodda, J., Ranscombe, C., & Kuys, B. (2022). A method to explore strategies to communicate user experience through storyboards: An automotive design case study. Ai Edam, 36, 36. https://doi.org/10.1017/S0890060421000287
- Rogers, Y. (2004). New theoretical approaches for human‐computer interaction. Annual Review of Information Science and Technology, 38(1), 87–143. https://doi.org/10.1002/aris.1440380103
- Rowland, C., Goodman, E., Charlier, M., Light, A., & Lui, A. (2015). Designing connected products: UX for the consumer internet of things. O’Reilly Media, Inc.
- Sauer, J., Seibel, K., & Rüttinger, B. (2010). The influence of user expertise and prototype fidelity in usability tests. Applied Ergonomics, 41(1), 130–140. https://doi.org/10.1016/j.apergo.2009.06.003
- Scharfenberger, P., Wentzel, D., Warlop, L., & Tomczak, T. (2014). Tangible possessions and the self–how objects reduce perceived distance to their symbolized meanings. ACR North American Advances.
- Self, J. A. (2019). Communication through design sketches: Implications for stakeholder interpretation during concept design. Design Studies, 63, 1–36. https://doi.org/10.1016/j.destud.2019.02.003
- Stolterman, E. (2008). The nature of design practice and implications for interaction design research. International Journal of Design, 2(1), 55–65. http://ijdesign.org/index.php/IJDesign/article/view/240
- Tomiyama, T., D’Amelio, V., Urbanic, J., & ElMaraghy, W. (2007). Complexity of multi-disciplinary design. CIRP Annals, 56(1), 185–188. https://doi.org/10.1016/j.cirp.2007.05.044
- Tomiyama, T., Lutters, E., Stark, R., & Abramovici, M. (2019). Development capabilities for smart products. CIRP Annals, 68(2), 727–750. https://doi.org/10.1016/j.cirp.2019.05.010
- Ulrich, K. T., & Eppinger, S. D. (2011). Product design and development (5th ed.). McGraw-Hill higher education.
- UX studio. (2019). UX Storyboard Creation: A Complete Guide For Beginners https://uxstudioteam.com/ux-blog/ux-storyboard/
- Valencia Cardona, A., Mugge, R., Schoormans, J. P., & Schifferstein, H. N. (2014). Challenges in the design of smart product-service systems (PSSs): Experiences from practitioners. Proceedings of the 19th DMI: Academic Design Management Conference. Design Management in an Era of Disruption, London, UK, September 2-4.
- Virzi, R. A. (1989). What can you learn from a low-fidelity prototype? Proceedings of the Human Factors Society Annual Meeting, Los Angeles, CA. SAGE Publications.
- Ward, J. H., Jr. (1963). Hierarchical grouping to optimize an objective function. Journal of the American Statistical Association, 58(301), 236–244. https://doi.org/10.1080/01621459.1963.10500845
- Wu, Y., & Pillan, M. (2017). From respect to change user behaviour. Research on how to design a next generation of smart home objects from user experience and interaction design. Design Journal, 20(sup1), S3884–S3898. https://doi.org/10.1080/14606925.2017.1352891
- Yang, M. C. (2004). An examination of prototyping and design outcome. ASME 2004 International Design Engineering Technical Conferences and Computers and Information in Engineering Conference, Salt Lake City, Utah, USA.
- Yang, Q., Steinfeld, A., Rosé, C., & Zimmerman, J. (2020). Re-examining whether, why, and how human-AI interaction is uniquely difficult to design. Proceedings of the 2020 chi conference on human factors in computing systems, Honolulu, HI, USA.
- Yu, F., Pasinelli, M., & Brem, A. (2018). Prototyping in theory and in practice: A study of the similarities and differences between engineers and designers. Creativity and Innovation Management, 27(2), 121–132. https://doi.org/10.1111/caim.12242
- Zink, L., Hostetter, R., Böhmer, A. I., Lindemann, U., & Knoll, A. (2017, June 27–29). The use of prototypes within agile product development explorative case study of a makeathon. 2017 International Conference on Engineering, Madeira Island, Portugal. Technology and Innovation (ICE/ITMC).