
 ?Mathematical formulae have been encoded as MathML and are displayed in this HTML version using MathJax in order to improve their display. Uncheck the box to turn MathJax off. This feature requires Javascript. Click on a formula to zoom.
Abstract
Limestone-calcined clay-cement (LC3), as one of the most promising sustainable cements, has been under development over the past decade. However, many uncertainties remain regarding its rheological behaviors, such as the metakaolin content of calcined clay. This study aims to investigate the effect of increasing the content of fine-grained metakaolin in calcined clay on the rheology of LC3 pastes. Rheological behaviors and early-age hydration of studied mixtures were characterized using flow curve, constant shear rate, small amplitude oscillatory shear and isothermal calorimetry tests. Results show that increasing the content of fine-grained metakaolin decreased flowability but promoted structural build-up and early-age hydration. These phenomena can be attributed to the decrease of mean interparticle distance caused by the increased amount of fine-grained metakaolin, which may enhance colloidal interactions, C-S-H nucleation and direct contact between particles. Overall, modifying the fine-grained metakaolin content is a feasible approach to control the rheology of LC3 pastes.
1. Introduction
Ordinary Portland cement (OPC) substitution using supplementary cementitious materials (SCMs) is becoming a prominent strategy adopted to decrease the environmental impacts arising from the cement industry [Citation1–3]. Common SCMs, e.g. fly ash, slag, and silica fume, have been employed as clinker/OPC substitutes for many years [Citation4,Citation5]. However, a critical issue hindering the utilization of these common SCMs for a longer-term application in concrete is their gradual decline in yield and availability [Citation4, Citation6]. Therefore, to ensure an uninterrupted supply of SCMs-based concrete, there is an urgent need to seek alternative SCMs. In this context, calcined clay and limestone are proposed by many researchers as the ideal sustainable alternatives to the common SCMs due to their abundant global supply of raw materials [Citation7–10].
Replacing part of OPC with calcined clay and limestone not only helps to improve the mechanical and durability-related performance of concrete, but also contributes to a significant reduction of CO2 emissions [Citation11,Citation12]. As one of the most promising sustainable low-CO2 cements, limestone-calcined clay-cement (LC3) has been under development for the last decade with an exponentially growing rate of research [Citation7, Citation13,Citation14]. LC3-50, as the most typical and commercial ternary blend, is comprised of 50% clinker, 15% limestone, 30% calcined clay, and 5% gypsum [Citation15]. The main reactive phase in calcined clay is metakaolin (MK), produced by the calcination of kaolinite clay at 700-850 °C [Citation16]. MK with high purity is relatively scarce and expensive, and is generally consumed by other industries, e.g. painting, paper, ceramics, and refractory [Citation6, Citation17]. Thus, instead of MK, calcined low-grade kaolinite clay (low MK content) is generally used in LC3 [Citation18]. According to Avet et al. [Citation19], it is feasible to use calcined low-grade kaolinitic clay (kaolinite content: about 40 wt.%) in LC3-50 to achieve a comparable compressive strength with OPC mortar after 7 days. Owing to different raw materials (2:1 or 1:1 clay, note that 2:1 or 1:1 denotes the ratio between tetrahedral and octahedral sheets in each layer of calcined clay microstructure), calcination and treatment (cooling and grinding) methods, calcined clays from different suppliers may be variable in physical and chemical features, including calcined kaolinite clay content (MK content), secondary phase (impurity), fineness, morphology, and others [Citation17, Citation19,Citation20].
Due to the high specific surface area (SSA), small particle size, and layered particle structure of calcined clay, the cementitious material containing calcined clay may require a relatively high water content and superplasticizer (SP) to reach the comparable workability to OPC-based materials [Citation3, Citation17, Citation21,Citation22]. Moreover, the use of different calcined clays may also alter the fresh properties of LC3 mixtures. As reported by Ferreiro et al. [Citation23], compared to calcined 1:1 clay, the LC3 mixture with calcined 2:1 clay displayed a lower water demand for reaching the same flowability. Quartz as the second phase/impurity in calcined clay decreases the total SSA, water and SP demands [Citation24,Citation25]. In addition to the flow behavior, the structural build-up (refers to the evolution of yield stress and stiffness over time) of LC3 mixtures can also be modified by using different calcined clays. Beigh et al. [Citation26] pointed out that the uncalcined kaolinite in calcined clay may increase interaction of SP molecules, promoting the structural build-up of fresh LC3 pastes. Although some research has been carried out on fresh properties of LC3 mixtures, very little attention has been paid to systematically exploring the role of MK content of calcined clay on both flow behaviors and structural build-up. The attempt to control the rheology of LC3 mixtures by modifying the fine-grained MK content of calcined clay is lacking.
Characterization of rheology and structural build-up (including both thixotropy and non-reversible structuration) using rheometry is important to reveal plausible mechanisms dominating fresh state behaviors of LC3 mixtures. The rheological behaviors of fresh cementitious materials can be quantified using rotational measurement, for instance, flow curve [Citation3, Citation27,Citation28] and hysteresis loop [Citation2, Citation29,Citation30] protocols. According to the test results from [Citation2], the addition of calcined clay can increase dynamic yield stress and apparent viscosity, potentially increasing the pumping and transportation difficulties of fresh LC3 mixture in concrete construction. To study the structural build-up of fresh cementitious materials, both static yield stress and elasticity (through oscillations) evolution with time may need to be quantified. Static yield stress, arising from the overlapping effect of C-S-H nucleation, colloidal interaction, and direct contact [Citation31], can be measured using different approaches, for instance, constant shear rate [Citation32–34], stress growth [Citation35], and creep recovery [Citation36,Citation37]. Researchers [Citation2, Citation38] found that the static yield stress evolution with time can be boosted by adding calcined clay. The high static yield stress and structuration rate are beneficial to reduce the lateral pressure on the formwork of cast concrete and improve the buildability in 3 D concrete printing, whereas the fast structuration might lead to cold-joint in multi-layer-casting or layer-extrusion printing process with a relatively long time gap [Citation39,Citation40]. Additionally, small/low amplitude oscillatory shear (SAOS)-time sweep test is usually employed to probe the stiffness, elasticity, and very early-age hydration of fresh cementitious materials over the first few hours before the initial set [Citation41–44]. The rise in storage modulus G' acquired from SAOS-time sweep testing coincides with the growth of C-S-H bridges and nucleation between particles [Citation31]. By using SAOS-time sweep test, Kandagaddala and Nanthagopalan [27] found that increasing the limestone and calcined clay content from 5 wt.% to 20 wt.% in the binder accelerated the flocculation of LC3 mixtures. Nevertheless, research on the rheology and structural build-up of LC3 mixtures by rheometry is still limited.
The goal of this study is to investigate the effect of increasing the fine-grained MK content of calcined clay on the rheology of LC3 pastes. A flow curve test was conducted at 10, 20 and 30 min to characterize the flow behaviors of studied mixtures. The structural build-up within the first tens of minutes was quantified by static yield stress measurement and small amplitude oscillatory shear test. Additionally, isothermal calorimetry was employed to determine hydration kinetics. Finally, a discussion of the results, plausible mechanisms and perspectives is provided.
2. Material and methods
2.1. Materials
The solid components used in this paper included CEM I 52.5 Portland cement (PC), calcined clay (CC), limestone powder (LP), and gypsum. Two types of calcined clay were employed. Calcined low-grade kaolinite clay (CC-1), with about 50% of metakaolin (MK), was provided by Argeco, France. Calcined high-grade kaolinite clay (CC-2) that contained nearly 95% of MK was supplied by Burgess, USA. Gypsum with more than 99% purity was purchased from Merck KGaA, Germany. shows particle size distribution of all solid components. It can be found that CC-1 displayed the coarsest grain size compared to others, whereas CC-2 was the finest one with the average particle size of 3.75 μm. X-ray diffraction (XRD) patterns of PC, CC-1, CC-2 and LP, obtained by a PhilipsPW1830 powder X-ray diffractometer with Cu-Kα radiation operated at 45 kV and 40 mA, step size of 0.030°, rate of 2.0 s per step and 2 Theta range of 5-70°, are illustrated in . Quartz was found to be the major impurity in CC-1 (about 34 wt.%) and the main cause of its coarse grain size, as shown in . In contrast, higher amorphous content and less crystalline phases were observed in CC-2. As reported in our earlier study [Citation20], the reactive content in CC-1 and CC-2 are 48.8 wt.% and 75.1 wt.%, respectively. X-ray fluorescence (XRF) characteristics of CC-1, CC-2, PC, and LP are presented in . Physical characteristics, including density, Brunauer-Emmett-Telle (BET) specific surface area (SSA), and average particle size (Dv50) of all fines are summarized in . BET SSA was measured using the liquid nitrogen (N2) adsorption method.
Figure 1. (a) Particle size distribution of calcined clay-1 (CC-1), calcined clay-2 (CC-2), Portland cement, limestone powder, and gypsum; (b) X-ray diffraction (Cu-Kα radiation) patterns of CC-1, CC-2, Portland cement, and limestone powder. Cal-calcite, Gp-gypsum, C3S-alite, C3A-tricalcium aluminate, Mul-mullite, Qz-quartz, Kln-kaolinite.
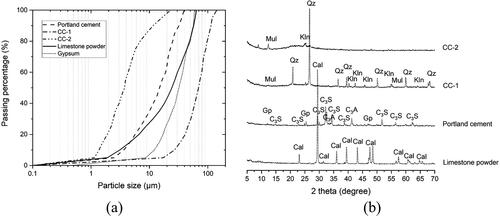
Table 1. Oxide compositions of binding materials.
Table 2. Physical characteristics of all dry components used in this study.
As shown in , all studied mixtures had the same dosage of PC (53 wt.% of the binder), LP (15 wt.% of the binder), CC (CC-1 + CC-2: 30 wt.% of the binder), gypsum (2 wt.% of the binder), and water-to-binder mass ratio (0.3). The calcined clay-to-limestone mass ratio was kept identical to 2:1. For mixtures B45, M45, and H45, 0.8 wt.% of polycarboxylate ether (PCE)-based superplasticizer (SP) (MasterGlenium®51, BASF, Netherlands) was added, and the main difference was the proportion of CC-1 and CC-2. In addition to mixture B45, mixtures M45 and H45 were prepared by replacing 33.3 wt.% and 50 wt.% of CC-1 with CC-2. Compared to mixture B45, the SP dosage in mixture B45-1 was decreased from 0.8 wt.% to 0.6 wt.% of the binder. Mixture B45-1 was prepared to determine the effect of SP on the rheology of LC3 pastes. A small Hobart mixer was employed to prepare paste samples. The liquid (water + SP) was added to the dry blend in the bowl and mixed at low and high speeds for 1.5 min each.
Table 3. Mix designs of cementitious materials (unit: kg/m3).
2.2. Test procedures
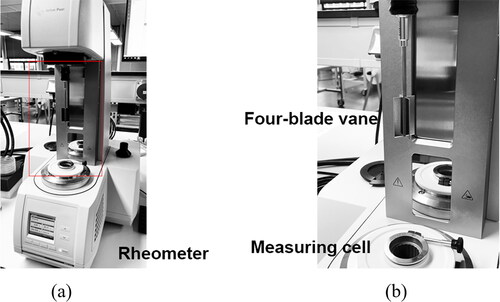
All rheological tests were performed by an Anton Paar MCR 302e rheometer () that was equipped with a four-blade vane (22 mm diameter and 40 mm height) and a cylindrical measuring cup (28.92 mm inner diameter and 68 mm depth). The measuring cup has steel lamellas attached to the inner surface to avoid slippage. For each test, 86 ± 2 g of fresh paste was filled in the measuring cup. Before testing, a fresh sample was compacted on a vibration table at 30 Hz frequency for 30 s to decrease the amount of air bubbles that can affect test results. To ensure the same flow history, a pre-shearing session (100 s−1 of shear rate for 30 s) was executed at the material age of 7 min before conducting rheological tests. After that, a resting time of 150 s (flow curve and static yield stress tests) or 30 s (strain sweep test) was applied. All rheological tests were performed under ambient temperature at about 20 °C.
Figure 2. Illustration of the rheometer used in this study. (a) Photograph of Anton Paar MCR 302e rheometer; (b) Photograph of the four-blade vane and the cylindrical measuring cell.
2.2.1. Flow curve test
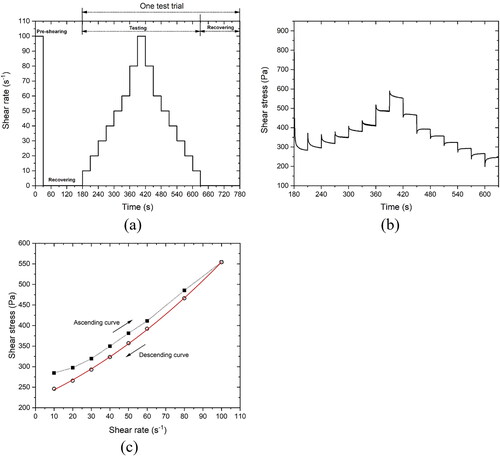
The flow curves of various studied mixtures were obtained using the test protocol illustrated in . After the pre-shearing and recovering session, the first trial of the flow curve test was implemented at 10 min. In the testing session of one test trial, the applied shear rate was 10/20/30/40/50/60/80/100 s−1 for the stepwise ascending branch of the test protocol, followed by the same values to provide the step-down part. Each step lasted 30 s to reach the steady flow state, resulting in a test duration of 7.5 min. The data was collected each 0.3 s. As shown in , under a specific shear rate, the last 30-50 points were found to show a relatively constant value (equilibrium stage). Thus, the last 30 points were extracted and averaged to represent the corresponding shear stress at the given shear rate. Dynamic yield stress can be determined from the descending curve that fits the Bingham or Herschel-Bulkley model. The former was employed when there is a linear relationship between shear stress and applied shear rate
In the case of non-linear correlation, the Herschel-Bulkley model was used.
(1)
(1)
where
is dynamic yield stress. k and n mean consistency factor and power index, respectively. Nevertheless, the modified Bingham model () is better to be employed when n is smaller than 2 for non-linear fitting, as suggested by [Citation45,Citation46]. Compared to the Bingham and Hershel-Bulkley models, more accurate dynamic yield stress can be estimated using the modified Bingham model.
(2)
(2)
and c denote the linear and second-order terms. After the testing session of one test trial, a waiting time of 150 s was applied. The second and third test trials were executed at 20 min and 30 min, respectively
Figure 3. Illustration of the flow curve test. (a) Flow curve test protocol used in the study; (b) A typical plot of flow curve; (c) The average shear stresses with different shear rates. The descending curve was fitted using the modified Bingham model.
2.2.2. Static yield stress measurement
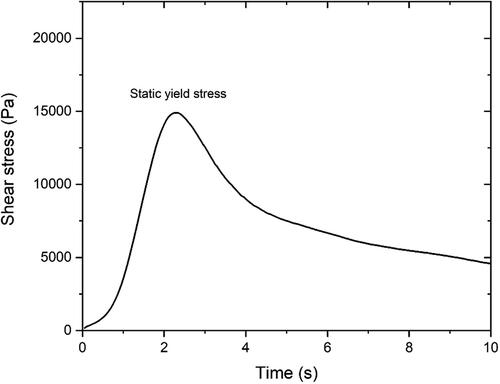
After 30 s of 100 s−1 pre-shearing and 150 s of resting time, the constant shear rate (CSR) measurement was executed every 10 min from material age of 10 min to 30 min. A constant shear rate of 0.3 s−1 and 10 s duration time were selected for each testing in this study. shows a typical curve of the CSR test. The peak value of shear stress refers to the static yield stress of fresh paste at the test age. As reported by [Citation47,Citation48], compared to a multi-sample measurement, the measured static yield stress using a single-sample approach seems to be smaller owing to the destructive nature of the test protocol. However, the “damage” (applied deformation) for each sample should be the same. The magnitude differences between the various studied mixtures can still indicate the influence of different material parameters on structural build-up over the first 30 min.
Figure 4. A typical curve of constant shear rate test.
2.2.3. Small amplitude oscillatory shear test
As a non-destructive test, the SAOS-time sweep test was conducted to monitor the evolution of the elasticity and stiffening (structural build-up) over time of different studied mixtures. As shown in , a continuous sinusoidal excitation was executed to the fresh sample over time, and the measured complex modulus G* can be converted to storage modulus (G') and loss modulus (G'').
(3)
(3)
where
denotes imaginary unit. G' indicates the elasticity evolution of fresh samples with time. In contrast, G'' represents the viscous component of the response and correlates to the dissipated energy in every test cycle [Citation17, Citation31]. Loss factor (G''/G') is used to illustrate the rigidity development of tested materials with time [51]. Note that the G' obtained in SAOS-time sweep test is independent only when the applied strain is smaller than the critical strain of the studied sample [Citation31, Citation41]. Prior to SAOS-time sweep test, an amplitude-sweep (strain-sweep) test was employed to probe the linear viscoelastic domain (LVED) of studied mixtures at the material age of 8 min. The maximum strain in LVED is defined as the critical strain. The amplitude-sweep test was performed with the strain of 0.005% − 50% and a constant frequency of 1 Hz. After that, a SAOS-time sweep test was immediately conducted at the constant frequency of 1 Hz and strain of 0.005% (this value is also employed by [Citation41–43,Citation50,Citation51]) based on the critical strain of all studied mixtures (see Section 3.3). The SAOS-time sweep test was carried out at the material age of about 22 min, and the test duration was 50 min. The data was automatically recorded every 30 s.
Figure 5. Illustration of applied sinusoidal strain and measured shear stress
for a typical viscoelastic material in SAOS-time sweep test.
is defined as phase/loss angle. Loss factor = tan(
) = G''/G'. Adapted from [Citation49].
![Figure 5. Illustration of applied sinusoidal strain γ(t) and measured shear stress τ(t) for a typical viscoelastic material in SAOS-time sweep test. δ is defined as phase/loss angle. Loss factor = tan(δ) = G''/G'. Adapted from [Citation49].](/cms/asset/8bf9d28f-abe5-4b64-9bb3-cb46af9a3b3c/tscm_a_2169965_f0005_b.jpg)
2.2.4. Initial setting time and isothermal calorimetry tests
The initial setting times of all studied mixtures were determined using an automatic Vicat machine. The test procedure was in accordance with NEN-EN 196-3 [Citation52]. An eight-channel TAM Air isothermal calorimeter measured the hydration heat released over the first 7 days. The pre-mixed liquid (water and SP) was poured into the pre-weighed dry components. Afterward, the mixture was mixed by a mixing machine for 3 min. 6 g of fresh paste was filled into a 20 ml glass vessel that was placed in the calorimeter under 20 °C together with a reference vessel (filled with fine quartz sand).
3. Results
3.1. Flow behavior
The descending curves from flow curves were fitted by the Herschel-Bulkley model. The fitted results are presented in . The power index values for all studied mixtures were in the range of 1-2. Thus, as mentioned in Section 2.2.1, the modified Bingham model was implemented (see ). The fitted curves of different mixtures at 10 min, 20 min and 30 min are plotted in . demonstrates the dynamic yield stress of all studied mixtures fitted by the modified Bingham model. All studied mixtures showed a relatively constant dynamic yield stress during the first 30 min.
Figure 6. Flow curves at the material ages of 10 min, 20 min, and 30 min – descending curves fitted by the modified Bingham model of (a) mixtures B45, M45, and H45, (b) mixtures B45 and B45-1; (c) Dynamic yield stress of various mixtures.
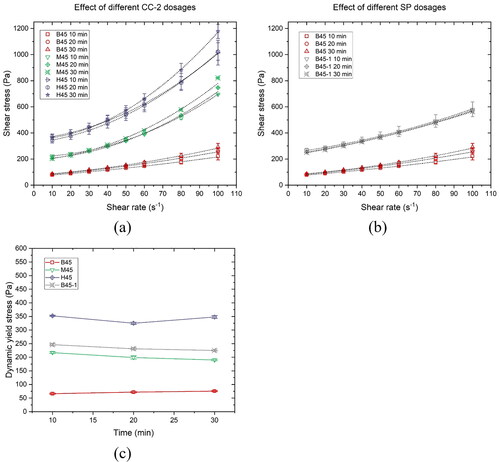
Table 4. Rheological characteristics of different mixtures fitted by the modified Bingham model.
As shown in , the shear stress at the same shear rate and the dynamic yield stress were increased by increasing the proportion of CC-2 in calcined clay at the same age. Compared to mixture B45, mixtures M45 and H45 exhibited a much more significant shear-thickening property with a higher power index (). The shear stress increased with time, especially with a relatively high shear rate (60-100 s−1). The effect of SP dosage on material flow behavior can be found in . A steep increase in the dynamic yield stress was observed by reducing the SP percentage from 0.8 wt.% to 0.6 wt.%. The power index of fitted curves was almost unmodified. For mixture B45-1, there were rare differences in shear stress at different ages.
3.2. Static yield stress evolution
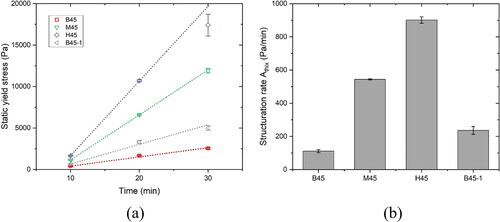
CSR test results of different studied mixtures over the first 30 min are demonstrated in . All shear stress and time curves displayed a similar pattern. The shear stress was enhanced by increasing the applied time of constant shear rate until the stress peak was reached. After the peak, the shear stress in most of curves gradually diminished to a relatively stable value. All peak values in were referred to static yield stresses and plotted in . The structuration rate of static yield stress within the first 30 min can be obtained using the linear model proposed by Roussel [Citation39].
(4)
(4)
where
and Athix denote the initial yield stress prior to rest and the growth rate of static yield stress over time. The structuration rate of different mixtures is presented in . The development of static yield stress within the first 30 min can be significantly boosted by increasing the proportion of CC-2 in calcined clay or decreasing the SP dosage. The enhancement of static yield stress and structuration rate caused by the increase in CC-2 content was more significant than the decrease in SP dosage. Mixture H45 containing the maximum amount of CC-2 showed the highest static yield stress at all ages.
Figure 7. Constant shear rate-single sample test results of (a) mixture B45, (b) mixture B60, (c) mixture B75, (d) mixture M45, (e) mixture H45, (f) mixture 45-1.
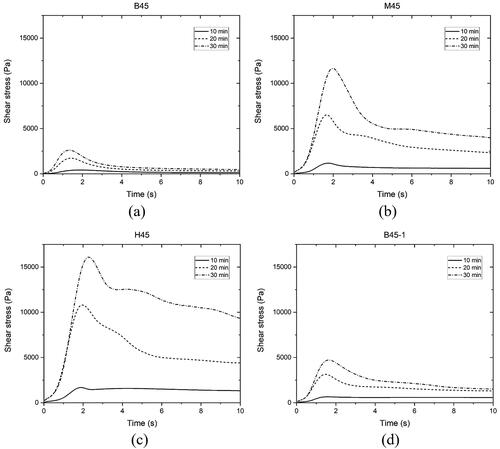
Figure 8. Comparison of static yield stress evolution and structuration rate between mixtures. (a) Static yield stress evolution of different mixtures within the first 30 min; (b) Structuration rate Athix of different mixtures obtained by linear fitting.
3.3. Critical strain and elasticity evolution
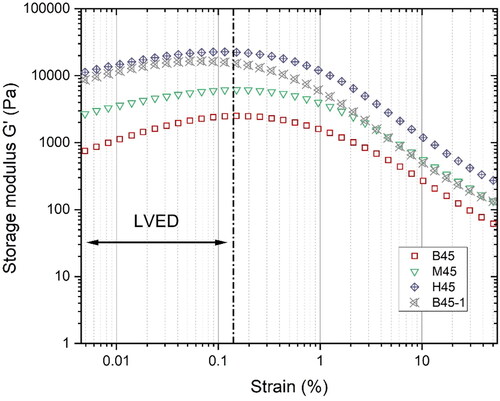
As shown in , the strain sweep response (storage modulus G') of different mixtures included an initial plateau and a decreasing branch due to shearing breakage of microstructure [Citation53]. The initial plateau represents the tested material’s linear viscoelasticity domain (LVED). The end of LVED refers to the critical strain of fresh paste. It can be found that the critical strain was about 0.1% for all studied mixtures. 0.005% strain amplitude apparently is much smaller than the critical strain, which is appropriate for the SAOS-time sweep test.
Figure 9. Amplitude sweep test results at 8 min: the critical strain for different mixtures is about 0.1% at the angular frequency of 1 Hz.
SAOS-time sweep test results, including the evolution of storage modulus G', loss modulus G'', and loss factor during 22-72 min, are reported in . show the G' development over time of different mixtures on linear and logarithmic scales. Within the first 5-20 min, G' approximated a linear growth at a relatively small slope. This process may be attributed to the retarding effect of PCE-based SP on the flocculation of cementitious particles [Citation54–56]. Meanwhile, as shown in , the loss factor of all mixtures increased with time. Such an increase indicated that the growth rate of G'' () was more significant than that of G' due to the released free water (the surface of cementitious particles was covered by PCEs) during the condensation stage [Citation50]. The water consumption rate appears to be less than the free water release rate, resulting in a relatively large volume of liquid-like gel at this stage. This phenomenon was also considered to be the gelation by [Citation50, Citation57]. The peak time of loss factor (tloss) is reported in . Increasing the proportion of CC-2 in calcined clay or decreasing the SP dosage increased G' and reduced tloss, resulting in the acceleration of the particle flocculation. Compared to other mixtures, mixture H45 showed the shortest tloss and maximum G' at this stage.
Figure 10. SAOS-time sweep test results of different mixtures from 22 min to 72 min: (a) Storage modulus G' development with time – linear scale; (b) Storage modulus G' development with time – logarithmic scale; (c) Loss modulus G'' development with time; (d) Loss factor development with time.
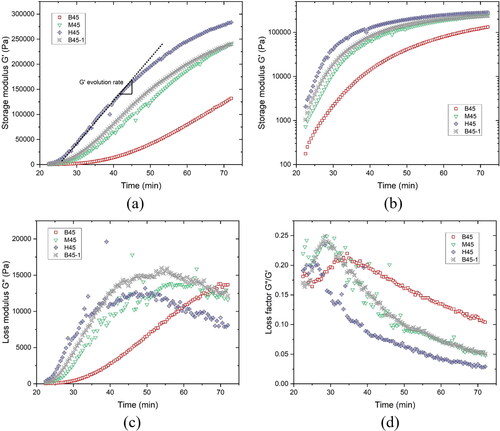
Figure 11. Comparison of peak time of loss factor and G' evolution rate between mixtures. (a) The peak time of loss factor; (b) G' evolution rate of different mixtures.
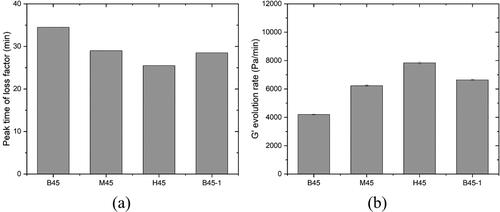
After that, rapid G' growth was observed, which may be related to forming a percolated network induced by flocculation between cementitious particles [Citation34, Citation58]. The slope of this regime was defined as G' evolution rate for indicating the efficiency of flocculation, which was plotted in . G' and its evolution rate were largely increased by increasing CC-2 percentage in calcined clay or reducing the dosage of SP. For all mixtures, the loss factor decreased with time after the peak. The lower the loss factor, the higher the stiffness and rigidity of the fresh mixture. Mixture H45 displayed a much higher G' during the testing period and G' evolution rate as well as the lowest loss factor than other mixtures. Similar loss factor, G' and G' evolution rate were found between mixtures M45 and B45-1. However, G', G'' and loss factor curves for mixtures containing CC-2 fluctuated more than those without CC-2 addition. This may be attributed to the breakage of agglomerated fine calcined clays with the stiffness growing of the overall matrix. CC-2 exhibited the smallest particle size (Dv50=3.75 μm) compared to other binding materials, which naturally increased the possibilities for agglomerating particles. The free water in the system may then seep into the agglomerated particles, or the retained air may be expelled, resulting in a rapid energy loss (increase in G''). After the near-linear development, the increase rate of G' became smaller (except for mixture B45 due to the insufficient testing time). Due to the C-S-H nucleation at the pseudo-contact points between particles, a rigid percolated network seemed to be formed in this regime [Citation34].
The initial setting times of mixtures H45, M45, B45-1 and B45 were 116 min, 227 min, 291 min and 311 min, respectively. The increase of CC-2 content or the decrease of SP dosage shortened the initial setting time, which was in good agreement with test results of static yield stress and SAOS-time sweep. Please note that the growth in G' does not always coincide with the increase in static yield stress and/or stiffness because of different mechanisms [Citation41]. G' is dominated by the C-S-H link, whereas yield stress is the overlapping effect of C-S-H nucleation, colloidal interaction [Citation31], and direct contact (especially for high solid volume fraction). This probably can explain why mixtures B45-1 and M45 showed similar evolution of elasticity (G') and rigidity (loss factor), but significantly different static yield stress development and initial setting time.
3.4. Isothermal calorimetry
shows the normalized heat flow of different mixtures by paste weight. All mixtures exhibited a similar curve pattern of normalized heat flow. Three peaks were observed after the acceleration period, the first of which appeared to be the C3S hydration peak. The following two peaks were attributed to the aluminate reaction [Citation10]. The appearance of aluminate peak was related to the temporary gypsum depletion, possibly caused by the adsorption of sulfate on the surface of C-(A)-S-H and MK (still need to be further confirmed) [Citation13, Citation59]. For mixtures B45, M45, and H45, increasing the CC-2 content in the calcined clay resulted in a decrease in the dormant period, a reduction of time to the C3S hydration peak (), an increase in the slope of the acceleration period (), as well as an increase in the intensity of all three distinct peaks. Such an acceleration of hydration was consistent with the finding from [Citation20]. The enhancement of C3S peak can be linked to the filler effect [Citation5] of fine-grained MK. The intensity of the second aluminate peak in mixtures M45 and H45 was much higher and sharper than that of mixture B45, which may be ascribed to the high amount of reactive aluminate and/or small particle size of CC-2, especially the filler effect induced by the latter, as reported by [Citation13, Citation59]. Compared to mixture B45, mixture B45-1 with a less SP dosage exhibited a shorter time to all hydration peaks and a higher slope of the acceleration period.
Figure 12. Isothermal calorimetry test results: (a) Normalized heat flow by mass of paste with time (48 h); (b) Normalized cumulative heat by mass of paste with time (168 h); (c) The required time to the C3S hydration peak of different mixtures; (d) The slope of the acceleration period of different mixtures.
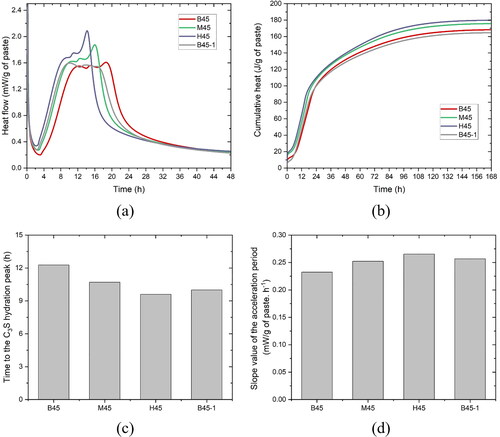
The normalized cumulative heat of different mixtures by paste weight over the first 7 days is illustrated in . Mixture B45 released slightly lower hydration heat within the first 24 h and higher heat after 24 h than mixture B45-1. The higher dosage of SP only delayed the very early-age cement hydration, which agreed with the results obtained by [Citation60]. In addition, for mixtures B45, M45, and H45, the increase in CC-2 content increased the overall cumulative heat for the first 7 days. A higher dissolution heat was observed in mixtures M45 and H45 than in others, which was the leading cause of their relatively high cumulative heat.
4. Discussions
In cementitious materials, the interparticle distance is influenced by physical features of mixture, including water to solid volume ratio (or solid volume fraction), maximal solid volume fraction (also known as maximum packing density), and total specific surface area of solids (SSAtotal). As reported by [Citation61,Citation62], based on these abovementioned factors, the mean interparticle distance () can be computed using EquationEqs (5)
(5)
(5) and Equation(6)
(6)
(6) .
(5)
(5)
(6)
(6)
where dSSA is the average diameter from the specific surface area, and
denotes the solid material density. SSA0 is the total specific surface area of binding materials (m2/g).
and
represent the solid volume fraction and the maximum packing density, respectively. As a similar concept, water film thickness can also be employed to indicate the interparticle distance. According to [Citation63,Citation64], the following equations are applied to calculate the water film thickness (WFT) of studied mixtures:
(7)
(7)
(8)
(8)
(9)
(9)
where
and
stand for the excess water volume fraction, the water to the solid volume ratio, and the void to the solid ratio, respectively. SSA1 is the total specific surface area of binding materials (m2/cm3). As shown in , the solid volume fraction and total specific surface area slightly increased with the increase in CC-2 content.
Table 5. Solid volume fraction, total specific surface area, water film thickness and mean interparticle distance of different mixtures.
For the computation of and WFT,
is a critical but not well-defined parameter since it is significantly influenced by the spatial distribution of particles and flow history [Citation65].
can be obtained experimentally (e.g. wet packing method [Citation66], Puntke test [Citation67] and filter pressing method [Citation68]) or numerically (e.g. packing model [Citation69] and algorithm [71]). In this study, the Puntke test in accordance with [Citation60, Citation67, Citation71,Citation72] was employed to acquire
of studied mixtures. The mixing liquid, including water and SP (see ), was used in the test. Note that the
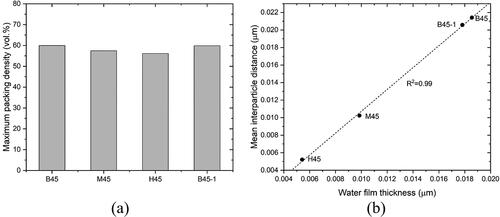
measured by Puntke method may be underestimated, according to [Citation73]. compares the maximum packing density of different studied mixtures acquired via Puntke test. Mixtures B45 and B45-1 had the similar
In contrast,
decreased with increasing the dosage of CC-2, probably due to the increase in plate-like shape of MK particles [Citation74] and/or the decrease in coarse quartz particles. Additionally, a strong linear correlation between
and WFT is observed in , which confirmed the similarity of these two metrics. Also, both metrics were decreased by increasing the CC-2 content or decreasing the SP dosage.
and WFT of mixtures H45 were much smaller than other mixtures.
Figure 13. Comparison of maximum packing density, mean interparticle distance and water film thickness between mixtures. (a) The maximum packing density of studied mixtures; (b) Correlation between mean interparticle distance and water film thickness.
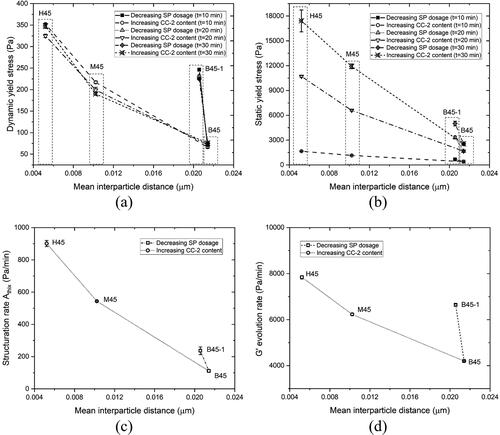
shows the correlation between rheological metrics, including dynamic yield stress fitted by the modified Bingham model (10-30 min), static yield stress (10-30 min), structuration rate Athix (10-30 min), G' evolution rate, and mean interparticle distance. It can be found that all rheological characteristics decreased with increasing the mean interparticle distance. According to Roussel et al. [Citation61], the rheology of fresh cementitious paste in the flow regime is governed by hydrodynamic, colloidal, and contact forces. At the same shear rate, decreasing the mean interparticle distance can enhance colloidal interactions and direct contact [Citation65, Citation75], which increases the shear stress required to maintain the flow (dynamic yield stress). At increasing the shear rate, the shear thickening behavior (power index > 1) of flow curves in is ascribed to the inertial effects and direct contact between particles. The inertial regime [Citation48] appears to be easily reached for the mixtures with a small mean interparticle distance, resulting in a high power index. The static yield stress is related to the energy that is required to break the interaction between particles. Except for the colloidal attraction and direct contact, the interaction force between particles is also influenced by C-S-H bridges [Citation31, Citation35]. As mentioned by [Citation34, Citation58], the G' development after linear growth from SAOS-time sweep test () corresponded to the growth of C-S-H nucleation. As reported by Berodier and Scrivener [Citation76], the shearing between particles is increased, and the path for the diffusion of chemical species seems to be reduced as the interparticle distance diminishes, which contributes to accelerating the nucleation and growth of the hydrates. The authors [Citation76] blended fine limestone/quartz filler with Portland cement to reduce the mean interparticle distance, and they found a higher density of C-S-H nucleation at the particle surfaces in the blended system compared to the plain cement paste. Additionally, Berodier and Scrivener [Citation76] pointed out that the slope of the acceleration period (from isothermal calorimetry) is related to the nucleation and growth of C-S-H. In this study, we also found that the slope of the acceleration period was increased by increasing the content of fine-grained MK (see ). However, it is worth noting that the promotion effect of the addition of fine-grained MK on the nucleation and growth of C-S-H remains to be further verified by microstructure characterization.
Figure 14. The relationship between rheological indicators measured using rheometry and mean interparticle distance. (a) Correlation between dynamic yield stress fitted by the modified Bingham model (at 10 min, 20 min, and 30 min) and mean interparticle distance; (b) Correlation between static yield stress obtained by CSR test (at 10 min, 20 min, and 30 min) and mean interparticle distance; (c) Correlation between structuration rate Athix (10–30 min) and mean interparticle distance; (d) Correlation between G' evolution rate from SAOS-time sweep test and mean interparticle distance.
However, as the mean interparticle distance decreases, the increasing rates of rheological metrics are various for different material parameters (SP dosage and CC-2 content in the calcined clay). Compared to increasing CC-2 content in calcined clay, decreasing 0.2% of SP significantly increases all rheological characteristics without changing the mean interparticle distance. This could indicate the critical role of steric hindrance caused by the PCE-based SP [Citation54,Citation55] on rheology and structural build-up of fresh cementitious pastes. Steric hindrance is governed by the side chains of PCE molecules [Citation77,Citation78]. The attractive force between particles can be significantly reduced by steric hindrance, which promotes particle dispersion but slows down flocculation and nucleation process [Citation55]. The decrease in SP percentage reduces the number of PCE molecules, leading to the reduction of side chain density, which weakens the steric hindrance-induced dispersion of cementitious particles [Citation77] and promotes particle agglomeration. Furthermore, increasing CC-2 content (mixtures M45 and H45) in the calcined clay increased the proportion of very fine particles in the system, which seems to be the leading cause of the decrease in the mean interparticle distance, resulting in the considerable increase in direct contact/friction between particles.
5. Conclusion
This study presented an attempt to control the rheological behaviors and structural build-up of LC3 pastes by modifying the fine-grained MK content of calcined clay. Based on the results and discussions, the main findings can be summarized as follows.
Mixture containing only coarse calcined clay with relatively low MK content maintained a relatively low dynamic yield stress (fitted by the modified Bingham model) for the first 30 min. In contrast, this value increased significantly by increasing the proportion of fine-grained MK. Furthermore, a pronounced shear-thickening behavior of flow curve was observed in the mixtures containing fine-grained MK.
The structural build-up of LC3 paste was promoted by increasing the content of fine-grained MK, i.e., the fast evolution of static yield stress (10-30 min) and storage modulus G′ (22-72 min).
Owing to the small particle size and high SSA, the increase in fine-grained MK content significantly modified the physical characteristics of the binder, including increases in solid volume fraction and total SSA, as well as reductions in particle size, maximum packing density and mean interparticle distance of the binder system. The decrease in mean interparticle distance may dominate the enhancement of colloidal interactions, C-S-H nucleation, and direct contact between particles, which were the main reasons for the weakened flow behavior and improved structural build-up.
Due to the increase in fine-grained MK content, the 1st day hydration was slightly accelerated and enhanced, which may be tied to filler effect induced by the fine-grained MK. Delayed cement hydration was observed with increasing SP dosage.
With the results from this research, we can see that the different material characteristics (especially SSA and particle size) of calcined clay significantly affect the rheology and structural build-up of LC3 pastes.
To implement LC3 in self-compacting concrete, calcined clay with relatively coarse grain size and low MK content seems to be the reasonable candidate from the rheology point of view. Quartz impurities in the calcined clay may help improve flowability.
Calcined clay with fine particle size, high SSA and high MK content may be very beneficial for using LC3 in 3D printable concrete. However, the use of fine-grained MK alone is not applicable, considering the severe sacrifice of flowability. In this case, blending calcined clays with coarse and fine particle sizes is a viable approach. This has been verified in the study of Chen et al. [Citation20].
Additional information
Funding
References
- Juenger MCG, Winnefeld F, Provis JL, et al. Advances in alternative cementitious binders. Cem Concr Res. 2011;41(12):1232–1243.
- Muzenda TR, Hou P, Kawashima S, et al. The role of limestone and calcined clay on the rheological properties of LC3. Cem Concr Compos. 2020;107:103516.
- Nair N, Mohammed Haneefa K, Santhanam M, et al. A study on fresh properties of limestone calcined clay blended cementitious systems. Constr Build Mater. 2020;254:119326.
- Snellings R. Assessing, understanding and unlocking supplementary cementitious materials. RILEM Tech Lett. 2016;1:50–55.
- Lothenbach B, Scrivener K, Hooton RD. Supplementary cementitious materials. Cem Concr Res. 2011;41(12):1244–1256.
- Scrivener K, Martirena F, Bishnoi S, et al. Calcined clay limestone cements (LC3). Cem Concr Res. 2018;114:49–56.
- Sharma M, Bishnoi S, Martirena F, et al. Limestone calcined clay cement and concrete: a state-of-the-art review. Cem Concr Res. 2021;149:106564.
- Antoni M, Rossen J, Martirena F, et al. Cement substitution by a combination of metakaolin and limestone. Cem Concr Res. 2012;42(12):1579–1589.
- Dhandapani Y, Santhanam M. Assessment of pore structure evolution in the limestone calcined clay cementitious system and its implications for performance. Cem Concr Compos. 2017;84:36–47.
- Hay R, Li L, Celik K. Shrinkage, hydration, and strength development of limestone calcined clay cement (LC3) with different sulfation levels. Cem Concr Compos. 2022;127:104403.
- Sánchez Berriel S, Favier A, Rosa Domínguez E, et al. Assessing the environmental and economic potential of limestone calcined clay cement in Cuba. J Clean Prod. 2016;124:361–369.
- Sui H, Hou P, Liu Y, et al. Limestone calcined clay cement: mechanical properties, crystallography, and microstructure development. J Sustain Cem Mater. 2022;11:1–14.
- Zunino F, Scrivener K. The influence of the filler effect on the sulfate requirement of blended cements. Cem Concr Res. 2019;126:105918.
- Avet F, Li X, Scrivener K. Determination of the amount of reacted metakaolin in calcined clay blends. Cem Concr Res. 2018;106:40–48.
- Avet F, Boehm-Courjault E, Scrivener K. Investigation of C-A-S-H composition, morphology and density in limestone calcined clay cement (LC3). Cem Concr Res. 2019;115:70–79.
- Bernal IMR, Aranda MAG, Santacruz I, et al. Early-age reactivity of calcined kaolinitic clays in LC3 cements: a multitechnique investigation including pair distribution function analysis. J Sustain Cem Mater. 2022;11:1–15.
- Chen Y, He S, Gan Y, et al. A review of printing strategies, sustainable cementitious materials and characterization methods in the context of extrusion-based 3D concrete printing. J Build Eng. 2022;45:103599.
- Alujas A, Fernández R, Quintana R, et al. Pozzolanic reactivity of low grade kaolinitic clays: influence of calcination temperature and impact of calcination products on OPC hydration. Appl. Clay Sci. 2015;108:94–101.
- Avet F, Snellings R, Alujas Diaz A, et al. Development of a new rapid, relevant and reliable (R3) test method to evaluate the pozzolanic reactivity of calcined kaolinitic clays. Cem Concr Res. 2016;85:1–11.
- Chen Y, Rodriguez CR, Li Z, et al. Effect of different grade levels of calcined clays on fresh and hardened properties of ternary-blended cementitious materials for 3D printing. Cem Concr Compos. 2020;114:103708.
- Paiva H, Velosa A, Cachim P, et al. Effect of metakaolin dispersion on the fresh and hardened state properties of concrete. Cem Concr Res. 2012;42(4):607–612.
- Bhattacherjee S, Basavaraj AS, Rahul AV, et al. Sustainable materials for 3D concrete printing. Cem Concr Compos. 2021;122:104156.
- Ferreiro S, Herfort D, Damtoft JS. Effect of raw clay type, fineness, water-to-cement ratio and fly ash addition on workability and strength performance of calcined clay – limestone Portland cements. Cem Concr Res. 2017;101:1–12.
- Sposito R, Maier M, Beuntner N, et al. Physical and mineralogical properties of calcined common clays as SCM and their impact on flow resistance and demand for superplasticizer. Cem Concr Res. 2022;154:106743.
- Cassagnabère F, Diederich P, Mouret M, et al. Impact of metakaolin characteristics on the rheological properties of mortar in the fresh state. Cem Concr Compos. 2013;37:95–107.
- Beigh MAB, Nerella VN, Schröfl C, et al. Studying the rheological behavior of limestone calcined clay cement (LC3) mixtures in the context of extrusion-based 3D-printing, in: 3rd Int. Conf. Calcined Clays Sustain. Concr. Delhi; 2019. pp. 1–8. https://www.researchgate.net/publication/336616922_Studying_the_rheological_behavior_of_limestone_calcined_clay_cement_LC_mixtures_in_the_context_of_extrusion-_based_3D-printing.
- Kandagaddala RK, Nanthagopalan P. Rheological characterization of cementitious suspensions with limestone calcined clay for pumping applications. J Mater Civ Eng. 2022;34(8):1–11.
- Ez-Zaki H, Marangu JM, Bellotto M, et al. A fresh view on limestone calcined clay cement (LC3) pastes. Materials (Basel). 2021;14(11):3037.
- Zhang C, Jia Z, Luo Z, et al. Printability and pore structure of 3D printing low carbon concrete using recycled clay brick powder with various particle features. J Sustain Cem Mater. 2022;11:1–10.
- Boddepalli U, Panda B, Ranjani Gandhi IS. Rheology and printability of Portland cement based materials: a review. J Sustain Cem Mater. 2022;11:1–19.
- Roussel N, Bessaies-Bey H, Kawashima S, et al. Recent advances on yield stress and elasticity of fresh cement-based materials. Cem Concr Res. 2019;124:105798.
- Mahaut F, Mokéddem S, Chateau X, et al. Effect of coarse particle volume fraction on the yield stress and thixotropy of cementitious materials. Cem Concr Res. 2008;38(11):1276–1285.
- Perrot A, Lecompte T, Estellé P, et al. Structural build-up of rigid fiber reinforced cement-based materials. Mater Struct. 2013;46(9):1561–1568.
- Roussel N, Ovarlez G, Garrault S, et al. The origins of thixotropy of fresh cement pastes. Cem Concr Res. 2012;42(1):148–157.
- Qian Y, Kawashima S. Distinguishing dynamic and static yield stress of fresh cement mortars through thixotropy. Cem Concr Compos. 2018;86:288–296.
- Qian Y, Kawashima S. Use of creep recovery protocol to measure static yield stress and structural rebuilding of fresh cement pastes. Cem Concr Res. 2016;90:73–79.
- Struble LJ, Schultz MA. Using creep and recovery to study flow behavior of fresh cement paste. Cem Concr Res. 1993;23(6):1369–1379.
- Beigh MAB, Nerella VN, Schröfl C, et al. Studying the Rheological Behavior of Limestone Calcined Clay Cement (LC 3) Mixtures in the Context of Extrusion-Based 3D-Printing. In Calcined clays for sustainable concrete (pp. 229-236). Springer, Singapore. Calcined clays for sustainable concrete. 2010;25:229–236. Springer, Singapore.
- Roussel N. A thixotropy model for fresh fluid concretes: theory, validation and applications. Cem Concr Res. 2006;36(10):1797–1806.
- Roussel N. Rheological requirements for printable concretes. Cem Concr Res. 2018;112:76–85.
- Ma S, Qian Y, Kawashima S. Experimental and modeling study on the non-linear structural build-up of fresh cement pastes incorporating viscosity modifying admixtures. Cem Concr Res. 2018;108:1–9.
- Yuan Q, Zhou D, Khayat KH, et al. On the measurement of evolution of structural build-up of cement paste with time by static yield stress test vs. small amplitude oscillatory shear test. Cem Concr Res. 2017;99:183–189.
- Jiao D, El Cheikh K, Shi C, et al. Structural build-up of cementitious paste with nano-Fe3O4 under time-varying magnetic fields. Cem Concr Res. 2019;124:105857.
- Moeini MA, Hosseinpoor M, Yahia A. Effectiveness of the rheometric methods to evaluate the build-up of cementitious mortars used for 3D printing. Constr Build Mater. 2020;257:119551.
- Khayat KH, Meng W, Vallurupalli K, et al. Rheological properties of ultra-high-performance concrete — an overview. Cem Concr Res. 2019;124:105828.
- Feys D, Wallevik JE, Yahia A, et al. Extension of the Reiner-Riwlin equation to determine modified Bingham parameters measured in coaxial cylinders rheometers. Mater Struct. 2013;46(1–2):289–311.
- Nerella VN, Beigh MAB, Fataei S, et al. Strain-based approach for measuring structural build-up of cement pastes in the context of digital construction. Cem Concr Res. 2019;115:530–544.
- Ivanova I, Mechtcherine V. Possibilities and challenges of constant shear rate test for evaluation of structural build-up rate of cementitious materials. Cem Concr Res. 2020;130:105974.
- Mezger TG. The rheology handbook. 4th ed. Emerald Group Publishing Limited; Hanover, Germany. 2009.
- Dai X, Aydın S, Yardımcı MY, et al. Effects of activator properties and GGBFS/FA ratio on the structural build-up and rheology of AAC. Cem Concr Res. 2020;138:106253.
- Dai X, Aydin S, Yücel Yardimci M, et al. Rheology, early-age hydration and microstructure of alkali-activated GGBFS-Fly ash-limestone mixtures. Cem Concr Compos. 2021;124:104244.
- NEN-EN 196-3. Methods of testing cement. Determination of setting times and soundness, NEN; 2016. 18. https://shop.bsigroup.com.
- Mostafa AM, Diederich P, Yahia A. Effectiveness of rotational shear in dispersing concentrated cement suspensions. J Sustain Cem Mater. 2015;4:205–214.
- Gelardi G, Flatt RJ. Working mechanisms of water reducers and superplasticizers. Elsevier Ltd; Cambridge, UK. 2015.
- Marchon D, Kawashima S, Bessaies-Bey H, et al. Hydration and rheology control of concrete for digital fabrication: potential admixtures and cement chemistry. Cem Concr Res. 2018;112:96–110.
- Marchon D, Flatt RJ. Impact of chemical admixtures on cement hydration. Elsevier Ltd, Cambridge, UK. 2015.
- Steins P, Poulesquen A, Diat O, et al. Structural evolution during geopolymerization from an early age to consolidated material. Langmuir. 2012;28(22):8502–8510.
- Gauffinet-Garrault S. The rheology of cement during setting, in: underst. Rheol. Concr., Elsevier; Cambridge, UK. 2012; p. 96–113.
- Zunino F, Scrivener K. Insights on the role of alumina content and the filler effect on the sulfate requirement of PC and blended cements. Cem Concr Res. 2022;160:106929.
- Chen Y, He S, Zhang Y, et al. 3D printing of calcined clay-limestone-based cementitious materials. Cem Concr Res. 2021;149:106553.
- Roussel N, Lemaître A, Flatt RJ, et al. Steady state flow of cement suspensions: a micromechanical state of the art. Cem Concr Res. 2010;40:77–84.
- De Larrard F. Concrete mixture proportioning: a scientific approach. London: CRC Press; 2005.
- Fung WWS, Kwan AKH. Role of water film thickness in rheology of CSF mortar. Cem Concr Compos. 2010;32:255–264.
- Li LG, Chen XQ, Chu SH, et al. Seawater cement paste: effects of seawater and roles of water film thickness and superplasticizer dosage. Constr Build Mater. 2019;229:116862.
- Coussot P. Introduction to the rheology of complex fluids. Woodhead Publishing; Cambridge, UK. 2011.
- Wong HHC, Kwan AKH. Packing density of cementitious materials: part 1-measurement using a wet packing method. Mater Struct Constr. 2008;41:689–701.
- Puntke W. Wasseranspruch von feinen kornhaufwerken. Beton. 2002;52:242–248.
- Kjeldsen AM, Flatt RJ, Bergström L. Relating the molecular structure of comb-type superplasticizers to the compression rheology of MgO suspensions. Cem Concr Res. 2006;36:1231–1239.
- Hu C, de Larrard F. The rheology of fresh high-performance concrete. Cem Concr Res. 1996;26:283–294.
- Vance K, Kumar A, Sant G, et al. The rheological properties of ternary binders containing Portland cement, limestone, and metakaolin or fly ash. Cem Concr Res. 2013;52:196–207.
- Nanthagopalan P, Haist M, Santhanam M, et al. Investigation on the influence of granular packing on the flow properties of cementitious suspensions. Cem Concr Compos. 2008;30:763–768.
- Rahul AV, Sharma A, Santhanam M. A desorptivity-based approach for the assessment of phase separation during extrusion of cementitious materials. Cem Concr Compos. 2020;108:103546.
- Hunger M, Brouwers HJH. Flow analysis of water-powder mixtures: application to specific surface area and shape factor. Cem Concr Compos. 2009;31:39–59.
- Favier A, Hot J, Habert G, et al. Flow properties of MK-based geopolymer pastes. A comparative study with standard Portland cement pastes. Soft Matter. 2014;10(8):1134–1141.
- Perrot A, Lecompte T, Khelifi H, et al. Yield stress and bleeding of fresh cement pastes. Cem Concr Res. 2012;42:937–944.
- Berodier E, Scrivener K. Understanding the filler effect on the nucleation and growth of C-S-H. J Am Ceram Soc. 2014;97:3764–3773.
- Ma Y, Sha S, Zhou B, et al. Adsorption and dispersion capability of polycarboxylate-based superplasticizers: a review. J Sustain Cem Mater. 2022;11:319–344.
- Plank J, Yang F, Storcheva O. Study of the interaction between cement phases and polycarboxylate superplasticizers possessing silyl functionalities. J Sustain Cem Mater. 2014;3:77–87.
- Zhang Y, Schlangen E, Çopuroğlu O. Effect of slags of different origins and the role of sulfur in slag on the hydration characteristics of cement-slag systems. Constr Build Mater. 2022;316:125266.
Appendix
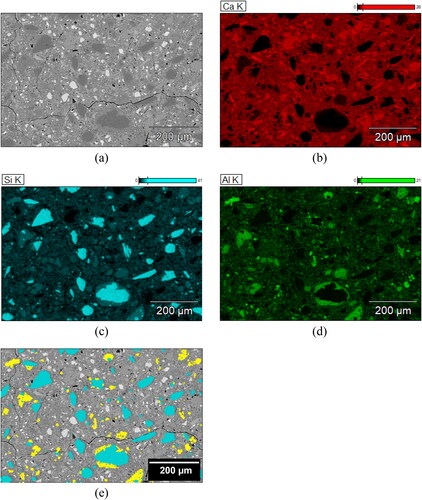
shows the ESEM-EDS elemental mapping analysis of the 28-day B45 sample. The sample was prepared according to the procedure described in [Citation79]. It can be found that quartz impurities sourced from CC-1 displayed a much coarser grain size than other phases.
Figure A1. ESEM-EDS elemental mapping analysis of 28-day B45 sample; (a) BSE micrograph; (b) Elemental mapping image of Ca (calcium); (c) Elemental mapping image of Si (silicon); (d) Elemental mapping image of Al (aluminum); (e) Overlay masks of quartz (Cyan) and metakaolin (Yellow) particles determined using Compass + XPhase on Pathfinder X-ray Microanalysis Software (Thermo Fisher Scientific).
The rheological characteristics of studied mixtures that were obtained by fitting the Herschel-Bulkley model were reported in .
Table A1. Rheological characteristics of different mixtures fitted by the Herschel-Bulkley model.