
Abstract
Composite materials are often made by infiltration, that is, by injecting a liquid matrix between packed solid fibers or particles. We give here direct proof that molten copper, slowly infiltrated into a broad spectrum of preforms, displays in initial phases of the process universal scaling and fractal geometric features that are characteristic signatures of percolation-dominated flow. Implications are that the microstructure of infiltrated composite materials can develop over length scales that far exceed the average preform pore size, and that network models are pertinent in the simulation of composite infiltration processing.
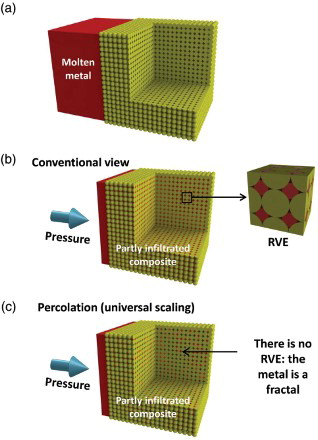
Many modern composite materials are made by infiltrating a liquid matrix of polymer, metal or ceramic into a solid porous ‘preform’ of reinforcing fibers, whiskers or particles; electric vehicle chassis structures,[Citation1] windmill blades [Citation2] and electronic substrates [Citation3] are examples. To eliminate porosity in the final material and to speed the process, pressure is often applied on the infiltrating liquid ((a) and 1(b)). Applying pressure is particularly important when the matrix is metallic because metals seldom wet nonmetallic solids typically used as reinforcements;[Citation4] metal meniscuses within the preform are then concave toward the metal, and this creates a back pressure P resisting infiltration.[Citation5,Citation6] With metals P is high: reinforcements are typically micrometric and metal surface tensions are on the order of one joule per square meter, such that P easily exceeds ten atmospheres. Capillarity is thus particularly manifest in metal matrix composite infiltration.
Figure 1. Different views of pressure infiltration. (a) Sketch of metal matrix composite pressure infiltration. (b) In conventional modeling, the process is simulated by integrating local flow laws over a representative volume element (RVE), which is then used as a differential element in a continuum-based simulation of the process across the composite part to be produced. (c) Infiltration as governed by percolation: the metal structure is fractal, invalidating the RVE approach.
The science underlying capillarity in infiltration is very rich: the complex physics of two-phase flow within porous media have generated a considerable body of knowledge, from which our understanding of composite infiltration processing can draw. To describe the range of pressures P required to force a poorly wetting fluid into a porous body, the well-established semi-empirical relation of Brooks and Corey [Citation6–8] proposes that, when capillary forces and P are equilibrated, the following relation holds:
The Brooks and Corey correlation has repeatedly been shown to agree with the experiment, in soil science, in petroleum extraction and also in composite materials processing.[Citation6,Citation8,Citation9] It is currently used, together with an alternative but closely related relation by van Genuchten,[Citation10] in advanced modeling of composite infiltration processing. In such models, it is typically coupled with continuum transport equations written over representative volume elements (RVEs) encompassing one or a few representative pores [Citation11]; gives a recent example and (b) illustrates this approach.
There is, however, a radically different view of infiltration, which has so far been essentially ignored in composite materials processing: infiltration is an archetypical percolation phenomenon.[Citation12–14] Recent summaries of the immense literature on the subject that are specifically focused on two-phase fluid flow through porous media are in Refs. [Citation6,Citation15]. To be specific, infiltration is a variant of percolation known as ‘invasion percolation’: to be infiltrated with a metal, a pore must not just be ‘open’ (e.g. conductive in conduction percolation or big enough in the present context); it must also be connected to a stringer of other open pores that extends from the pore in question to the specific location(s) where liquid is fed into the preform.[Citation14,Citation16,Citation17] Invasion percolation in turn comes in several variants. When the infiltrant displaces a liquid, motion of the former around the latter creates isolated blobs of (the displaced, wetting) liquid, which can remain trapped within the porous medium. If, on the other hand, the porous medium is initially evacuated, there is no trapping. Invasion percolation then falls in the same universality class and shows similar spanning cluster fractal characteristics as in ordinary percolation.[Citation6,Citation15,Citation18–20]
This leads to anticipate that universal laws of percolation might govern early phases of the metal pressure infiltration process. Here, we make this connection by giving direct experimental proof that percolation and its manifestations do, indeed, govern the composite pressure infiltration process in its initial phases, as sketched in (c). At the same time, we give here one of the clearest extant direct experimental demonstrations of percolation effects in porous media capillarity.
We have designed an apparatus that measures with unique precision capillary forces in metal pressure infiltration under conditions representative of ‘real’ engineering materials processing. It uses induction heating to melt metal over a porous preform, both being held within an impervious and chemically inert ceramic crucible placed inside an evacuated pressure chamber. Once it is molten, the metal seals the preform from gas in the pressure chamber. The liquid metal can then be pushed into the preform by letting pressurized argon into the closed chamber. Our apparatus is special in that it can measure dynamically the volume of metal displaced [Citation9,Citation21]: as such, it can in fact be viewed as a (very) high-temperature analogue to the mercury porosimeter.[Citation6,Citation22] We achieve this using a floater connected to a rod, the upper end of which exhibits a set of marks, which are visible through a window in the pressure chamber. Movement of the marks is then tracked by a camera. We can work at temperatures up to roughly 1,500 K under applied pressures up to 20 MPa (200 bar); this is the range typical of engineering metal composite processing. Noteworthy features of this apparatus are (i) its precision (±10 μm) in tracking dynamically the position of the metal surface above the preform and hence of the metal volume having flown into the preform and (ii) its ability to hold molten metals such as copper at constant (high) temperature and fixed (high) pressure over extended periods of time (hours). A detailed description of the apparatus and its use is given in the Supplementary Online Material.
Precision and stability combined are critical, because P can only be equated with the applied gas pressure if flow of the metal has essentially stopped. Indeed, percolation as described in what precedes is for the ideal case where there are no pressure gradients within the invading liquid and no extraneous destabilizing effects.
If pressure gradients are significant, invasion percolation becomes a variant of what is known as ‘gradient percolation’ [Citation6,Citation16]: pore filling statistics are then no longer spatially uniform across the preform, and this complicates the problem. Pressure gradients in the liquid arise due to viscous friction; this becomes important if the capillary number, Ca, equals the fluid velocity times its viscosity divided by its surface tension, exceeds unity.[Citation6,Citation23,Citation24] In our experiments, we hold the pressure constant and wait for the fluid to stabilize: as a result, pores fill gradually while Ca falls to a value well below 10−4, reaching at times 10−8; this causes the course of infiltration to be dominated by capillarity.[Citation6,Citation21,Citation23,Citation25] Gravity also creates pressure gradients within the fluid. These exert an influence if the Bond number, Bo, exceeds unity; Bo is by definition the fluid density times the gravitational constant g times the typical pore diameter squared divided by the liquid surface tension.[Citation6] Here, pores are micrometric and pressures are many atmospheres. Hence, Bo is well below 10−3 and gravity effects are far weaker than capillary forces, despite the high density of liquid copper.
Another potential source of complexity has to do with the mechanics of fluid transport. Viscous fingering is an instability that appears in infiltration if the ratio of infiltrating to displaced fluid viscosity, M, is less than unity [Citation6,Citation23,Citation24]: here, M is nearly infinite, so there is no viscous fingering. Also, since wetting angles are large and the metal partial pressure can be neglected, infiltration in present experiments is free of complications observed with a wetting or evaporating liquid, such as pre-wetting film formation or liquid flowing along asperities on the solid.[Citation24] And finally, there is no trapping, and samples of this work are sufficiently large in comparison with the average pore size for finite-size scaling or edge effects to be negligible (these are felt when the sample is on the order of 40 particles across or less [Citation5,Citation6,Citation25,Citation26]).
Summing up, while quite challenging experimentally given the high temperature and high pressures involved, pressure infiltration experiments of this work are not only precise explorations of composite processing; they are also particularly clean and rich experimental embodiments of invasion percolation. Earlier experiments of this type, using for example Wood's metal or mercury, were either affected by gravity, or did not freeze the invading fluid to allow its detailed observation.[Citation13,Citation25,Citation27–31]
We have infiltrated pure molten copper at rates sufficiently slow for pressure gradients to be negligible at 1,423 K into a range of different preforms. These are listed in and described in detail in the Supplementary Online Material. Preforms investigated here comprise (i) packed alumina particle preforms, with particles of various origins and hence of diverse shapes and/or sizes (comminuted F320 or F1000, vapor-grown AA18 and atomized spheres; at low oxygen partial pressures the contact angle of Cu on at 1,423 K is in the range 120–130° [Citation4]), together with (ii) preforms of pressed (Saffil™) alumina short fibers and (iii) microporous graphite (at low oxygen partial pressures, the contact angle of Cu on carbon at 1,423 K is in the range 140–150° [Citation4]). (a) shows the microstructure of fully infiltrated composites together with the associated ‘drainage’ curves ((b)) that plot S as a function of P. The latter resemble other primary drainage curves found in the literature: invasion of the preform starts at an identifiable threshold pressure Pc, then progresses rapidly as P increases further, to then gradually approach full saturation (S=1) in an essentially asymptotic fashion. Typical cross sections through infiltrated samples at low metal saturation are shown in (a). Note how, at pressures situated just above the threshold, holes within the metal are much larger than individual preform pores, particles or fibers. This is a sign that pore connectivity plays a role, suggesting in turn that percolation effects might intervene in early phases of pressure infiltration. To show this, we confront the drainage curves, and samples frozen during early phases of infiltration, with predictions of percolation theory.
Figure 2. Fully infiltrated samples. (a) Microstructure in each composite investigated here after full infiltration (S=1). (b) Measured drainage curves for each system.
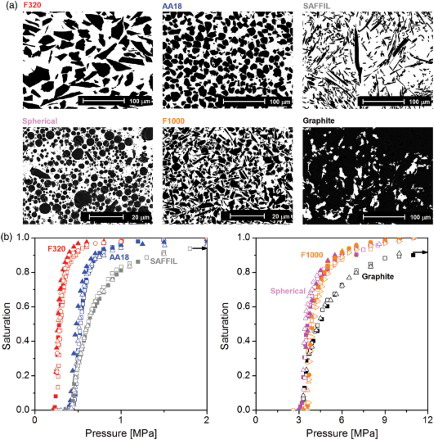
Figure 3. Partially infiltrated samples. (a) Low-magnification (left) and high-magnification (right) view of the microstructure of each composite system, taken at low saturation (S<0.5). (b) Measured drainage curves for each system, plotted to test Equation (1). Average sample saturation for both lower and higher magnification micrographs is 0.1 for Saffil™ short fibers, 0.2 for all other systems.
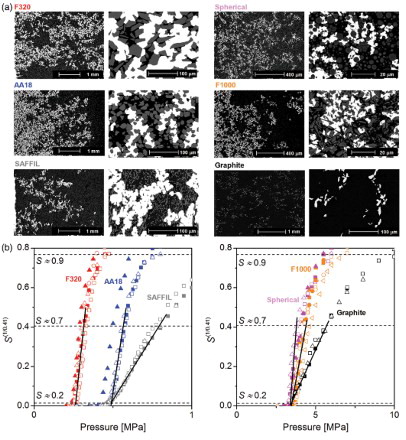
Table 1. Solid preforms explored in this work (nature, volume fraction solid and density of the solid) together with measured infiltration characteristics (approximate value of the pressure Pmax required to fully infiltrate the preform, constants Pc and C in the scaling law describing initial stages of infiltration, Equation (3); constants λ and Pb of the Brooks and Corey relation, Equation (1)).
As mentioned above, invasion percolation without trapping falls in the same universality class and displays similar infinite cluster characteristics as ordinary percolation.[Citation6,Citation15,Citation18–20,Citation32] The fraction F of bonds or sites that belong to the infinite percolation cluster then scales with the probability, p, that a pore be open to invasion by the metal, according to the scaling law
(b) replots drainage curves of (b) in coordinates that will show, with a straight line, whether drainage curve data collected for the range of systems in agree with Equation (3) for P≥Pc. As seen, within uncertainty, our data indeed do follow straight lines near Pc, proving that Equation (3) is obeyed regardless of the preform. The range of saturations over which the universal scaling law in Equation (3) holds varies with the preform; in some systems it stretches all the way to S=0.75, (b).
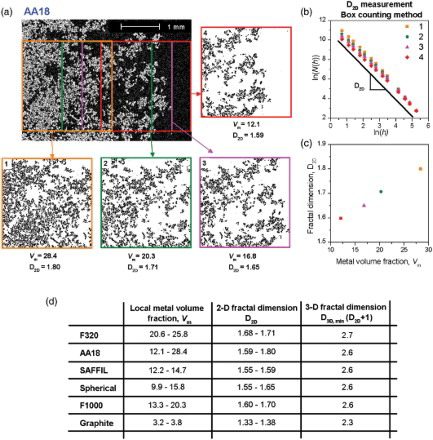
Percolation theory also predicts that, just past the percolation threshold, the cluster of invaded pores is a fractal of dimension D=2.53.[Citation14,Citation16,Citation34] We have applied standard fractal dimension measurement methods [Citation28–31] on two-dimensional (2-D) metallographic cuts through frozen composites at low saturation to measure the 2-D fractal dimension, D2D, of the solidified metal ‘tree’ formed after partial infiltration when P is just past Pc; (a)–(c) illustrates the procedure with an example (a detailed description of the measurements is in the Supplementary Online Material). Results for D2D, and for corresponding 3-D metal cluster fractal dimensions , are collected in (d). As seen, the metal structure is indeed fractal, since measured D2D values are well below 2. The metal cluster fractal dimension increases slightly with the fraction metal and is, for low S values, near that predicted by percolation theory ((b) and 4(c)). Microstructures of partially infiltrated composites confirm that first phases of metal pressure infiltration are governed by percolation.
Figure 4. Measuring the metal fractal dimension in partly infiltrated composites. (a) Backscattered scanning electron image of a partially infiltrated composite (AA18/Cu at P=0.46 MPa). The colored squares (768×768 pixels) indicate the area used to measure the fractal dimension using the box counting method (‘ImageJ’ function: ‘Fractal box counter’, size of the boxes: 2, 3, 4, 6, 8, 12, 16, 24, 32, 48, 64, 96, 128 and 192 pixels) and the corresponding thresholded images (in which the metal is turned black and the rest white). (b and c): evolution of the measured two-dimensional fractal dimension D2D computed from the average slope through the range of data (b), showing (c) that it tends to increase somewhat with increasing metal volume fraction Vm (which in turn increases from the preform center to its outer surface in contact with the metal bath); (d): range of variation of D2D with corresponding range for Vm, and final estimated value of D=(D2D+1), the 3-D fractal dimension of the metal cluster in the most porous (central preform) region for each of the composite systems investigated.
At higher pressures data deviate from universal scaling: there is a crossover to another regime. Replotting the data in (b) so as to test the Brooks and Corey relation, (a), shows that at higher saturation Equation (1) is well obeyed, while at lower saturation Equation (3) is obeyed, (b) and 5(b) (where universal scaling is shown with a more usual log–log plot). What this means from a physical standpoint is that there is a crossover from a dominance of throat size distribution statistics in the early phases of infiltration, to a dominance of the average pore size and shape in later phases of the metal pressure infiltration process. Percolation theory also predicts this crossover. Indeed, network models of bond-governed percolation evidence a stage, well past the percolation threshold but also well before full saturation, at which the percolation cluster fattens to the point where it contacts essentially all remaining uninfiltrated pores; with Z=4, this happens near p=0.63,[Citation5,Citation12,Citation38,Citation39] that is, well above .[Citation6,Citation14,Citation34] Past that point infiltration is entirely dictated by the local geometry of each throat and pore in the preform, with essentially no role played by pore connectivity since all empty pores are now accessible to metal. In the literature, this crossover appears in a few simulations of drainage, where effects of connectivity (and hence percolation) are combined with a multiscale, fractal-like, description of the internal porous medium architecture ( of [Citation40], (c) and 5(d) of [Citation41]). In [Citation15,Citation42] a similar crossover is invoked in connection with predictions of conductivity or global fluid permeability in unsaturated porous media.
Figure 5. Confrontation of data with Equations (1) and (3) using logarithmic coordinates. Measured drainage curves for all systems explored here ((b)) replotted in logarithmic coordinates to test (a) Equation (3), and (b) Equation (1) (using values of Pc obtained by extrapolation of a linear regression of S(1/0.41) over the range 0.02≤S(1/0.41)≤0.35, corresponding to 0.2≤S≤0.65). Note that portions of the curves in these log-log coordinates are affected in (a) near S=1 by uncertainty in the pore volume (hence data are only plotted up to S=0.9) and in (b) near S=0 by uncertainty in Pc (this does not affect the comparison if data are plotted as in (b)).
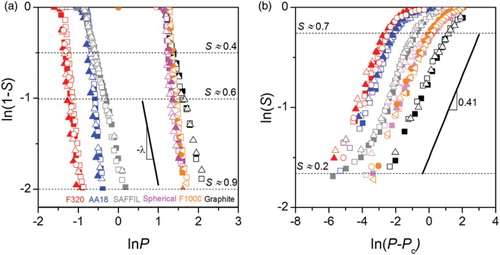
Though its existence thus emerges from theory, predicting the crossover location remains a challenge as there are, to our knowledge, no established schemes to predict constant C in Equation (3) for ‘real’ engineering preforms such as those used here.[Citation15,Citation42] To this question, the present data contribute the observation that the crossover is surprisingly gradual in preforms of the type explored here. Indeed both laws, the universal scaling law expected from percolation theory (Equation (3)) and the Brooks–Corey relation (Equation (1)), are simultaneously obeyed by the data over a wide range, which extends (with variations from preform to preform) roughly from S=0.2 to S=0.7, see (b) and 5.
Data of this investigation are also interesting as concerns the second, high S, range of infiltration pressures. It is now well established that Equation (1) emerges if one assumes that pore sizes are distributed according to a scaling law, or in other words if one assumes that solid elements in the porous medium, or their surface topography, have a fractal geometry; λ then equals three minus the relevant fractal dimension D.[Citation6,Citation15,Citation43–47] For this reason, power-law saturation expressions such as the Brooks–Corey relation are often called ‘fractal’ saturation laws; however, the link is neither simple nor univalent.[Citation44] Here, such ‘fractal’ saturation scaling is observed with short fibers that were spun to a nominally single diameter. In addition, some of the observed λ values also fall sufficiently far above 3, , that λ cannot equal 3-D. Both observations are at variance with fractal pore models, suggesting in turn that power-law saturation scaling relations such as Equation (1) can have their origin elsewhere.
In summary, we have evidenced that slowly driven copper pressure infiltration is governed by percolation in its initial phases: metal ingress obeys universal scaling laws and the metal first forms a percolation cluster that has the expected fractal characteristics. As such, the present data provide one of the cleanest extant experimental illustrations of the predictions of percolation theory in the context of flow through porous media. The saturation law then crosses over to the Brooks–Corey saturation relation, with both laws valid over roughly half the range of saturations. Present findings have implications concerning fluid flow in materials processing: in initial phases of the infiltration process, universal scaling and fractal geometry govern capillarity, and likely also basic flow parameters such as the relative permeability. Statistics of pore-to-pore connections are then important, such that averaging over a RVE encompassing only a few pores ((b)) will go amiss of important features of the infiltration process ((c)). The role played by percolation in early phases of infiltration also has implications beyond fluid flow: it will influence heat transfer, and if there are chemical reactions between the metal and the reinforcement, then pore connectivity statistics will influence their rate and the geometrical distribution of reaction products or solute within the final composite (one of the few papers in the literature addressing percolation effects in composite infiltration processing examines this last effect [Citation39]). And finally, implications of the present findings go beyond the processing of composites: an example is with metal ingress into refractories during primary metal production (e.g. in a blast furnace); here too percolation effects are likely to have considerable importance.
Supplementary Online Material
A more detailed information on experiments is available at http://dx.doi.org/10.1080/21663831.2014.948692.
Supplementary material
Download MS Word (5.7 MB)Acknowledgements
This work was sponsored by the Swiss National Science Foundation, Project No. 200020-137685.
We gratefully acknowledge Mr Willy Dufour, Mr Raphaël Charvet, Mr Cyril Dénéréaz, Mr Claudio Bacciarini and Dr Noelia Rojo Calderon for their contributions in designing, building and perfecting the infiltration apparatus used in this work.
References
- Birch S. SAE automotive engineering on-line; ‘BMW i3, the inside story: what it's made of, how it's made’ [cited 2013 May 9, last accessed July 2014]. Available from: http://www.sae.org/mags/aei/12056/.
- Brøndsted P, Lilholt H, Lystrup A. Composite materials for wind power turbine blades. Annu Rev Mater Res. 2005;35:505–538. doi: 10.1146/annurev.matsci.35.100303.110641
- CPSTechnologies. Reliability with smart composite products. 2012 [Cited 2014 July]. Available from: http://www.alsic.com/
- Eustathopoulos N, Nicholas MG, Drevet B. Wettability at high temperature. Amsterdam: Pergamon-Elsevier Science; 1999.
- Dullien FAL. Porous media, fluid transport and pore structure. 2nd ed. New York (NY): Academic Press Inc., Harcourt Brace Jovanovich Publishers, San Diego, USA; 1992.
- Sahimi M. Flow and transport in porous media and fractured rock – from classical methods to modern approaches. 2nd, Revised and Enlarged Edition. Weinheim: Wiley-VCH Verlag; 2011.
- Brooks RH, Corey AT. Hydraulic properties of porous media. Fort Collins (CO): Civil Engineering Department, Colorado State University; 1964. p. 27.
- Bear J, Bachmat Y. Introduction to modeling of transport phenomena in porous media. Dordrecht: Kluwer Academic Publishers; 1990.
- Bahraini M, Molina JM, Kida M, Weber L, Narciso J, Mortensen A. Measuring and tailoring capillary forces during liquid metal infiltration. Curr Opin Solid St M. 2005;9:196–201. doi: 10.1016/j.cossms.2006.02.007
- van Genuchten MT. A closed-form equation for predicting the hydraulic conductivity of unsaturated soils. Soil Sci Soc Am J. 1980;44:892–898. doi: 10.2136/sssaj1980.03615995004400050002x
- Nordlund M, Michaud VJ. Dynamic saturation curve measurement for resin flow in glass fibre reinforcement. Compos Part A-Appl Sci. 2012;43:333–343. doi: 10.1016/j.compositesa.2011.12.001
- Chatzis I, Dullien FAL. Modeling pore structure by 2-D and 3-D networks with application to sandstones. J Can Petrol Technol. 1977;16:97–108.
- deGennes PG, Guyon E. Lois générales pour l'injection d'un fluide dans un milieu poreux aléatoire. J Mécanique. 1978;17:403–432.
- Stauffer D, Aharony A. Introduction to percolation theory. Revised 2nd ed. Boca Raton (FL): CRC Press; 1994.
- Hunt A, Ewing R. Percolation theory for flow in porous media. Heidelberg: Springer; 2009.
- Wilkinson D. Percolation effects in immiscible displacement. Phys Rev A. 1986;34:1380–1391. doi: 10.1103/PhysRevA.34.1380
- Ebrahimi F. Invasion percolation: a computational algorithm for complex phenomena. Comput Sci Eng. 2010;12:84–93. doi: 10.1109/MCSE.2010.42
- Wilkinson D, Barsony M. Monte Carlo study of invasion percolation clusters in two and three dimensions. J Phys A-Math Gen. 1984;17:L129–L135. doi: 10.1088/0305-4470/17/3/007
- Berkowitz B, Ewing RP. Percolation theory and network modeling applications in soil physics. Surv Geophys. 1998;19:23–72. doi: 10.1023/A:1006590500229
- Sheppard AP, Knackstedt MA, Pinczewski WV, Sahimi M. Invasion percolation: new algorithms and universality classes. J Phys A-Math Gen. 1999;32:L521–L529. doi: 10.1088/0305-4470/32/49/101
- Léger A, Calderon N, Charvet R, Dufour W, Bacciarini C, Weber L, Mortensen A. Capillarity in pressure infiltration: improvements in characterization of high-temperature systems. J Mater Sci. 2012;47:8419–8430. doi: 10.1007/s10853-012-6645-2
- Giesche H. Chapter 2.7, mercury porosimetry. In: Schüth F, Sing KSW, Weitkamp J, editors. Handbook of porous solids. Weinheim: Wiley-VCH; 2002. p. 309–351.
- Lenormand R. Flow through porous media: limits of fractal patterns. Proc Roy Soc London. 1989;A423:159–168.
- Lenormand R. Liquids in porous media. J Phys-Condens Mat. 1990;2:SA79–SA88. doi: 10.1088/0953-8984/2/1/006
- Thompson AH, Katz AJ, Kronin CE. The microgeometry and transport properties of sedimentary rock. Adv Phys. 1987;36:625–694. doi: 10.1080/00018738700101062
- Larson RG, Morrow NR. Effects of sample size on capillary pressures in porous media. Powder Technol. 1981;30:123–138. doi: 10.1016/0032-5910(81)80005-8
- Chen JD, Wada N. Visualization of immiscible displacement in a three-dimensional transparent porous medium. Exp Fluids. 1986;4:336–338.
- Chen J-D, Dias MM, Patz S, Schwartz LM. Magnetic resonance imaging of immiscible-fluid displacement in porous media. Phys Rev Lett. 1988;61:1489–1492. doi: 10.1103/PhysRevLett.61.1489
- Clement E, Baudet C, Hulin JP. Multiple scale structure of non wetting fluid invasion fronts in 3D model porous media. J Phys Lett. 1985;46:L1163–L1171. doi: 10.1051/jphyslet:0198500460240116300
- Clement E, Baudet C, Guyon E, Hulin JP. Invasion front structure in a 3D model porous medium under a hydrostatic pressure gradient. J Phys D Appl Phys. 1987;20:608–615. doi: 10.1088/0022-3727/20/5/007
- Hulin JP, Clement E, Baudet C, Gouyet JF, Rosso M. Quantitative analysis of an invading-fluid invasion front under gravity. Phys Rev Lett. 1988;61:333–336. doi: 10.1103/PhysRevLett.61.333
- Feder J. Fractals. New York (NY): Plenum Press; 1988.
- Vyssotsky VA, Gordon SB, Frisch HL, Hammersley JM. Critical percolation probabilities (bond problem). Phys Rev. 1961;123:1566–1567. doi: 10.1103/PhysRev.123.1566
- Gouyet JF. Physics and fractal structures. Paris, New York: Masson-Springer; 1996.
- Wilkinson D, Willemsen JF. Invasion percolation: a new form of percolation theory. J Phys A-Math Gen. 1983;16:3365–3376. doi: 10.1088/0305-4470/16/14/028
- Yanuka M, Dullien FAL, Elrick DE. Percolation processes and porous media: I. geometrical and topological model of porous media using a three-dimensional joint pore size distribution. J Colloid Interf Sci. 1986;112: 24–41. doi: 10.1016/0021-9797(86)90066-4
- Yanuka M. Percolation processes and porous media: II. Computer calculations of percolation probabilities and cluster formation. J Colloid Interf Sci. 1989;127: 35–47.
- Frisch HL, Hammersley JM, Welsh DJA. Monte Carlo estimates of percolation probabilities for various lattices. Phys Rev. 1962;126:949–951. doi: 10.1103/PhysRev.126.949
- Perham TJ, Chrzan DC, Jonghe LCD. Invasion percolation model of co-interpenetrating ceramic-metal composites. Model Simul Mater Sci. 2002;10:103–119. doi: 10.1088/0965-0393/10/2/301
- Xu K, Daian J-F, Quenard D. Multiscale structures to describe porous media part II: transport properties and application to test materials. Transp Porous Med. 1997;26:319–338. doi: 10.1023/A:1006519801173
- Bird NRA, Dexter AR. Simulation of soil water retention using random fractal networks. Eur J Soil Sci. 1997;48:633–641. doi: 10.1046/j.1365-2389.1997.00119.x
- Berkowitz B, Balberg I. Percolation theory and its application to groundwater hydrology. Water Resour Res. 1993;29:775–794. doi: 10.1029/92WR02707
- deGennes PG. Partial filling of a fractal structure by a wetting fluid. In: Adler D, Fritzsche H, Ovshinsky SR, editors. Physics of disordered media. New York and London: Plenum Press; 1985. p. 227–241.
- Bird NRA, Bartoli F, Dexter AR. Water retention models for fractal soil structures. Eur J Soil Sci. 1996;47: 1–6. doi: 10.1111/j.1365-2389.1996.tb01365.x
- Perrier E, Rieu M, Sposito G, de Marsily G. Models of the water retention curve for soils with a fractal pore size distribution. Water Resour Res. 1996;32: 3025–3031. doi: 10.1029/96WR01779
- Gimenez D, Perfect E, Rawls WJ, Pachepsky Y. Fractal models for predicting soil hydraulic properties: a review. Eng Geol. 1997;48:161–183. doi: 10.1016/S0013-7952(97)00038-0
- Ghanbarian-Alavijeh B, Hunt AG. Comments on, ‘More general capillary pressure and relative permeability models from fractal geometry’ by Kewen Li. J Contam Hydrol. 2012;140–141:21–23. doi: 10.1016/j.jconhyd.2012.08.004