
ABSTRACT
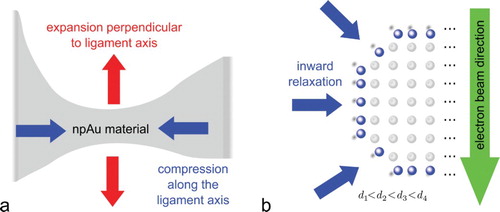
Reversible macroscopic length changes in nanoporous structures can be achieved by applying electric potentials or by exposing them to different gases or liquids. Thus, these materials are interesting candidates for applications as sensors or actuators. Macroscopic length changes originate from microscopic changes of crystal lattice parameters. In this report, we show spatially resolved measurements of crystal lattice strain in dealloyed nanoporous gold. The results confirm theory by indicating a compression of the lattice along the axis of cylindrically shaped ligaments and an expansion in radial direction. Furthermore, we show that curved npAu surfaces show inward relaxation of the surface layer.
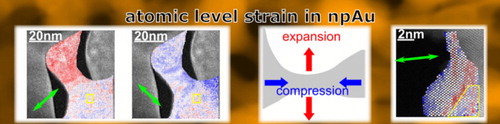
GRAPHICAL ABSTRACT
IMPACT STATEMENT
We show spatially resolved measurements of strain in nanoporous gold confirming theory: Crystal lattice is compressed along the axis of cylindrical ligaments and expanded in radial direction, surfaces relax inward.
1. Introduction
Dealloyed nanoporous gold (npAu) has attracted interest because of its high catalytic activity [Citation1–7], its high mechanical strength [Citation8,Citation9] and applications as actuator [Citation10–14], sensor [Citation14–21] or in fuel cells [Citation22]. NpAu is prepared by corrosion of a suitable gold master alloy in an acid. During this dealloying process the less noble metal (e.g. silver) is dissolved revealing a gold-rich porous structure built up of interconnected ligaments and pores [Citation23–25]. The large surface of npAu, which can reach values as large as 8–15 m2/g [Citation12,Citation26,Citation27], affects the strain state of the material to a large extent. The underlying driving force is the surface stress that tends to reduce the interatomic spacing in the plane of the surface [Citation28]. Strain of the atomic surface can have significant influence on the binding of molecules to the surface and hence on the catalytic activity. This has been demonstrated by theory [Citation29] and experiment [Citation30,Citation31].
Measurements of average crystal lattice parameters in npAu by X-ray diffraction can be found in the literature [Citation32–34]. Two publications [Citation32,Citation33] suggest two separate lattice parameters during dealloying of the master alloy—the Bragg reflections can be deconvolved into a sharp peak corresponding to a compression of the crystal lattice and a smaller, broad peak corresponding to an expansion. Whereas Schofield et al. explain these two peaks by strain that arises from different convex and concave ligament surfaces [Citation32], Dotzler et al. claim that the two regimes can be assigned to strain in two different directions, one along the axis of a ligament and the other one in radial direction [Citation33]. This explanation indeed agrees with findings in a study combining continuum theory and atomistic simulation [Citation28]. As compared to bulk gold, cylindrical Au nanoligaments exhibit compression along their axis while they are expanded in radial direction. The combined experimental and virtual diffraction study in [Citation34] does not confirm the bimodal Bragg reflection profile of Schofield et al. [Citation32] and Dotzler et al. [Citation33]. By contrast, it finds heterogeneous deformation in the form of large microstrain values [Citation34], and the variation in lattice parameter with ligament size is found consistent with the established magnitude of the surface stress of clean gold surfaces. Recently, a publication resolving strain spatially showed that those parts of the alloy which are corroded first show compressive strain [Citation35].
Atomically resolved measurements of strain by evaluation of high-resolution scanning transmission electron microscopy (STEM) images reveal an outward relaxation of the topmost atomic layer on (111) surface terraces [Citation36]. This is in agreement with density functional theory (DFT) predicting a small outward relaxation of the first layer on a (111) surface, whereas (110) and (001) surfaces show inward relaxation [Citation37]. Measurements of strain in gold nanoparticles provided in the literature are ambiguous. Yankovich et al. report general inward relaxation of the surface layers [Citation38], whereas Goris et al. measure outward relaxation [Citation39].
In this report, we show spatially resolved measurements of strain in nanoporous gold. They are based on nano-beam electron diffraction (NBED) in the scanning mode of a transmission electron microscope (TEM). We reveal a compression of the crystal lattice along the axis of cylindrical ligaments and an expansion in radial direction, confirming predictions made by continuum mechanics theory and energy minimizing structure relaxations [Citation28]. Furthermore, we show that the curved surfaces show inward relaxation of their topmost layers.
2. Methods
2.1. Nanoporous gold preparation
Three different samples are investigated in this letter. Sample A was produced from m thick Au
Ag
(subscripts: at.
) sheets (Mateck, Germany) that were punched to discs with a diameter of 3 mm. These discs were thinned by Ar-ion polishing under
incident angle using a Leica RES102 ion beam milling system until
of the sample area in top view were optically transparent. The dealloying was performed as in [Citation40] with the etched disc as working electrode, a polished Ag wire as a counter electrode and a Ag/AgCl reference electrode in 1 M HClO
electrolyte using a Metrohm Autolab PGSTAT302 potentiostat. In order to avoid excessive coarsening as well as cracking [Citation41], the dealloying potential was increased stepwise as follows: 144 min at 1050 mV, 48 min at 1100 mV, 48 min at 1150 mV and 60 min at 1200 mV. Subsequently, the obtained porous sample was repeatedly cleaned in water and ethanol. The sample immersed in ethanol was then clamped into an uncoated, foldable TEM sample holder (mesh:
m, Polaron Equipment, UK), dried and stored under Ar until transfer into the TEM.
Samples B and C have been prepared by corrosion of disc shaped samples with a diameter of 5 mm and master alloy concentrations of 25 and 30 at.% of Au, respectively. For potentiostatic corrosion of sample B, a three-electrode setup (Potentiostat BioLogic SP200) was used. A gold wire formed as a basket and holding the alloy was used as working electrode, counter electrode and quasi-reference electrode were made of platinum. The etching process occurred at 60 mV with dipped electrodes in 5 M nitric acid (HNO, Sigma-Aldrich, >65 weight%) at room temperature (see also ref. [Citation6]). Sample C has been submersed in concentrated nitric acid (HNO
, Sigma-Aldrich, > 65 weight %) at room temperature for 24 h for free corrosion, followed by careful removal and replacement of the acid by deionized water for at least three times. Afterwards the sample was dried in air for at least 24 h.
Sample preparation for TEM
For investigations of samples B and C in the TEM thin, electron transparent slices have been prepared using a standard focussed ion beam (FIB) lift-out technique [Citation42] using an FEI Nova 200 FIB with an acceleration voltage of 30 kV and a beam current of 50 pA for the final milling step.
2.2. TEM measurement
TEM measurements have been performed on an FEI Titan 80/300 TEM/STEM microscope equipped with an aberration corrector for the imaging system, operated at 300 kV. NBED diffraction patterns have been acquired either with a Gatan Ultra-Scan 1000 CCD camera or with a delay-line detector [Citation43]. This fast detector is one among few others [Citation44,Citation45] that allow for the acquisition of a large number of diffraction patterns with frame times in the millisecond range resulting in the so-called 4D-STEM data sets. Here we chose a frame time of 50 ms to improve statistics. STEM images with a frame time of 30 s have been acquired using a Fischione Model 3000 high-angle annular dark field (HAADF) detector.
2.3. Data evaluation
For the measurement of crystal lattice strain in a large field of view, we apply a well-established method, that is based on electron diffraction [Citation46–49]. In the scanning mode of a TEM, the beam is scanned across the sample and a corresponding diffraction pattern is acquired at each position. According to Bragg's law [Citation50], distances between the diffraction spots depend on the local lattice parameter. Hence, lattice strain can be measured by comparison of distances between diffraction spots in each diffraction pattern with the distances between the same diffraction spots in patterns acquired in a reference region of the sample. Comparing distances between diffraction spots in two linearly independent directions gives information about shear strain and crystal lattice rotation [Citation51,Citation52]. Thus, each data point in an evaluation corresponds to one diffraction pattern acquired while the beam is scanned across the sample. For measurements on a small length scale with atomic resolution, we evaluate lattice plane distances in high-resolution STEM images [Citation53]. Data evaluation has been carried out using the ImageEval software [Citation54].
3. Results and discussion
In the following sections, the measurements of strain are presented. To clarify the nomenclature, in this report, we use the terms compressive () and tensile strain (
) to refer to smaller and larger lattice parameters measured with respect to the reference region, respectively. The term surface relaxation is used for out-of plane surface relaxations, parallel to the surface normal of the gold ligaments. It concerns the change of crystal lattice parameters from a thick region of a ligament toward the border to a pore (the vacuum). In npAu there is no unstrained reference region that represents the lattice parameter of bulk Au. Simplifying the porous structure as a skeleton of cylindrical wires which are connected at nodes such as in [Citation13,Citation28], we choose reference regions within the nodes. Note that zero strain in these reference regions does not mean zero strain compared to the bulk lattice parameter of Au. More precisely, we measure local variations of lattice parameters with respect to the lattice parameter in a nearby node.
3.1. Lattice strain of approximately cylindrical ligaments
Figure shows the lattice strain of an approximately cylindrical npAu ligament in sample B. The ligament axis lies parallel to the direction of the crystal structure. Strain is measured with respect to the reference region, that is marked by yellow rectangles. The relative changes of the lattice parameters from this reference region toward the cylindrical part of the sample are clearly visible. An increased lattice parameter in radial direction of the ligament (Figure (a), direction indicated by green arrow) and compressive strain along the cylindrical axis of the ligament (Figure (b)) can be seen. Furthermore, Figure (c) shows a change in shear strain in the center of the ligament and Figure (d) shows that the upper part of the ligament is rotated by some degrees with respect to the lower part. The measured strain can be interpreted as an average over the strains along the path of the electron beam through the sample as shown in the supplemental information.
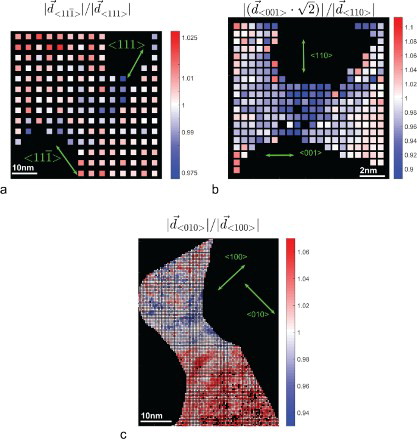
Another quantity that represents strain of the crystal lattice is the tetragonal distortion. It gives the ratio between the lattice parameters in two linearly independent directions. For an unstrained cubic crystal lattice, the value for the tetragonal distortion is one. In tetragonal distorted crystal lattices, the value differs from one. An advantage of this strain representation compared to the one shown in Figure is the fact that no reference region has to be defined.
Differences in the corrosion process have an influence on Ag removal rates, thereby on ligament geometries and on the average strain state of the porous sample as already shown recently [Citation34]. For this reason, to confirm the result of axial lattice compression and radial expansion for various ligament geometries in this letter, we investigate samples that have been corroded using various methods (see Section 2). Figure shows the tetragonal distortion of three ligaments. The distortion has been determined by dividing the lattice parameter along the ligament axis by the lattice parameter in radial direction. From a comparison of the measured values in the cylindrical parts of the samples with values in the nodes, it can be concluded that the crystal lattice in the ligaments is compressed along the axis, whereas it is expanded in radial direction. This result is independent on the preparation process and it confirms the predictions made in [Citation28]. The effect seems to be more pronounced the smaller the radius of the ligament is, but for a more comprehensive comparison of the tetragonal distortion of ligaments of the same sample with various lengths, various length-radius ratios and various curvatures of the ligament surfaces further measurements have to be performed, which is subject to further studies.
Figure 1. Lattice strain of an approximately cylindrical ligament with its cylinder axis oriented parallel to the direction in sample B. (a) Lattice strain in
-direction (radial direction) indicating tensile strain in the cylindrical region, (b) lattice strain in
-direction (along the ligament axis) indicating compressive strain, (c) shear strain, (d) rotation of the crystal lattice. All quantities have been measured with respect to the reference region marked by the yellow rectangles.
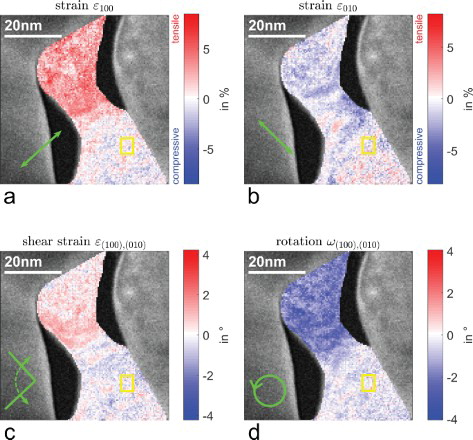
Figure 2. Tetragonal distortion of approximately cylindrical ligaments. Independent on the sample preparation ligaments show compressive lattice strain along the ligament axis and tensile strain in radial direction. (a) sample C, (b) sample A, and (c) sample B (same position as in Figure ).
The numerical value for the tetragonal distortion can be affected by distortions of the diffraction patterns caused by lens aberrations of the electron microscope. In most cases these distortions cause a circle to appear as an ellipse [Citation55] and hence distances between diffraction spots may appear enlarged in one direction or shortened in another direction. But as these instrumental distortions are constant during the complete scan of a ligament, each diffraction pattern is distorted in the same manner. Hence, relative changes in the tetragonal distortion are unaffected by lens aberrations.
3.2. Lattice relaxation at the surface
The diffraction-based method used in the preceding section does not allow for measuring strain with atomic resolution [Citation48]. A further consideration of this aspect can be found in the supplemental information. Hence, with this method it cannot be determined whether the topmost surface layers at the border to the vacuum show an inward or outward out-of plane relaxation. To answer this important question, we evaluate high-resolution STEM images. As scan distortions of the microscope can distort the images along the slow scan direction, two images have been acquired at the same sample position with a change of the scan rotation by 90 in between. Strain has been evaluated only in the fast scan direction of each image. The result can be seen in Figure for a measurement on sample A. Relaxation is measured with respect to yellow marked reference regions. These regions have been chosen, because they are located in the center of the ligament in order to characterize eventually present strain gradients from this region to the ligament surface. The evaluation shows a similar trend for both crystallographic directions: approaching the border to the vacuum, we observe smaller out-of plane lattice parameters indicating inward relaxation of the surface. We confirmed this result by an evaluation of many further high-resolution STEM images of different gold ligaments. For convexly curved surfaces, we find that the trend of a decreasing lattice parameter is more pronounced than for concavely curved ligament surfaces. No general trend has been found for the in-plane lattice parameter.
The fact, that we find in our measurements inward relaxation not only in the topmost surface layer can be attributed to the 3D geometry of the sample and is a projection artefact (Figure (b)). As the sample thickness increases from the vacuum toward the thicker region in the 2D projection, the effect of the surface is underestimated. The inward relaxation of the seemingly subsurface layers is explained by the fact, that parts of these layers lie also directly at the border to the vacuum representing the inward relaxed surface. As the measured strain represents an average over the strains along the path of the electron beam through the sample (see supplementary information) the measured strain gradient approaching the surface shows that a larger percentage of atoms in each atomic column is a surface atom with inwards relaxed lattice parameter. This is illustrated schematically in Figure (b).
Figure 3. Atomically resolved measurement of surface relaxations of npAu (sample A) showing strengthening inward relaxation from the thick region toward the border to the vacuum. Relaxations in two different crystallographic directions (indicated by green arrows) have been determined from two different STEM images with a rotation of the scan direction between the acquisition in order to avoid an influence of scan distortions. Each data point represents atomically resolved the lattice parameter variation with respect to the lattice parameter in the yellow marked reference regions.
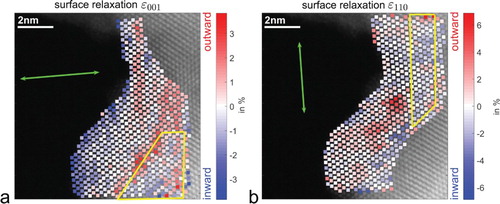
Figure 4. Crystal lattice strain in npAu: (a) Cylindrical ligaments show compressive lattice strain along the ligament axis and tensile strain in radial direction. (b) Inward surface relaxation. Averages over the lattice parameters along the path of the electron beam through the sample are decreasing toward the surface.
Our measurements confirm results obtained from DFT [Citation37]. These predict inward relaxations of the topmost surface layer for all surfaces except for the planar (111) surface. For this surface, the predicted outward relaxation is small compared to the inward relaxation of the others.
3.3. Discussion
Figure illustrates the two main results of this study: firstly, lattice parameters are compressed along the axis of cylindrically shaped ligaments and expanded in radial direction. Secondly, the surface layers show inward relaxation. A critical aspect for strain measurements in npAu is that the strain state of the structure is not static but subject to change, for example, due to changing environments. The strain state during dealloying can be significantly different from the strain state after removal from the dealloying acid and subsequently drying [Citation33]. Furthermore, adsorbed molecules clearly change the strain state of the structure [Citation15,Citation16,Citation18,Citation20,Citation21]. Besides the relaxation of the clean sample the contamination of the surface by various molecules might lead to a different strain state. Contaminations could occur during transfer to the TEM or even in the TEM [Citation56,Citation57]. Zugic et al. showed by in situ treatment of the samples in the TEM that adsorbed oxide layers can be removed [Citation58] by exposing the sample to a stream of carbon monoxide. Further investigation of the samples for example by in situ strain measurements during exposure to different gases such as in [Citation16,Citation58] would clearly be helpful to understand the influence of adsorbed atoms on crystal lattice strain. Otherwise, the measured values could represent the strain state of a npAu sample covered with amorphous layers of contamination (not necessary oxides) and not the strain state of clean npAu. A more detailed discussion of the contamination of the samples investigated in this letter can be found in the supplemental information.
The two different methods we applied in this letter for the measurement of strain complement each other. Assets and drawbacks of each have been investigated in the literature [Citation47,Citation48]. Both reveal the average strain in electron beam direction (see supplemental information). For a quantitative measurement of strain in three dimensions more advanced methods are required [Citation39]. Yet, the large sample volume and the complexity of the structure turn this an extremely challenging task. Nevertheless, our measurements confirm the predictions of Weissmüller et al. [Citation28] that have already been used for the interpretation of measurements of spatially averaged lattice parameters [Citation33]. From this point of view, strain measured in this report gives important insights in the atomic strain state of nanoporous gold. Measurements of strain in more complex ligament geometries will be performed in the near future.
4. Conclusion
Spatially resolved measurements of local crystal lattice strain variations in nanoporous gold have been shown revealing a compression of the crystal lattice along the axis of approximately cylindrical ligaments and an expansion of the crystal lattice in radial direction. For curved npAu surfaces, we found inward surface relaxation. Our results confirm theoretical predictions made in literature. In situ strain measurements during exposure to gases would help to investigate the influence of adsorbates on the strain state of clean npAu.
Supplementary_Material.pdf
Download PDF (3.1 MB)Disclosure statement
No potential conflict of interest was reported by the authors.
ORCID
Christoph Mahr http://orcid.org/0000-0003-1872-8887
Knut Müller-Caspary http://orcid.org/0000-0002-2588-7993
Matthias Graf http://orcid.org/0000-0002-2065-0014
Tim Grieb http://orcid.org/0000-0002-3054-6181
Marco Schowalter http://orcid.org/0000-0001-5391-6934
Florian F. Krause http://orcid.org/0000-0002-9410-2483
Thorsten Mehrtens http://orcid.org/0000-0001-9172-0123
Arne Wittstock http://orcid.org/0000-0002-0139-3710
Jörg Weissmüller http://orcid.org/0000-0002-8958-4414
Andreas Rosenauer http://orcid.org/0000-0003-4742-0451
Additional information
Funding
Related Research Data
References
- Zielasek V, Jürgens B, Schulz C, et al. Gold catalysts: nanoporous gold foams. Angew Chem Int Ed. 2006;45(48):8241–8244. doi: 10.1002/anie.200602484
- Zhang J, Liu P, Ma H, et al. Nanostructured porous gold for methanol electro-oxidation. J Phys Chem C. 2007;111(28):10382–10388. doi: 10.1021/jp072333p
- Xu C, Su J, Xu X, et al. Low Temperature CO Oxidation Over Unsupported Nanoporous Gold. J Amer Chem Soc. 2007;129(1):42–43. doi: 10.1021/ja0675503
- Yin H, Zhou C, Xu C, et al. Aerobic oxidation of d-glucose on support-free nanoporous gold. J Phys Chem C. 2008;112(26):9673–9678. doi: 10.1021/jp8019864
- Ding Y, Chen M. Nanoporous metals for catalytic and optical applications. MRS Bull. 2009;34(08):569–576. doi: 10.1557/mrs2009.156
- Wittstock A, Zielasek V, Biener J, et al. Nanoporous gold catalysts for selective gas-phase oxidative coupling of methanol at low temperature. Science. 2010;327(5963):319–322. doi: 10.1126/science.1183591
- Wittstock A, Biener J, Bäumer M. Nanoporous gold: A new material for catalytic and sensor applications. Phys Chem Chem Phys. 2010;12:12919–12930. doi: 10.1039/c0cp00757a
- Volkert CA, Lilleodden ET, Kramer D, et al. Approaching the theoretical strength in nanoporous Au. Appl Phys Lett. 2006;89(6):061920. doi: 10.1063/1.2240109
- Hodge AM, Biener J, Hayes JR, et al. Scaling equation for yield strength of nanoporous open-cell foams. Acta Mater. 2007;55(4):1343–1349. doi: 10.1016/j.actamat.2006.09.038
- Weissmüller J, Viswanath RN, Kramer D, et al. Charge-induced reversible strain in a metal. Science. 2003 Apr;300(5617):312–315. doi: 10.1126/science.1081024
- Kramer D, Viswanath RN, Weissmüller J. Surface-stress induced macroscopic bending of nanoporous gold cantilevers. Nano Lett.. 2004;4(5):793–796. doi: 10.1021/nl049927d
- Jin H-J, Parida S, Kramer D, et al. Sign-inverted surface stress-charge response in nanoporous gold. Surf Sci. 2008;602(23):3588–3594. doi: 10.1016/j.susc.2008.09.038
- Jin HJ, Weissmüller J. Bulk nanoporous metal for actuation. Adv Eng Mater. 2010;12(8):714–723. doi: 10.1002/adem.200900329
- Stenner C, Shao LH, Mameka N, et al. Piezoelectric gold: Strong charge-load response in a metal-based hybrid nanomaterial. Adv Funct Mater. 2016;26(28):5174–5181. doi: 10.1002/adfm.201600938
- Lavrik NV, Tipple CA, Sepaniak MJ, et al. Enhanced chemi-mechanical transduction at nanostructured interfaces. Chem Phys Lett. 2001;336(5):371–376. doi: 10.1016/S0009-2614(01)00155-5
- Biener J, Wittstock A, Zepeda-Ruiz LA, et al. Surface-chemistry-driven actuation in nanoporous gold. Nat Mater. 2009;8(1):47–51. doi: 10.1038/nmat2335
- Seker E, Berdichevsky Y, Begley MR, et al. The fabrication of low-impedance nanoporous gold multiple-electrode arrays for neural electrophysiology studies. Nanotechnology. 2010;21(12):125504. doi: 10.1088/0957-4484/21/12/125504
- Detsi E, Chen ZG, Vellinga WP, et al. Reversible strain by physisorption in nanoporous gold. Appl Phys Lett. 2011;99(8):083104. doi: 10.1063/1.3625926
- Detsi E, Punzhin S, Rao J, et al. Enhanced strain in functional nanoporous gold with a dual microscopic length scale structure. ACS Nano. 2012;6(5):3734–3744. doi: 10.1021/nn300179n
- Detsi E, Chen ZG, Vellinga WP, et al. Actuating and sensing properties of nanoporous gold. J Nanosci Nanotechnol. 2012;12(6):4951–4955. doi: 10.1166/jnn.2012.4882
- Daggumati P, Matharu Z, Seker E. Effect of Nanoporous Gold Thin Film Morphology on Electrochemical DNA Sensing. Anal Chem. 2015;87(16):8149–8156. PMID: 25892217. doi: 10.1021/acs.analchem.5b00846
- Zeis R, Lei T, Sieradzki K, et al. Catalytic reduction of oxygen and hydrogen peroxide by nanoporous gold. J Catal. 2008;253(1):132–138. doi: 10.1016/j.jcat.2007.10.017
- Pickering HW, Swann PR. Electron metallography of chemical attack upon some alloys susceptible to stress corrosion cracking. Corrosion. 1963;19(11):373t–389t. doi: 10.5006/0010-9312-19.11.373
- Forty AJ. Corrosion micromorphology of noble metal alloys and depletion gilding. Nature. 1979;282(5739):597–598. doi: 10.1038/282597a0
- Erlebacher J. An atomistic description of dealloying porosity evolution, the critical potential and rate-limiting behavior. J Electrochem Soc. 2004;151(10):C614–C626. doi: 10.1149/1.1784820
- Cattarin S, Kramer D, Lui A, et al. Preparation and characterization of gold nanostructures of controlled dimension by electrochemical techniques. J Phys Chem C. 2007;111(34):12643–12649. doi: 10.1021/jp072405c
- Rouya E, Cattarin S, Reed ML, et al. Electrochemical characterization of the surface area of nanoporous gold films. J Electrochem Soc. 2012;159(4):K97–K102. doi: 10.1149/2.097204jes
- Weissmüller J, Duan HL, Farkas D. Deformation of solids with nanoscale pores by the action of capillary forces. Acta Mater. 2010;58(1):1–13. doi: 10.1016/j.actamat.2009.08.008
- Mavrikakis M, Stoltze P, Nørskov J. Making gold less noble. Catal Lett. 2000;64(2):101–106. doi: 10.1023/A:1019028229377
- Weissmüller J, Viswanath RN, Kibler LA, et al. Impact of surface mechanics on the reactivity of electrodes. Phys Chem Chem Phys. 2011;13:2114–2117. doi: 10.1039/C0CP01742F
- Deng Q, Smetanin M, Weissmüller J. Mechanical modulation of reaction rates in electrocatalysis. J Catal. 2014;309:351–361. doi: 10.1016/j.jcat.2013.10.008
- Schofield EJ, Ingham B, Turnbull A, et al. Strain development in nanoporous metallic foils formed by dealloying. Appl Phys Lett. 2008;92(4):043118. doi: 10.1063/1.2838351
- Dotzler CJ, Ingham B, Illy BN, et al. In situ observation of strain development and porosity evolution in nanoporous gold foils. Adv Funct Mater. 2011;21(20):3938–3946. doi: 10.1002/adfm.201100735
- Graf M, Ngô BND, Weissmüller J, et al. X-ray studies of nanoporous gold: powder diffraction by large crystals with small holes. Available from: http://arxivorg/abs/170807789 [cond-matmtrl-sci]; 2017.
- Chen-Wiegart YCK, Harder R, Dunand DC, et al. Evolution of dealloying induced strain in nanoporous gold crystals. Nanoscale. 2017;9:5686–5693. doi: 10.1039/C6NR09635B
- Fujita T, Guan P, McKenna K, et al. Atomic origins of the high catalytic activity of nanoporous gold. Nat Mater. 2012;11(9):775–780. doi: 10.1038/nmat3391
- Guan L, Li X, Li Q, et al. Relaxation and electronic states of Au(100), (110) and (111) surfaces. Solid State Commun. 2009;149(37-38):1561–1564. doi: 10.1016/j.ssc.2009.05.046
- Yankovich AB, Berkels B, Dahmen W, et al. High-precision scanning transmission electron microscopy at coarse pixel sampling for reduced electron dose. Adv Struct Chem Imag. 2015;1(1):1–5. doi: 10.1186/s40679-015-0003-9
- Goris B, De Beenhouwer J, De Backer A, et al. Measuring lattice strain in three dimensions through electron microscopy. Nano Lett. 2015;15(10):6996–7001. doi: 10.1021/acs.nanolett.5b03008
- Graf M, Roschning B, Weissmüller J. Nanoporous gold by alloy corrosion: Method-structure-property relationships. J Electrochem Soc. 2017;164(4):C194–C200. doi: 10.1149/2.1681704jes
- Parida S, Kramer D, Volkert CA, et al. Volume change during the formation of nanoporous gold by dealloying. Phys Rev Lett. 2006;97(3):4–7. doi: 10.1103/PhysRevLett.97.035504
- Giannuzzi LA, Stevie FA. A review of focused ion beam milling techniques for TEM specimen preparation. Micron. 1999;30(3):197–204. doi: 10.1016/S0968-4328(99)00005-0
- Müller-Caspary K, Oelsner A, Potapov P. Two-dimensio nal strain mapping in semiconductors by nano-beam electron diffraction employing a delay-line detector. Appl Phys Lett. 2015;107(7):072110. doi: 10.1063/1.4927837
- Ryll H, Simson M, Hartmann R, et al. A pnCCD-based, fast direct single electron imaging camera for TEM and STEM. J Instrum. 2016;11(04):P04006. doi: 10.1088/1748-0221/11/04/P04006
- Özdöl V, Gammer C, Sarahan M, et al. Nano-scale Strain Mapping Using Advanced STEM with a Direct Electron Detector. Microsc Microanal. 2014;S20(3):1046–1047. doi: 10.1017/S1431927614006953
- Uesugi F, Hokazono A, Takeno S. Evaluation of two-dimensional strain distribution by STEM/NBD. Ultramicroscopy. 2011;111(8):995–998. doi: 10.1016/j.ultramic.2011.01.035
- Müller K, Rosenauer A, Schowalter M, et al. Strain measurement in semiconductor heterostructures by scanning transmission electron microscopy. Microsc Microanal. 2012;18:995–1009. doi: 10.1017/S1431927612001274
- Mahr C, Müller-Caspary K, Grieb T, et al. Theoretical study of precision and accuracy of strain analysis by nano-beam electron diffraction. Ultramicroscopy. 2015;158:38–48. doi: 10.1016/j.ultramic.2015.06.011
- Grieb T, Krause FF, Mahr C, et al. Optimization of NBED simulations for disc-detection measurements. Ultramicroscopy. 2017;181:50–60. doi: 10.1016/j.ultramic.2017.04.015
- Bragg WH, Bragg WL. The reflection of X-rays by crystals. Proc R Soc Lond Ser A. 1913;88(605):428–438. doi: 10.1098/rspa.1913.0040
- Rouvière J, Sarigiannidou E. Theoretical discussions on the geometrical phase analysis. Ultramicroscopy. 2005;106(1):1–17. doi: 10.1016/j.ultramic.2005.06.001
- Béché A, Rouvière JL, Clément L, et al. Improved precision in strain measurement using nanobeam electron diffraction. Appl Phys Lett. 2009;95(12):123114–0. doi: 10.1063/1.3224886
- Bierwolf R, Hohenstein M, Phillipp F, et al. Direct measurement of local lattice distortions in strained layer structures by HREM. Ultramicroscopy. 1993;49:273–285. doi: 10.1016/0304-3991(93)90234-O
- Müller-Caspary K, Mehrtens T, Schowalter M, et al. ImageEval. A software for the processing, evaluation and acquisition of (S)TEM images. The 16th European Microscopy Congress, Lyon, France; 2016.
- Capitani GC, Oleynikov P, Hovmöller S, et al. A practical method to detect and correct for lens distortion in the TEM. Ultramicroscopy. 2006;106(2):66–74. doi: 10.1016/j.ultramic.2005.06.003
- Hren J. Specimen contamination in analytical electron microscopy: sources and solutions. Ultramicroscopy. 1978;3(Suppl C):375–380. doi: 10.1016/S0304-3991(78)80057-6
- Isaacson M, Kopf D, Ohtsuki M, et al. Contamination as a psychological problem. Ultramicroscopy. 1979;4(1):97–99. doi: 10.1016/0304-3991(79)90012-3
- Zugic B, Wang L, Heine C, et al. Dynamic restructuring drives catalytic activity on nanoporous gold-silver alloy catalysts. Nat Mater. 2017;16(5):558–564. doi: 10.1038/nmat4824