
 ?Mathematical formulae have been encoded as MathML and are displayed in this HTML version using MathJax in order to improve their display. Uncheck the box to turn MathJax off. This feature requires Javascript. Click on a formula to zoom.
ABSTRACT
For the first time, X-ray refraction techniques are proven for the identification of void formation in Ti-6Al-4V parts produced by selective laser melting. The topology and volume fraction of pores are measured in samples produced with different laser energy density. Unique X-ray refraction methods identify different kinds of defects, characteristic to the regions below and above the optimum laser energy density, namely unprocessed powder (unmolten powder particles, balling effect, and fusion defects) from empty keyhole pores. Furthermore, it is possible to detect small inhomogeneities (voids or cracks) with sizes below the spatial resolution of optical microscopy and X-ray computed tomography.
IMPACT STATEMENT
For the first time, we show that, unparalleled by high-resolution X-ray-computed tomography or electron microscopy, X-ray refraction can distinguish unprocessed powder from empty pores in additive manufactured materials.
GRAPHICAL ABSTRACT
The powder-based additive manufacturing (AM) technique of selective laser melting (SLM) is a powerful tool for manufacturing near net-shape and lightweight components in a time-efficient and resource-saving manner [Citation1,Citation2]. AM requires no molds or part-specific tools and enables the fabrication of very complex and customized parts directly from computer-aided design (CAD) models [Citation3]. With these advantages, many industry sectors such as aerospace started to explore this technology widely over the last decade. Titanium alloys are well suited to be processed by SLM [Citation4]. In particular, the Ti-6Al-4 V (Ti64) alloy is mostly used in the aerospace industry in the form of wrought products owing to a well-balanced properties profile that combines mechanical performance, low density, and corrosion resistance. However, the rapid solidification during SLM and non-optimal process parameters may cause instabilities during the process, which lead to the formation of inner defects in the parts: binding or fusing faults, balling, keyhole defects and even crack formation from thermal residual stresses [Citation5,Citation6].
Several studies have thus far focused on the optimization of the AM process parameters or the post-treatment of the parts (e.g. [Citation2,Citation6,Citation7]), resulting in improvements of the materials’ static or fatigue properties [Citation6,Citation8,Citation9]. In a previous study we reported the optimization of the material density of Ti64 by means of SLM parameter adjustment, and characterization by Archimedes method, 2D microscopy and 3D X-ray computed tomography (XCT) [Citation10]. Minimum porosity was obtained in a narrow window bordered by process parameters that lead to either overheating (keyhole defects), or insufficient fusion. One shortcoming of this study arises from the drawbacks of each characterization method employed when it comes to detecting and identifying small voids or thin even cracks. Archimedes method, although it fails to account for open porosity and compositional changes (e.g. density changes from Al loss by evaporation), can at least provide an indication of the amount of such voids. However, neither classic 2D image analysis (e.g. light microscopy), being a local probe, nor advanced parallel beam synchrotron computed X-ray tomography (XCT) (spatial resolution ∼ 0.5–1 µm³), allow reliably identifying voids and cracks < 1 µm, particularly in large SLM parts [Citation10]. A complementary method to detect these features is required.
X-ray refraction techniques may provide the capability of characterizing these defects [Citation11]. They have been introduced a couple of decades ago, and successfully applied to both characterization and non-destructive testing [Citation12] of lightweight (plastic) composites. X-ray refraction occurs whenever X-rays interact with interfaces where the index of refraction changes, for example between metal and air, as it is the case at crack or pore surfaces. This causes the refracted X-rays path to deviate from the simply transmitted path. The amount of deviation depends on the incident angle and the difference in refractive index, but not on the size of the crack or pore. Therefore, these techniques can detect (as opposed to image) defects much smaller than the spatial resolution of the imaging system, down to nanometric dimensions. Such sensitivity is unparalleled even by the highest resolution imaging techniques such as synchrotron XCT. Since usually only one direction of the scattering vector is analyzed, these methods are also sensitive to the orientation of inner surfaces.
For the first time, we exploit X-ray refraction to detect small defects and their orientation in AM materials, and show that X-ray refraction techniques are complementary to XCT and 2D image analysis.
The Ti64 ELI powder was received from Advanced Powders & Coatings (AP&C, Canada). It was obtained by plasma atomization, resulting in spherical particles with a size distribution of 31 µm (D10), 42 µm (D50) and 53 µm (D90) measured with particle size analyzer LS 13320 PIDS, Beckman Coulter. Cuboids of 10 × 10 × 10 mm3 were produced in argon atmosphere by a SLM-280 HL (SLM Solutions) machine equipped with a 400 W laser of 1070 nm wavelength (as compared to SLM-250 with max. 200 W in [Citation10]). The temperature of the building platform was held at 200°C.
For this study the scanning velocity was varied from 200 mm s−1 to 1100 mm s−1 keeping the laser power at 175 W, the hatch distance at 0.1 mm, and the layer thickness at 30 µm. The strategy of varying one factor at a time (OFAT) was taken from our previous study [Citation10], with one major difference, namely a laser focus at 0 mm instead of 2 mm is used here. The resulting energy density, which is usually described as a ratio between laser power, scanning velocity, hatch distance and layer thickness (see e.g. [Citation2,Citation3,Citation5,Citation10]), was varied between 50 and 300 J mm−3.
The porosity of each test sample was measured by different techniques. All samples were firstly characterized with the Archimedes method (ρn = 4.43 g cm−³, see further Ref. [Citation10]). Then they were divided into two parts, one of which was analyzed two-dimensionally (2D) by metallographic cross-sections perpendicular to the building direction, whereas the second part was used for 3D investigations by synchrotron XCT at the ID19 beamline of the European Synchrotron Radiation Facility, Grenoble. The sample sizes, the details of sample preparation and analysis methods are described in Ref. [Citation10].
The influence of the energy density on the total porosity of the SLM Ti64 ELI material quantified by microscopy (2D), tomography (3D), and the Archimedes method is presented in Figure . The 3D porosity values are very close to those measured by 2D analysis, except at low energy densities. They show a minimum at an energy density of ∼ 120 J mm-3 (total porosity < 0.05 vol%). Archimedes method, in contrast, shows only slight changes in this region.
Figure 1. Porosity as a measure for the total number of defects measured by microscopy (2D), tomography (3D), and the Archimedes method as a function of the energy density applied during SLM. ‘sample 1’ and ‘sample 2’ indicate the conditions chosen for the further investigation by x-ray refraction radiography.
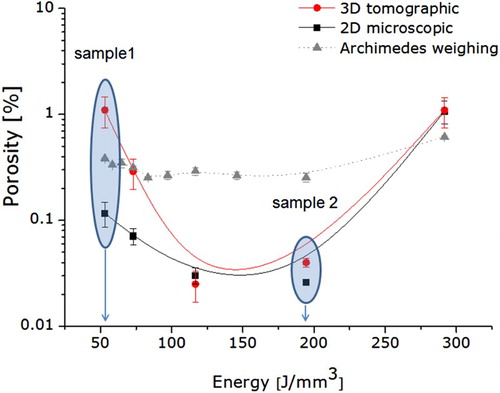
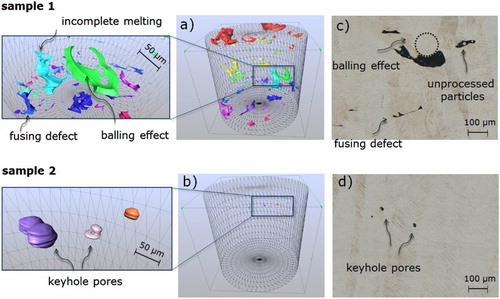
At the two sides of the optimum energy density range (between 53 J mm−3 and 195 J mm−3), different defect types dominate: As already reported elsewhere (e.g. [Citation3,Citation7,Citation10]), fusing defects and balling are observed below the lower limit, whereas at higher energy density vaporization (keyhole) pores form the majority of defects (Figure ). The balling and fusing defects can have lengths of more than 100 µm and appear crack-like. The keyhole pores show diameters of up to 50 µm.
Figure 2. Tomographic (3D) (a,b) and microscopic (2D) (c,d) depictions of the defects observed in the SLM produced Ti64 parts: for sample 1 (a,c) and sample 2 (b,d). The bounding cylinders (a,b) have a size of 800 µm diameter and 700 µm height, the Ti64 alloy is transparent.
The synchrotron X-ray refraction radiography (SXRR) experiments were carried out at the BAMline [Citation13,Citation14] (Figure ), located at the synchrotron light source BESSY II (Helmholtz-Zentrum Berlin), utilizing the X-refraction technique called analyzer based imaging (ABI). The samples were thin plates with a thickness of 0.35 mm cut perpendicular to the building direction from the middle of the cuboids and polished on both sides using a SiC grinding paper up to 4000 grit.
Figure 3. Sketch of the experimental setup ‘ABI’ for X-ray refraction radiography at BAMline.
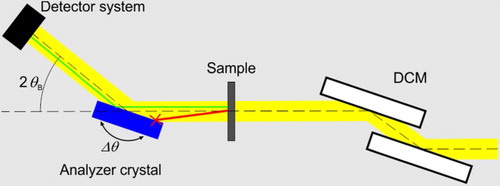
In ABI, the highly collimated and monochromatic X-ray beam (E = 30 keV; ΔE/E = 2·10−3) impinges on an analyzer crystal after interacting with the sample. This analyzer crystal acts as an angular filter for the X-rays; only if the incident angle is equal to the crystal’s Bragg angle θB, they are reflected towards the detector system. By rotating the analyzer crystal around θB the so-called rocking curve is recorded, which describes the scattered beam intensity as a function of the deviation from θB. The 2D X-ray detector system had 2048 × 2048 pixel² and a nominal pixel size of 3.6×3.6 µm² [Citation15], while the X-ray beam was limited to a field-of-view of 7×5 mm² to avoid detector backlighting [Citation16]. The rocking curves of both samples and a flat field (i.e. free beam without sample) were recorded by scanning a range of Δθ = ± 0.006° around θB in 61 steps.
Using a custom LabView® software module, the maximum intensity and integral intensity of the rocking curve in each detector pixel were determined by a peak fit and the generated 2D maps were further processed in Fiji ImageJ [Citation17,Citation18]. The inner surfaces of the sample were analyzed by calculating the refraction value C [Citation19], which is proportional to the (local) specific surface ξ (i.e. surface per unit volume) of the sample.
(1)
(1)
Considering it as an additional scattering factor in Lambert-Beer’s law, C was calculated from the rocking curves of the sample and the flat field (i.e. without sample) using the respective maximum intensities Imax, Imax,0, and integral intensities Iint, Iint,0 following:
(2)
(2)
The proportionality factor k (Equation 1) was obtained from a calibration measurement of the native Ti64 powder. The specific surface of the powder was determined by a BET gas adsorption measurement (ξ = 139.5 mm-1), and a SXRR of the same powder yielded k = 208.676 mm-1.
In addition to SXRR, the samples were also investigated by synchrotron X-ray transmission radiography using the same detector system with identical spatial resolution. These radiographs were used to calculate the linear attenuation µ*d = ln(I0/I), and the local porosity p = 1—µ/µ0 of the sample (i.e. a 2D porosity map). µ0 is the nominal linear attenuation coefficient of the material and was determined from a defect-free area of the sample, where the material could be assumed to be fully dense.
The resulting 2D distributions of the specific surface (mm−1), and the local porosity integrated over the thickness of the sample are depicted in Figure (note the different gray scale of each subfigure). Two observations can be made from these images: firstly, SXRR detects more defects than X-ray transmission radiography in both samples. The defects are aligned perpendicular to the building direction (vertical direction in Figure ), and we can assume they are located between successive layers. Some 247 defects are found by SXRR against 85 found by transmission radiography for sample 1; analogously 119 defects are found by SXRR against 96 by transmission radiography for sample 2. This demonstrates that SXRR can detect defects below its spatial resolution. Both, transmission radiography and SXRR, have been performed with identical spatial resolution. Therefore, it can be concluded that the defects additionally detected by SXRR are smaller than the actual spatial resolution. Secondly, there are clearly two types of defects that can be distinguished in the SXRR images. One type is shown in the enlarged detail of Figure (a). The characteristic feature of these defects is a high specific surface distributed within the entire volume of the defect. This indicates an internal structure or complex shape, with sub-defects at a scale below the camera pixel resolution. The other type is shown in the enlarged detail of Figure (b), which give rise to crescent-shaped structures in the image. These crescents are the phase contrast (refraction) enhanced edges of (rather circular) voids and, therefore, correspond to empty pores (i.e. with no internal structure). Note that only the top and bottom edges of the pores are enhanced due to the sensitivity to interface orientation of the SXRR measurement. A similar distinction between defect types is not as clear in the transmission radiographs.
Figure 4. (Left) 2D distribution of the specific surface in mm−1 of sample 1 (a) and sample 2 (b) from SXRR; (right) 2D distribution of porosity in % of sample 1 (c) and sample 2 (d) from conventional radiography.
Frequency histograms of the average gray level, i.e. brightness, of the defects visible in Figure (as indicated by the calibration bars) are shown in Figure (a–d). These gray levels represent (i) the average porosity and (ii) the average specific surface over the area of each segmented defect. The distribution of the specific surface of sample 1 is shifted towards higher values compared to that of sample 2. The distribution of the porosity also appears shifted, but not as much. The difference in the nature of defects in sample 1 and sample 2 becomes more apparent in the scatter plot of specific surface vs. porosity of each segmented defect, presented in Figure (e). The defects of the two samples clearly populate two distinct regions with only little overlap.
Figure 5. Histograms of the average specific surface and average porosity of the segmented defects in sample 1 (a, b) and sample 2 (c, d); scatter plot of average porosity vs. average specific surface for each defect (e).
Bearing the results of XCT and optical microscopy in mind, the results of SXRR do not surprise. The predominant defects in sample 1 are balling effect, fusing defects, and unmolten powder particles inside pores (see Figure ), which are all caused by insufficient heat input and are summarized as unprocessed powder. These defects are characterized by complex shapes and internal structures. In other words, they exhibit high specific surface and, therefore, appear as bright areas in SXRR images. In contrast, the predominant defects in sample 2 are empty pores (keyhole pores), which are caused by instabilities in the melt pool due to overheating. These defects are characterized by a rather even, round shape. Therefore, they exhibit smaller specific surface, and the edges of the spheres appear as crescents in SXRR. The average specific surface of the defects, as presented in Figure , can be used to classify the detected defects into empty (keyhole) pores on the one hand and unprocessed powder (fusing defects, incomplete melting, and balling effect) on the other hand. This distinction is of course already apparent in XCT and optical microscopy (Figure ); however, the probed volume of SXRR is much larger (12.25 mm³ against 0.35 mm³ for XCT samples), and the statistical significance of SXRR is higher. Moreover, optical microscopy only probes a 2D area. Since defects are not homogeneously distributed over the whole sample (Figure ), multiple samples would be needed for XCT or microscopy to yield results statistically as reliable as those from SXRR. SXRR enables a statistical analysis of amount, type, and spatial distribution of defects in the AM alloy (in our case the orientation of defect along the layers).
In conclusion, for the first time we successfully employed SXRR method to investigate defects in selective laser melted Ti64 alloy. It was shown that SXRR enables the detection of defects smaller than the spatial resolution of the used X-ray imaging system due to the independence of the refraction effect from defect size. Possibly, even defects smaller than the spatial resolution of other high-resolution techniques like XCT or optical microscopy can be detected. SXRR also allows the investigation of larger sample volumes than XCT. As also observed by XCT and optical microscopy, it was found that the two major defect types are keyhole pores and unprocessed powder (fusing defects). SXRR data additionally allow distinguishing defect types in a position-sensitive manner and over large volumes. SXRR also allows statistical analysis of the number of defects. It was found that AM samples built with different laser energy densities have similar frequency distribution of porosity, but very different distribution of specific surface.
Disclosure statement
No potential conflict of interest was reported by the authors.
Additional information
Funding
Related Research Data
References
- Yap CY, Chua CK, Dong ZL, et al. Review of selective laser melting: materials and applications. Appl Phys Rev. 2015;2(4):041101-1–041101-21. doi: 10.1063/1.4935926
- Thijs L, Verhaeghe F, Craeghs T, et al. A study of the microstructural evolution during selective laser melting of Ti–6Al–4 V. Acta Mater. 2010;58(9):3303–3312. doi: 10.1016/j.actamat.2010.02.004
- Vrancken B, Thijs L, Kruth J-P, et al. Heat treatment of Ti6Al4 V produced by selective laser melting: microstructure and mechanical properties. J Alloys Compd. 2012;541:177–185. doi: 10.1016/j.jallcom.2012.07.022
- Peters M, Kumpfert J, Ward CH, et al. Titanium alloys for aerospace applications. Adv Eng Mater. 2003;5(6):419–427. doi: 10.1002/adem.200310095
- Vilaro T, Colin C, Bartout JD. As-Fabricated and heat-treated microstructures of the Ti-6Al-4 V alloy processed by selective Laser melting. Metall Mater Trans A. 2011;42(10):3190–3199. doi: 10.1007/s11661-011-0731-y
- Kasperovich G, Hausmann J. Improvement of fatigue resistance and ductility of TiAl6V4 processed by selective laser melting. J Mater Process Tech. 2015;220:202–214. doi: 10.1016/j.jmatprotec.2015.01.025
- Gong H, Rafi K, Gu H, et al. Influence of defects on mechanical properties of Ti–6Al–4 V components produced by selective laser melting and electron beam melting. Mater Des. 2015;86:545–554. doi: 10.1016/j.matdes.2015.07.147
- Leuders S, Thöne M, Riemer A, et al. On the mechanical behaviour of titanium alloy TiAl6V4 manufactured by selective laser melting: fatigue resistance and crack growth performance. Int J Fatigue. 2013;48:300–307. doi: 10.1016/j.ijfatigue.2012.11.011
- Günther J, Krewerth D, Lippmann T, et al. Fatigue life of additively manufactured Ti–6Al–4 V in the very high cycle fatigue regime. Int J Fatigue. 2017;94:236–245. doi: 10.1016/j.ijfatigue.2016.05.018
- Kasperovich G, Haubrich J, Gussone J, et al. Correlation between porosity and processing parameters in TiAl6V4 produced by selective laser melting. Mater Des. 2016;105:160–170. doi: 10.1016/j.matdes.2016.05.070
- Hentschel MP, Hosemann R, Lange A, et al. Small-angle x-ray refraction in metal wires, glass-fibers and hard elastic propylenes. Acta Crystallogr A. 1987;43:506–513. German. doi: 10.1107/S0108767387099100
- Müller BR, Hentschel MP. Micro-diagnostics: X-ray and synchrotron techniques. In: C H, editor. Handbook of technical diagnostics - fundamentals and application to structures and systems. Berlin (Germany): Springer; 2013. p. 287–300.
- Müller BR, Lange A, Harwardt M, et al. Synchrotron-based micro-CT and refraction-enhanced micro-CT for non-destructive materials characterisation. Adv Eng Mater. 2009;11(6):435–440. doi: 10.1002/adem.200800346
- Görner W, Hentschel MP, Müller BR, et al. BAMline: the first hard x-ray beamline at BESSY II. Nuc Instrum Methods Phys Res Sect A. 2001;467-468:703–706. doi: 10.1016/S0168-9002(01)00466-1
- Rack A, Zabler S, Mueller BR, et al. High resolution synchrotron-based radiography and tomography using hard x-rays at the BAMline (BESSY II). Nucl Instrum Methods Phys Res Sect A. 2008;586(2):327–344. doi: 10.1016/j.nima.2007.11.020
- Lange A, Hentschel MP, Kupsch A, et al. Numerical correction of x-ray detector backlighting. Int J Mat Res. 2012;103:174–178. doi: 10.3139/146.110659
- Schindelin J, Arganda-Carreras I, Frise E, et al. Fiji: an open-source platform for biological-image analysis. Nat Meth. 2012;9(7):676–682. doi: 10.1038/nmeth.2019
- Schneider CA, Rasband WS, Eliceiri KW. NIH image to ImageJ: 25 years of image analysis. Nat Meth. 2012;9(7):671–675. doi: 10.1038/nmeth.2089
- Fensch-Kleemann FE, Harbich K-W, Hentschel MP. Microstructural characterisation of porous ceramics by x-ray refraction topography. Ceram Forum Int. 2002;79(11):E35–E38.