
 ?Mathematical formulae have been encoded as MathML and are displayed in this HTML version using MathJax in order to improve their display. Uncheck the box to turn MathJax off. This feature requires Javascript. Click on a formula to zoom.
ABSTRACT
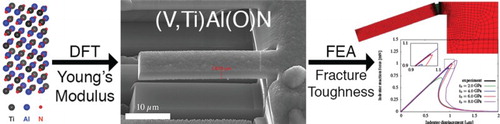
We show here, based on VAlN, TiAlN and the related oxynitrides, that the (brittle) fracture and elastic properties may be consistently modelled from quantum- to continuum mechanics using micromechanical testing to link both scales. The measured elastic moduli match closely with those predicted by density functional theory calculations. Good agreement was also observed between the micro-cantilever bending experiments and cohesive-zone-finite element modelling. These scale-bridging data serve as a baseline for future improvements of the fracture toughness of these coating systems based on microstructure and coating architecture optimization.
GRAPHICAL ABSTRACT
IMPACT STATEMENT
We link ab initio calculations with finite element modelling using micro-mechanical testing to consistently model the elastic and fracture behaviour of transition metal nitrides and oxynitrides.
1. Introduction
Transition metal aluminium (oxy)nitride coatings show great potential as protective tool coatings for cutting and forming applications [Citation1]. For example, in polymer-forming operations, they exhibit a combination of outstanding wear resistance and chemical stability against polymer adhesion [Citation2]. While the elastic properties of such coatings have been previously investigated [Citation3–5], the relationship between chemical composition and fracture toughness has only been explored selectively [Citation6,Citation7]. Given the wide possibilities in anion and cation chemistry, it is essential to establish a physical model linking the local structure and composition of the coatings with their fracture behaviour. In such a model, all scales—from the atomic bonding in the crystal (quantum mechanics) to the length scale of the microstructure (grain size, grain boundary orientations, etc.)—need to be considered. This work demonstrates the first steps in linking quantum-mechanics, micro-mechanics and meso-scale finite element models in order to probe the behaviour of these coatings and generate reference data for future microstructural design.
The relationship between chemical composition and the elastic properties of transition metal aluminium nitrides and oxynitrides has been previously investigated via density functional theory (DFT) calculations. As the valence electron concentration of the transition metal is increased, filling of sp3d2 hybridized states is observed causing an increase in bond strength and hence bulk modulus [Citation8]. Similar findings have also been reported for transition metal substitutions in MAX phases [Citation9]. As nitrogen is substituted by oxygen in titanium aluminium nitride, to Baben et al. predicted a decrease in bulk modulus and rationalized this finding by oxygen-induced bond weakening [Citation10] which was corroborated by Rotert et al. for MAlON (where M = Sc, Ti, V, Cr) [Citation3]. The observed decrease in elastic moduli with increasing oxygen concentration can hence be understood by a concomitant reduction in overall bond strength, caused on the one hand by M–O bonds which are weaker than M–N bonds in an NaCl structure (where M = V, Ti), and on the other hand by the formation of metal vacancies due to charge balancing when oxygen is substituting nitrogen [Citation4,Citation5].
Such well-controlled changes in chemistry are efficiently explored experimentally in thin-film deposition. Nanoindentation and micro-cantilever bending are therefore ideally suited for the experimental measurements of stiffness and toughness, and evaluating whether significant plasticity occurs. The latter is important in the choice of physical model to be applied during finite element simulations, for example, if crystal plasticity must be incorporated. Plasticity would be readily observable in the load–displacement curves of micro-cantilever bending tests, particularly during load partial-unload testing, where residual deformation would result in an offset of the elastic part of the curve.
To include fracture behaviour in finite element models, cohesive-zone (CZ) modelling is an efficient way of tracking the growth of a crack, especially when the crack path is known in advance [Citation11], and has been shown to be well suited to thin layers [Citation12]. In particular, Yan et al. [Citation13] investigated crack initiation and propagation along the Cu/Si interface in a nano-cantilever system. It was shown that the obtained parameters for the CZ model are universally applicable for describing cracking along other interfaces regardless of specimen dimensions, as the CZ parameters determined from 200 nm nano-cantilevers successfully described the cracking behaviour of millimeter-sized four-point-bending specimens. Yan and Shang [Citation14] applied different CZ models for proper modelling of delamination in thin films, and showed that the cohesive strength and work of separation are the dominating parameters and a bilinear CZ model—rather than an exponential or trapezoidal CZ model—more suitably describes the brittle interfacial delamination.
Using data from micro-cantilever bending allows the accurate determination of the CZ parameters, and additionally has been shown to be effective in the determination of fracture behaviour in TiN/CrN superlattice thin films [Citation15]. The damage behaviour and intergranular fracture of such hard coatings was reproduced by comparing calibrated CZ simulations with coating morphologies deformed during nanoindentation [Citation16]. Rezaei et al. [Citation16] showed that the CZ parameters such as maximum strength and fracture energy play an important role in the modelling of intergranular fracture of the hard coatings.
Here, the mechanical properties and subsequent CZ parameters are determined for vanadium and titanium-based nitride and oxynitride coatings, allowing an investigation of both anion and cation chemistry. These data are compared with those determined from ab initio calculations, thus linking numerical models with experimental measurements across a large range of scales and determining reference data for future microstructural design. It should be noted that for simplicity and readability, the investigated cubic transition metal aluminium (oxy)nitride coatings will be referred to throughout the manuscript as VAlN, VAlON, TiAlN and TiAlON. The measured compositions for each coating are detailed fully in Section 2.2.
2. Experimental and numerical methods
2.1. Film synthesis and deposition
MAlON (M = Ti and V) hard coatings were deposited by high-power pulsed magnetron sputtering (HPPMS) using a CemeCon CC-800/9 system [Citation4,Citation17]. The base pressure for all depositions was below 0.6 mPa and depositions were carried out at a floating substrate potential.
For VAlON, two rectangular magnetrons with one elemental V and one elemental Al target were employed. The Si (100) substrates were mounted at a target-to-substrate distance of 180 mm and were heated to 470C. The angle between the substrate and each cathode was 23
. The gas flows during deposition were 160 sccm Ar, 80 sccm N
for VAlN and 160 sccm Ar, 80 sccm N
and 5 sccm O
for VAlON resulting in partial pressures of 294, 148 and 1 mPa, respectively. Two Melec HPPMS generators (SIPP2000USB-10-500-S) with a frequency of 500 Hz, a duty cycle of 2.5% and a time-average power of 2225 W for the V target and 2425 W for the Al target were used. For VAlN, peak power densities of approximately 560 W/cm2 for the V target and 450 W/cm2 for the Al target were reached, whereas 520 W/cm2 for the V target and 490 W/cm2 for the Al target were reached in the case of VAlON.
For TiAlON, a rectangular magnetron with a TiAl
compound target was used. The Si (100) substrates were facing the target at a target-to-substrate distance of 80 mm and were heated to 250
C. The gas flows during deposition were 200 sccm Ar and 50 sccm N
for TiAlN and 200 sccm Ar, 50 sccm N
and 7 sccm O
for TiAlON resulting in partial pressures of 363, 94 and 1 mPa, respectively. A Melec HPPMS generator with a frequency of 800 Hz, a duty cycle of 4% and a time-average power of 3000 W resulting in peak power densities of approximately 440 W/cm2 for TiAlN and 460 W/cm2 for TiAlON was used.
2.2. Composition and structure
Chemical composition data were obtained using a JEOL JSM-6480 scanning electron microscope (SEM) with an EDAX Genesis 2000 energy dispersive X-ray spectroscopy device, utilizing an acceleration voltage of 10 kV for TiAlON and 12 kV for VAlON, with MAlN or MAlON (M = V, Ti) thin-film samples quantified by Time-of-Flight elastic recoil detection analysis (ToF-ERDA) as standards. Structural analysis of the deposited thin films was carried out by a Bruker AXS D8 Discover General Area Detection Diffraction System with an incident angle of 15 using Cu K
radiation at a voltage and current of 40 kV and 40 mA, respectively.
2.3. Density functional theory
Ab initio calculations were carried out using DFT [Citation18], as implemented in the Vienna ab initio Simulation Package [Citation19,Citation20], wherein projector augmented wave potentials [Citation21] were employed. The generalized gradient approximation [Citation22], a convergence criterion for relaxation of 0.01 meV and Blöchl corrections for the total energy [Citation23] cut-off of 500 eV were applied. Brillouin zone integration was carried out with a Monkhorst–Pack k-point mesh [Citation24].
supercells with 64 atoms for V
Al
N and 62 atoms for (V
Al
)
(O
N
)
were utilized, while for Ti
Al
N and (Ti
Al
)
(O
N
)
supercells with 128 and 120 atoms were used, respectively.
For (VAl
)
(O
N
)
, two vacancies (one Al and one V) and in the case of (Ti
Al
)
(O
N
)
eight vacancies (four Al and four Ti) were introduced ad hoc to ensure quasi-neutrality [Citation4,Citation5]. Full structural relaxation was performed for every configuration and the Birch–Murnaghan equation of state [Citation25] was utilized to obtain the equilibrium volume. Elastic constants were calculated according to the method of Music et al. [Citation26], and Hill's approximation [Citation27] was employed to obtain shear moduli.
2.4. Micro-mechanical testing
Nanoindentation was carried out in a Hysitron TI-900 TriboIndenter and Young's modulus of each film was determined by the Oliver–Pharr method [Citation28]. A Berkovich diamond tip was used in load-controlled mode and the maximum force of 10 mN resulted in a contact depth of <5% of the coating thickness. A minimum of 16 indentation experiments was carried out for each composition, and the tip area function was determined with a fused silica standard. Poisson's ratio values obtained in this work by DFT calculations were used to calculate Young's modulus.
Subsequently, cantilevers were milled using an FEI Helios 600i focussed ion beam (FIB), based on the original method of Di Maio and Roberts [Citation29]. In order to produce a simple geometry for simulation, beams were milled on the sample edge to produce a constant, rectangular cross-section along the length of the beam. In all the samples, the coating depth was similar, and therefore these beams had an approximate length of 25 , width of 6
and depth equal to the coating thickness of 3
. Initial cuts were made at 21 nA, with the beams subjected to a final ‘polishing’ beam current of 0.23 nA. Notches were made ∼2
from the fixed end of the beam at the lowest available current of 1.1 pA, with all milling taking place at 30 kV.
Testing was carried out in situ using a Nanomechanics InSEM III inside a Tescan Vega-3 SEM. A cube corner indenter was used to displace the free end of the beam at a constant load rate of 0.1 mN/s until failure was observed. The recorded load–displacement data were converted to stress–strain data using simple Euler–Bernoulli beam theory (Equations (Equation1(1)
(1) ) and (Equation2
(2)
(2) )), and fracture toughness (Equation (Equation3
(3)
(3) )) was calculated using the stress intensity factor and geometry function as determined by Bohnert et al. [Citation30] for tungsten micro-cantilever beams of a similar rectangular geometry.
is the geometry factor, and the beam dimensions used in these equations are given in Figure . These data are given in Table . The required notch depth was determined from post-mortem SEM of the fracture surfaces. Multiple load partial-unload experiments to increasing loads were carried out to investigate whether any plastic deformation might occur prior to fracture.
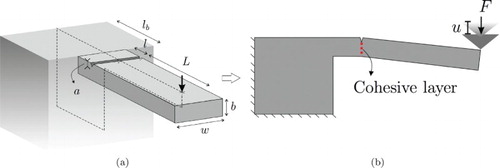
Figure 1. (a) Experimental setup and dimensions. (b) Simplified 2D model using the plane strain assumption and linear isotropic elastic material.
Failure was observed to occur vertically through the beam, in between the growth-induced columns. The nature of fracture can thus be described as intergranular, but given the nanometric grain size of the material, and the tendency of grains to form these tightly packed columns, it is more accurately described as ‘intercolumnar’. This fracture direction was observed experimentally in every beam, and was therefore used to determine the location of the CZ elements, described below:
(1)
(1)
(2)
(2)
(3)
(3)
2.5. Finite element simulation
A schematic drawing of the micro-cantilever beam test is shown in Figure . Since the width of the beam w is large compared to the thickness b (approx. 3:1), a 2D configuration assuming plane strain was simulated. This was validated by a comparison with a 3D model, the result of which is shown in Figure (a). The beam is free on the right side where the indenter hits the end, and fixed boundary conditions were applied to the bulk material that does not move during the experimental measurements. The length was chosen to be large enough to minimise boundary effects, with the indenter force F and the indenter vertical displacement u defined by the experimental measurements. To model the fracture and crack propagation inside the micro-cantilever beam, a CZ was introduced vertically along the observed fracture surface, shown by a red dashed line in Figure .
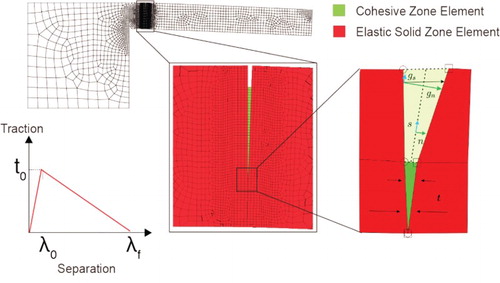
The CZ model is based on a bilinear traction-separation law, with details reported previously [Citation16]. As shown in Figure , the maximum strength () in the CZ, the amount of separation (
) to reach this strength and the maximum separation (
) at full failure as well as a shear-parameter β are the main inputs for the introduced CZ model.
Figure 2. Finite element mesh of the structure as well as the traction-separation law for the CZ. CZ elements are shown in green and elastic solid elements in red.
The fracture energy is given by Equation (Equation4
(4)
(4) ), where
, E and ν are the fracture toughness, elastic modulus and Poisson's ratio of the coating, respectively.
(4)
(4)
The fracture energy was determined by the experimental measurement, and the remaining CZ parameters given by
, β and
. These parameters are varied in the numerical model to fit the finite element results to the experimental measurements. In Figure , the measured indenter reaction force, F, versus its vertical displacement, u, is shown in black. Due to the brittle nature of the coatings, the reaction force behaves elastically before the sudden fracture. This was verified by partial-unloading tests showing no deviation from reversible elastic loading until fracture. In the presented simulation results, the arclength method is utilized to capture snapback behaviour. In this method, it is possible to decrease the indenter's displacement and force simultaneously to find the equilibrium state in the system [Citation16,Citation31], allowing the study of post-fracture behaviour—such as the residual kinetic energy—that is impossible to measure experimentally. It is important that this post-fracture range is computable, such that the model is demonstrably correct and the parameters well chosen, because a generally applicable damage model must be robust enough to cope with the numerically challenging situation of decreasing stress levels in a complex structure subjected to inhomogeneous stress states, and the reporting of this range is common practice [Citation32,Citation33]. That the chosen method can analyse a micro-cantilever, where stress and damage are severely localized around a pre-made notch and straight fracture plane, illustrates this well; the applied algorithm can cope with extreme and rapid drops in stress levels.
Figure 3. (a) A comparison of the load–displacement curves for a 3D finite element model with no mesh refinement and the result from the 2D model used in this work, showing excellent agreement. (b) Variation of β with GPa,
and
, showing the insensitivity of the model to the shear parameter.
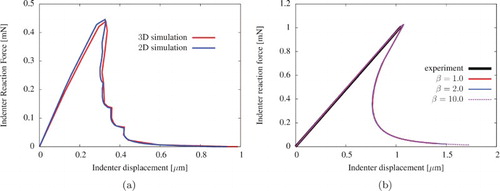
The parameter β, which controls the contribution of the shear traction, , does not have a significant effect on the final result (Figure (b)), because the given loading and boundary conditions mean that the crack opening mode in the normal direction (mode I) is dominant. β is therefore set to 1.0.
The maximum strength in the CZ () is set such that the experimentally measured maximum force is obtained in the simulation. According to our results, for VAlON the best fit to the experimental measurements is obtained by setting
GPa and
, such that
is very small, and the elastic response of the finite elements in the cantilever beam is not affected by the introduction of CZ elements [Citation34].
3. Results
3.1. Composition and structure
The following compositions for the films were measured: (VAl
)
(O
N
)
, (V
Al
)
(O
N
)
, (Ti
Al
)
(O
N
)
and (Ti
Al
)
(O
N
)
. Structural analysis revealed a cubic sodium chloride structure for all investigated hard coatings. No evidence for the formation of a hexagonal phase was obtained.
3.2. Micro-Mechanical testing and DFT
The experimentally determined moduli for the samples are given in . Young's moduli determined via ab initio calculations for VAlON were obtained using
, where G is the shear modulus and B is the bulk modulus. From ab initio calculations, a decrease of Young's modulus from 492 GPa for VAlN to 442 GPa for VAlON is predicted. Similarly, Young's modulus values decrease from 463 GPa for TiAlN to 330 GPa for TiAlON. Furthermore, Poisson's ratios (ν) were obtained from DFT calculations by
and values of 0.212 and 0.221 are obtained for VAlN and VAlON, respectively, while TiAlN and TiAlON exhibit Poisson's ratio values of 0.211 and 0.215, respectively.
Table 1. Elastic properties of MAlON.
The above equations for E and ν assume elastic isotropy. As shown by Zhou et al. [Citation35] for CrAlN and Tasnádi et al. [Citation36] for TiAlN, for the materials investigated here with a transition metal-to-aluminium ratio close to one, Zener's anisotropy factor is ∼1 and ∼1.2, respectively. This, in addition to the fine, polycrystalline microstructure produced during thin-film deposition, means it is reasonable to treat these films as elastically isotropic.
The experimentally determined Young's modulus values follow the predicted trend and decrease with increasing oxygen concentration from GPa for VAlN to
GPa for VAlON and
GPa for TiAlN to
GPa for TiAlON. It can be observed that the experimentally determined values of elastic modulus are in good agreement (within 15%) with the values as predicted by DFT calculations, which is reasonable for the exchange-correlation functional employed here [Citation37]. As the coating thickness (∼3
) is large compared to the indentation depth, the values of Young's modulus as determined by nanoindentation are free from substrate effects [Citation38].
For the micro-cantilever tests, the stress–strain curve from each material is shown in black in , for comparison with the FEM fit. The deformation is purely elastic until the failure stress is reached, at which point fracture takes place in a single, unstable event. This would be expected for brittle materials in this testing geometry but is also shown directly by repeatedly loading a beam to increasing values of strain (Figure (a)), where the overlapping load–displacement data show no plastic deformation or stable crack growth before failure. The data acquisition rate of the InSEM was set to 500 Hz, so the crack has propagated through the beam in under 2 ms. An example fracture surface is shown in Figure (b), demonstrating the intercolumnar nature of the fracture process. Similar fracture surfaces were observed for all samples. At least three beams were tested in each material, with the standard deviation given as the error bars in Table . Beam width is measured at the top surface along the notch, and depth measured to the highest point of the bottom surface (i.e. as small a value as possible), as the beams show a small, but common [Citation15], deviation from a perfect rectangle. The cantilever with a fracture toughness closest to the average value was designated as a representative beam for each material, and used for the subsequent FEM analysis.
Figure 4. (a) Three stress–strain curves from a beam tested to increasing values of strain. The overlapping curves indicate no plastic deformation nor stable crack growth before fracture occurs. (b) Fracture surface of a TiAlON micro-cantilever. Intercolumnar fracture can be seen running from the FIB-machined notch.
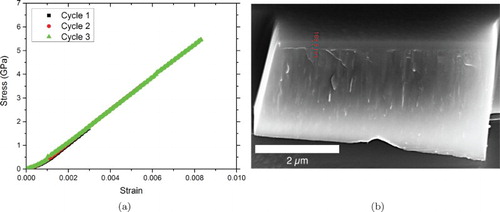
Figure 5. Experimental and simulated load–displacement data for (a) VAlN, (b) VAlON, (c) TiAlN, and (d) TiAlON. Experimental data shown in black, with the variation of for the four materials, with
m,
. The best fit to the experimental data is given by the dashed line. Values of fracture energy are: 27.08, 26.3, 11.17 and
for VAlN, VAlON, TiAlN and TiAlON, respectively. The variation of
is shown for VAlON to demonstrate the sensitivity of this parameter.
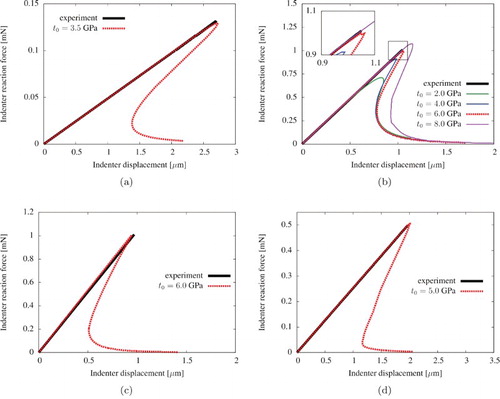
Table 2. Fracture properties as determined from micro-cantilever tests.
3.3. Finite element simulation
The final force–displacement curves obtained by finite element modelling for all four materials are shown in Figure with the experimental data shown in black. Different values of are shown to allow assessment of the sensitivity to this fitting parameter. In Table , all the obtained CZ parameters for different types of coating are summarized.
Table 3. CZ element parameters for the best fit to the experimental data for fracture in VAl(O)N and TiAl(O)N.
4. Discussion
We first discuss the nanoindentation data. The experimentally determined values of Young's modulus are for all materials slightly lower than the predicted ones, which may be largely attributed to a temperature influence. The predicted Young's moduli were obtained at ground-state (0 K), whereas the experimental Young's modulus values were obtained at room temperature. It is well known that Young's modulus decreases with increasing temperature, with a drop of ∼8.5% predicted in CrAl
N between 50 K and room temperature [Citation39]. This work by Music et al. also shows the strong influence of residual stress on the measured values of Young's modulus: an increase of approximately 150 GPa over the whole temperature range of 0–700 K from a residual compressive stress of 4 GPa. We therefore conclude that as the experimental Young's moduli are within 15% of the predicted values by DFT calculations, a good agreement is obtained. According to Paier et al. [Citation37] the magnitude of the obtained deviations between theory and experiment is in line with the exchange-correlation functionals employed here. Furthermore, based on this good agreement it appears that the presence of (dense) column boundaries discussed previously in the context of Figure (b) does not affect the elastic modulus in an adverse way. Hence, the ab initio data, which cannot consider the presence of column boundaries, do represent the elastic behaviour of the as-deposited thin films within the expected deviations [Citation37].
The observed decrease in elastic moduli with increasing oxygen concentration can be understood by a concomitant reduction in overall bond strength, caused on the one hand by M–O bonds that are weaker than M–N bonds in an NaCl structure [Citation3] (where M = V, Ti), and on the other hand by the formation of metal vacancies due to charge balancing when oxygen is substituting nitrogen [Citation4,Citation5].
Looking at the micro-fracture tests, the values of Young's modulus predicted by DFT can also be used to calculate a theoretical value of fracture toughness for each material using Equation (Equation5(5)
(5) ) [Citation40], which essentially considers the energy of separation of two atomic planes, i.e. perfectly brittle fracture.
(5)
(5) Naturally, Irwin's modification to this criterion should be considered [Citation41], namely that fracture occurs according to Equation (Equation6
(6)
(6) ), where σ is the applied stress, a is the flaw size,
is the surface energy and
is the energy dissipated through plastic work
(6)
(6) In the micro-cantilever tests, no plastic deformation is observed (
), therefore either Equation (Equation5
(5)
(5) ) or Equation (Equation6
(6)
(6) ) could be used to calculate a theoretical value of fracture toughness. However, the required values of surface energy are not present in the literature for these materials at this point. Nevertheless, as the bond energy used in DFT defines both Young's modulus [Citation42] and the surface energy [Citation43], and assuming that the composition-induced changes in bond energy affect Young's modulus and surface energy with similar trends, then the trend of changes in elastic modulus should also be seen in fracture toughness. Namely, this means lower values of fracture toughness in oxynitrides with respect to nitrides, and that titanium-based coatings should be more brittle than vanadium-based ones. The nitride trends are also consistent with available Cauchy's pressure data [Citation1,Citation44].
These predicted trends in toughness can be compared with the experimentally measured values from micro-cantilever tests (Table ), where the measured fracture toughness data confirm the prediction that the vanadium-based and pure nitride materials are tougher than the other materials. The trend in the experimentally observed fracture behaviour is therefore consistent with the quantum-mechanically based predictions. This trend is also observable in the chromium-based coatings measured by Wang [Citation7], with fracture toughness increasing from 1.1 MPa to 2.8 MPa
when moving from CrN (E=271 GPa) to CrAlN (E=315 GPa). These values of fracture toughness—as well as the 2–3 MPa
measured by Liu [Citation6] in the Cr–Al–Si–N system (
GPa)—agree well with those measured in this work. Of note is the finding by Liu [Citation6] that the addition of silicon caused the formation of equiaxed grains, increasing the fracture toughness without a corresponding increase in Young's modulus. The coatings in this work all fail in a planar fashion, with similar microstructures, leaving only the surface energy and Young's modulus as parameters in their fracture behaviour.
Unlike indentation-based methods, cantilevers do not require any assumptions about crack geometries [Citation45], and with no complications from plastic deformation around the notch, as seen here, they are therefore most capable of obtaining true values of fracture toughness for these coatings. Additionally, as the silicon substrate is cut away, there are no residual thermal stresses between coating and substrate, and only coherency strains may remain as the energetic condensation of metal ions causes formation of defects between crystalline domains, or interstitial incorporation of energetic species.
In this work, the crack path during failure is always intercolumnar, as is commonly observed in the fracture of these materials. Therefore, the second step in being able to model these materials and their mechanical properties would be to include microstructural considerations, as microstructure clearly has a strong effect on fracture toughness. As Yan et al. [Citation13] showed that their CZ parameters were universally applicable for describing cracking, those generated here are likely suitable for future microstructural design so long as this intercolumnar behaviour continues. These parameters were determined by generating a finite element model for a beam in each material, capturing the dimensions of the cantilever. The parameter fitting demonstrated that the test geometry is insensitive to the effect of shear, and therefore β, which may change in a different coating microstucture, such as an equiaxed geometry. It was also found that the best fit in the elastic region is with . Therefore, with
fixed by experiment, only
is to be determined. The final fit between model and experiment is excellent, indicating the model reproduces the system well.
5. Conclusions
Titanium and vanadium aluminium nitride and oxynitride coatings were deposited by HPPMS. The mechanical properties of these coatings were investigated by a combination of nanoindentation and micro-cantilever fracture toughness tests. Additional modelling using cohesive-zone elements was done to produce useful reference data for future improvements based upon developments in coating architecture, such as multilayers, and in all cases a good agreement between experiment and model was found. The measured elastic moduli show good agreement with those predicted by DFT calculations. Based on the predicted and experimentally verified larger elastic moduli for the vanadium-based material systems compared to the titanium-based systems, the former systems are expected to exhibit larger values of fracture toughness. Furthermore, as the nitride systems show larger elastic moduli as the corresponding oxynitride systems, larger fracture toughness values are expected for the nitrides. These expected trends are reproduced in the experimental fracture toughness data.
Disclosure statement
No potential conflict of interest was reported by the authors.
ORCID
James S.K.-L. Gibson http://orcid.org/0000-0002-2274-4057
Sandra Korte-Kerzel https://orcid.org/0000-0002-4143-5129
Additional information
Funding
Related Research Data
References
- Music D, Geyer RW, Schneider JM. Recent progress and new directions in density functional theory based design of hard coatings. Surf Coat Technol. 2016;286:178–190. doi: 10.1016/j.surfcoat.2015.12.021
- Cunha L, Andritschky M, Pischow K, et al. Performance of chromium nitride based coatings under plastic processing conditions. Surf Coat Technol. 2000;133-134:61–67. doi: 10.1016/S0257-8972(00)00875-6
- Rotert SJ, Music D, to Baben M, et al. Theoretical study of elastic properties and phase stability of M0.5Al0.5N1xOx (M = Sc, Ti, V, Cr). J Appl Phys. 2013;113(8): 083512.
- Shaha KP, Rueß H, Rotert S, et al. Nonmetal sublattice population induced defect structure in transition metal aluminum oxynitrides. Appl Phys Lett. 2013;103(22): 221905. doi: 10.1063/1.4833835
- Hans M, to Baben M, Music D, et al. Effect of oxygen incorporation on the structure and elasticity of Ti–Al–O–N coatings synthesized by cathodic arc and high power pulsed magnetron sputtering. J Appl Phys. 2014;116(9): 093515. doi: 10.1063/1.4894776
- Liu S, Wheeler JM, Davis CE, et al. The effect of Si content on the fracture toughness of CrAlN/Si3N4 coatings. J Appl Phys. 2016;119(2): 025305. doi: 10.1063/1.4939758
- Wang Q, Zhou F, Yan J. Evaluating mechanical properties and crack resistance of CrN, CrTiN, CrAlN and CrTiAlN coatings by nanoindentation and scratch tests. Surf Coat Technol. 2016;285:203–213. doi: 10.1016/j.surfcoat.2015.11.040
- Rovere F, Music D, Ershov S, et al. Experimental and computational study on the phase stability of Al-containing cubic transition metal nitrides. J Phys D – Appl Phys. 2010;43(3): 035302. doi: 10.1088/0022-3727/43/3/035302
- Music D, Sun Z, Ahuja R, et al. Electronic structure of M2AlC (0001) surfaces (M = Ti,V,Cr). J Phys: Condens Mat. 2006;18(39):8877–8881.
- to Baben M, Raumann L., Schneider JM. Phase stability and elastic properties of titanium aluminum oxynitride studied by ab initio calculations. J Phys D: Appl Phys. 2013;46(8): 084002. doi: 10.1088/0022-3727/46/8/084002
- Ortiz M, Pandolfi A. Finite-deformation irreversible cohesive elements for three-dimensional crack-propagation analysis. Int J Numer Methods Eng. 1999;44(9):1267–1282. doi: 10.1002/(SICI)1097-0207(19990330)44:9<1267::AID-NME486>3.0.CO;2-7
- Abdul-Baqi A, Van der Giessen E. Numerical analysis of indentation-induced cracking of brittle coatings on ductile substrates. Int J Solids Struct. 2002;39(6):1427–1442. doi: 10.1016/S0020-7683(01)00280-3
- Yan Y, Sumigawa T, Shang F, et al. Cohesive zone criterion for cracking along the Cu/Si interface in nanoscale components. Eng Fract Mech. 2011;78(17):2935–2946. doi: 10.1016/j.engfracmech.2011.08.010
- Yan Y, Shang F. Cohesive zone modeling of interfacial delamination in PZT thin films. Int J Solids Struct. 2009;46(13):2739–2749. doi: 10.1016/j.ijsolstr.2009.03.002
- Hahn R, Bartosik M, Soler R, et al. Superlattice effect for enhanced fracture toughness of hard coatings. Scripta Mater. 2016;124:67–70. doi: 10.1016/j.scriptamat.2016.06.030
- Rezaei S, Wulfinghoff S, Reese S. Prediction of fracture and damage in micro/nano coating systems using cohesive zone elements. Int J Solids Struct. 2017;121:62–74. doi: 10.1016/j.ijsolstr.2017.05.016
- Gnoth C, Kunze C, Hans M, et al. Surface chemistry of TiAlN and TiAlNO coatings deposited by means of high power pulsed magnetron sputtering. J Phys D: Appl Phys. 2013;46(8): 084003. doi: 10.1088/0022-3727/46/8/084003
- Hohenberg P, Kohn W. Inhomogeneous electron gas. Phys Rev B. 1964;136(3B):B864. doi: 10.1103/PhysRev.136.B864
- Kresse G, Hafner J. Ab initio molecular-dynamics for liquid-metals. Phys Rev B. 1993;47(1):558–561. doi: 10.1103/PhysRevB.47.558
- Kresse G, Hafner J. Ab-initio molecular-dynamics simulation of the liquid-metal amorphous-semiconductor transition in germanium. Phys Rev B. 1994;49(20):14251–14269. doi: 10.1103/PhysRevB.49.14251
- Kresse G, Joubert D. From ultrasoft pseudopotentials to the projector augmented-wave method. Phys Rev B. 1999;59(3):1758–1775. doi: 10.1103/PhysRevB.59.1758
- Perdew JP, Burke K, Ernzerhof M. Generalized gradient approximation made simple. Phys Rev Lett. 1996;77(18):3865–3868. doi: 10.1103/PhysRevLett.77.3865
- Blöchl PE, Jepsen O, Andersen OK. Improved tetrahedron method for brillouin-zone integrations. Phys Rev B. 1994;49(23):16223–16233. doi: 10.1103/PhysRevB.49.16223
- Monkhorst HJ, Pack JD. Special points for Brillouin-zone integrations. Phys Rev B. 1976;13(12):5188–5192. doi: 10.1103/PhysRevB.13.5188
- Birch F. Finite strain isotherm and velocities for single-crystal and polycrystalline NaCl at high-pressures and 300∘K. J Geophys Res. 1978;83(B3):1257–1268. doi: 10.1029/JB083iB03p01257
- Music D, Takahashi T, Vitos L, et al. Elastic properties of Fe–Mn random alloys studied by ab initio calculations. Appl Phys Lett. 2007;91(19): 191904. doi: 10.1063/1.2807677
- Hill R. The elastic behaviour of a crystalline aggregate. Proc Phys Soc Sec A. 1952;65(5):349.354 doi: 10.1088/0370-1298/65/5/307
- Oliver WC, Pharr GM. An improved technique for determining hardness and elastic modulus using load and displacement sensing indentation experiments. J Mater Res. 1992;7(6):1564–1583. doi: 10.1557/JMR.1992.1564
- Di Maio D, Roberts SG. Measuring fracture toughness of coatings using focused-ion-beam-machined microbeams. J Mater Res. 2005;20(2):299–302. doi: 10.1557/JMR.2005.0048
- Bohnert C, Schmitt NJ, Weygand SM, et al. Fracture toughness characterization of single-crystalline tungsten using notched micro-cantilever specimens. Int J Plast. 2016;81:1–17. doi: 10.1016/j.ijplas.2016.01.014
- Brepols T, Wulfinghoff S, Reese S. Gradient-extended two-surface damage-plasticity: micromorphic formulation and numerical aspects. Int J Plast. 2017;97:64–106. doi: 10.1016/j.ijplas.2017.05.010
- Moes N, Belytschko T. Extended finite element method for cohesive crack growth. Eng Fract Mech. 2002;69(7):813–833. doi: 10.1016/S0013-7944(01)00128-X
- Harper PW, Hallett SR. Cohesive zone length in numerical simulations of composite delamination. Eng Fract Mech. 2008;75(16):4774–4792. doi: 10.1016/j.engfracmech.2008.06.004
- Blal N, Daridon L, Monerie Y, et al. Artificial compliance inherent to the intrinsic cohesive zone models: criteria and application to planar meshes. Int J Fracture. 2012 Nov;178(1):71–83. doi: 10.1007/s10704-012-9734-y
- Zhou L, Holec D, Mayrhofer PH. First-principles study of elastic properties of cubic Cr1−xAlxN alloys. J Appl Phys. 2013;113(4): 043511.
- Tasnádi F, Abrikosov I, Rogström L, et al. Significant elastic anisotropy in Ti1−xAlxN alloys. Appl Phys Lett. 2010;97(23): 231902. doi: 10.1063/1.3524502
- Paier J, Marsman M, Hummer K, et al. Screened hybrid density functionals applied to solids. J Chem Phys. 2006;124(15): 154709. doi: 10.1063/1.2187006
- Bull SJ. Nanoindentation of coatings. J Phys D: Appl Phys. 2005;38(24):R393–R413. doi: 10.1088/0022-3727/38/24/R01
- Music D, Banko L, Rueß H, et al. Correlative plasma-surface model for metastable Cr–Al–N: Frenkel pair formation and influence of the stress state on the elastic properties. J Appl Phys. 2017;121(21): 215108. doi: 10.1063/1.4985172
- Guo JG, Zhou LJ, Zhao YP. Size-dependent elastic modulus and fracture toughness of the nanofilm with surface effects. Surf Rev Lett. 2008;15(5):599–603. doi: 10.1142/S0218625X08011901
- Janssen M, Zuidema J, Wanhill R. Fracture mechanics. 2nd ed. Oxford, UK: CRC Press; 2004.
- Schnabel V, Köhler M, Music D, et al. Ultra-stiff metallic glasses through bond energy density design. J Phys: Condens Mat. 2017;29(26): 265502.
- Methfessel M, Hennig D, Scheffler M. Trends of the surface relaxations, surface energies, and work functions of the 4d transition metals. Phys Rev B. 1992;46(8):4816–4829. doi: 10.1103/PhysRevB.46.4816
- Ou P, Wang J, Shang S, et al. A first-principles study of structure, elasticity and thermal decomposition of Ti1−xTMxN alloys (TM = Y, Zr, Nb, Hf, and Ta). Surf Coat Technol. 2015;264:41–48. doi: 10.1016/j.surfcoat.2015.01.024
- Sebastiani M, Johanns KE, Herbert EG, et al. Measurement of fracture toughness by nanoindentation methods: recent advances and future challenges. Curr Opin Solid State Mater Sci. 2015;19(6):324–333. doi: 10.1016/j.cossms.2015.04.003