
ABSTRACT
In this paper, 0.7Pb(Mg1/3Nb2/3)O3-0.3PbTiO3 (PMN-30%PT) single crystal samples were poled using an alternating current (electric field) poling (ACP) method. Compared to the traditional poling method, the piezoelectric coefficient, free and clamped dielectric constants were improved more than 21%. X-ray diffraction result suggests the existence of monoclinic phase (MA) in ACP samples and piezoresponse force microscopy (PFM) result further depicts the finer engineered domain structures. The ACP sample also showed the unique phase transition sequences during the depoling process. Our work could provide a novel domain engineered method to enhance piezoelectric properties of PMN-PT single crystal.
GRAPHICAL ABSTRACT
IMPACT STATEMENT
Piezoelectric and dielectric properties of relaxor-PT single crystals can be significantly enhanced by employing the new alternating current poling method, attributing to the unique heterogenous domain structure containing unprecedented domain wall density.
Introduction
Solid solution of (1-x)Pb(Mg1/3Nb2/3)O3-xPbTiO3 (PMN-xPT) and the other relaxor ferroelectric single crystals have attracted intense research interest over the past decades because of their outstanding piezoelectric electromechanical properties, and the associated applications in sensors, actuators, and transducers [Citation1–4]. In particular, their high piezoelectric coefficient and dielectric permittivity are critically important in advanced transducers [Citation3,Citation5,Citation6]. There are several ways to manipulate dielectric and piezoelectric properties of PMN-xPT single crystal, such as modifying the compositions [Citation7], applying nanocomposite electrodes [Citation8,Citation9], and utilizing different poling methods [Citation9,Citation10]. Among these methods, using different poling methods has the greatest potential from its advantages of low cost and high efficiency. In general, direct current (electric field) poling (DCP) method is widely used in academia and industry [Citation11]. DCP-based domain engineering study by Wada et al. revealed that piezoelectricity of domain engineered BaTiO3 crystals can be enhanced from higher domain wall densities [Citation12,Citation13]. Recently, Yamamoto and Yamashita et al. reported an alternating current (electric field) poling (ACP) method that could further enhance the dielectric and piezoelectric properties of PMN-PT crystals [Citation10,Citation14]. While ACP may be a promising method for piezoelectric material properties enhancement, it has not been reported whether or not the domain engineering mechanism realized in DCP is similarly derived through the ACP, and this question needs to be answered for crystal applications.
One important stability concern in the piezoelectric materials is aging, which can be observed in most of the ferroelectrics such as barium titanate (BaTiO3) and lead zirconate titanate (PZT) [Citation15–20]. Devonshire and Plessner described that aging is a gradual transformation from the free state to the clamped state, which means the domain boundary migrates from high energy polarizability to lower energy polarizability [Citation15,Citation21]. Aging strongly affects the application of ferroelectrics, and many investigations have been devoted to elucidating the aging phenomena in relaxor ferroelectrics [Citation22,Citation23]. However, there are only a few reports that mention the aging characteristics of PMN-PT single crystals [Citation24], not mentioning the influence brought from the new ACP method.
This study reports the different poling conditions of DCP and ACP for PMN-30%PT single crystals, and their aging characteristics. The piezoelectric and dielectric properties of DCP and ACP crystal samples were measured. X-ray diffraction (XRD) was used to mark the field-induced phase transition from rhombohedral to monoclinic phase (MA) in ACP samples, while piezoresponse force microscopy (PFM) was utilized to find the domain structures in ACP samples. The temperature dependent dielectric constant curves of both ACP and DCP samples were measured and their phase transition sequences during the depoling process were compared.
The [001]-grown PMN-30%PT single crystal (CTS Corporations, IL, USA) was cut, diced and polished to obtain samples with dimension of 9.2 × 9.2 × 0.6 mm3. Titanium/gold electrodes (5/100 nm) were sputtered on the top and bottom surfaces of the samples. For the DCP samples, an external electric field (E-field) of 10 kV/cm was applied to pole the sample at room temperature for 30 min [Citation11]. Its piezoelectric coefficients and dielectric constants were then measured using a Berlincourt-type d33 meter (YE2730A d33 meter, APC International Ltd., Mackeyville, PA, USA) and an LCR meter (KEYSIGHT technologies, E4980A, Santa Clara, CA, USA). The free dielectric permittivity () and clamped dielectric permittivity (
) were calculated from the measured capacitance by using an impedance analyzer (Agilent 4294A, Palo Alto, CA, USA) at 1 kHz and the frequency at two times of anti-resonant frequency (2fa), respectively. The clamped dielectric permittivity was measured because of the fact that electrical impedance of a transducer is determined by
and dimensions of the piezoelectric material [Citation4]. For ACP samples, a bipolar triangular voltage with a designated frequency (e.g. f = 1 Hz) was applied to the samples to generate an alternating E-field (e.g. with the peak-to-peak 10 kV/cm). The ACP samples were poled for up to 20 cycles or 20 seconds. After each poling process, the piezoelectric coefficient, free (
) and clamped (
) dielectric permittivity were measured by the d33 meter and impedance analyzer mentioned earlier, respectively. Structure properties of PMN-30%PT single crystal with different poling conditions were studied using an X-ray diffractometer (SmartLab, Rigaku, Tokyo, Japan) with monochromatic CuKα radiation. The domain morphology was observed and characterized by a piezoresponse force microscopy, PFM (Dimension Icon, Bruker, Santa Barbara, CA, USA). The temperature dependent dielectric properties of PMN-PT single crystal were acquired by an LCR meter at every 1°C in a temperature range of 25°C to 200°C. During the measurement, the sample was heated in a silicone oil bath with a heating rate of 1°C/min to ensure a homogeneous heating process. For repeating the experiments, the five samples were fully depoled in silicone oil at 250°C for 30 min, with top and bottom electrodes shorted during the depoling process. Each sample was tested three times to collect data.
The piezoelectric coefficients of PMN-30%PT single crystals with different poling conditions (ACP and DCP) are shown in Figure (a). The inset is an illustration showing the poling conditions for ACP and DCP methods. In this study, poling field is 10 kV/cm (peak to peak in ACP) and along [001] direction, and the ACP frequency is 1 Hz. The poling time is 30 min for DCP samples and less than 1 min (ACP-cycle dependent) for ACP samples. Five samples were prepared, and each sample was tested three times. The error bar in Figure represents these measured data variations.
Figure 1. The piezoelectric and dielectric properties of ACP and DCP samples: (a) the piezoelectric coefficient of DCP and ACP with different number of cycles; the inset shows the poling electric field and duration time; (b) the free and clamped dielectric constant of DCP and ACP with different number of cycles; (c) the dielectric constant of five samples under unpoled, DCP and ACP conditions, where the error bar shows the deviation of three tests from each sample; (d) the dielectric constant of DCP and ACP samples at different poling electric fields.
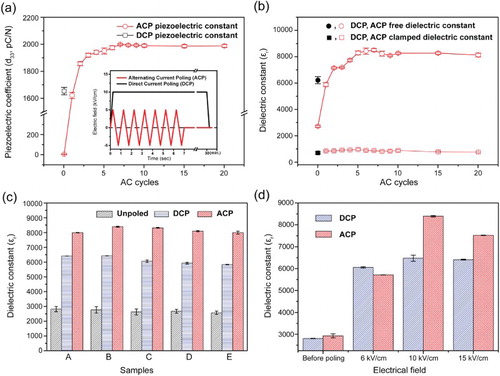
The applied E-field used in this study is 10 kV/cm. The reason why 10 kV/cm is chosen is first because it is about four times of the coercive field (Ec) of PMN-PT crystals (∼2.3 kV/cm)[Citation25] to make the completely poling, also the further test result (shown in Figure (d)) shows both ACP and DCP samples have highest dielectric constant at 10 kV/cm poling field. In Figure (a), the piezoelectric coefficient of the sample poled with the ACP method (ACP sample) is 2000 ± 10 pC/N which is 21% higher than the sample poled with the conventional DCP method (DCP sample), 1650 ± 20 pC/N. It should be noted that high piezoelectric coefficients are observed in ACP samples which are poled for less than 1 min. The poling process of DCP samples takes 30 min with E-field of 10 kV/cm. With 2 alternative cycles (ACP-cycle) or 2 seconds, the ACP sample has exhibited a piezoelectric coefficient of 1850 ± 10 pC/N, which is already higher than that of the DCP samples. Free and clamped dielectric constants of the PMN-30%PT single crystal with different poling conditions are shown in Figure (b). Free and clamped dielectric constants of ACP sample were 8500 ± 100 and 970 ± 70, respectively. These values are larger than the DCP samples, which is 6120 ± 270, and 720 ± 70, respectively. Compared to the PMN-PT with DCP method, d33, , and
were improved 21%, 38% and 35%, respectively. Both Figure (a,b) also show that piezoelectric coefficient and dielectric constant of the ACP samples increase with the ACP-cycle up to 7 (or 7 seconds), and these values saturated after 7 cycles. The saturated piezoelectric coefficients and dielectric constants were at around 1980 ± 5 pC/N and 8140 ± 150, respectively. To confirm the stability of the ACP method, Figure (c) shows good dielectric constant consistency (< 10%) among five ACP samples, and the detailed standard deviations are provided in supplementary Table S1. Thus, the ACP single crystals showed clearly enhanced piezoelectric and dielectric properties over the DCP samples. In addition, electromechanical coupling coefficient (kt) of ACP and DCP samples are calculated according to the IEEE standards, using the following equations [Citation26].
(1)
(2) where
and
are the resonance and antiresonance frequency, respectively. The DCP and ACP samples both showed the similar coupling coefficient kt = 0.57.
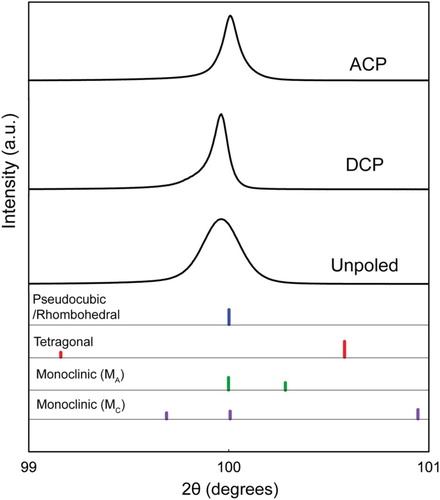
Figure . shows (400) peaks of PMN-30%PT single crystal with different poling conditions. XRD reference patterns are also listed in the bottom of the Figure . According to the phase diagram and electric field-temperature diagram [Citation27,Citation28], the field-induced phase transition for PMN-30%PT single crystal under the electric field along [001] direction will be rhombohedral (R) → monoclinic (MA) → monoclinic (MC)→ tetragonal (T). (The notation MA/ MC follows definitions of Vanderbilt and Cohen [Citation29]). Thus, the unpoled sample peak marks the R phase. Since the peak center of the DCP sample is almost at the same 2θ position as the unpoled sample peak, it shows that DCP sample is still in the same R phase. In contrast, the peak center of ACP is obviously shifted, showing the likely existence of an MA phase based on the reference pattern.
Figure 2. The XRD (400) reflection of PMN-PT single crystal resulting from different poling methods, including ACP, DCP and unpoled sample in the room temperature. The peak intensities have been normalized and the reference patterns are shown in the bottom of the figure.
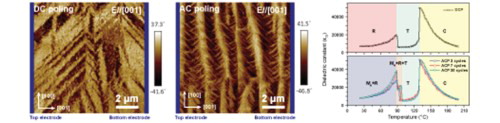
In addition to the average crystal structure characterization from the XRD result, the local domain structure was observed from the PFM result. Figure shows the different domain structure from samples unpoled and poled using DCP and ACP methods. Note that the scanned plane is (010) plane and electric field is along the horizontal [001] direction as it is marked. The original unpoled sample in Figure (a) hardly provides any domain information since the phase signal is weak and its amplitude followed the surface topography (Rq < 10 nm). After poling, new R phase domains were formed and both [101]-oriented 71° domain wall and [100]-oriented 109° domain wall from R phase domains can be observed in Figure (b,c). Comparingly, M phase observed in XRD is not shown in PFM results and it may be related to the skin effect [Citation30,Citation31]. Figure (b) shows clear lamellar domain structures with uniform 71° domain walls (920 ± 80 nm in width) and non-uniform 109° domain walls (2100 ± 770 nm in width), which are engineered by conventional DCP method [Citation32]. In Figure (c), the ACP sample depicted different R phase domain with backswitched domain structure. First, the vertical 109° domain wall becomes more uniform (700 ± 10 nm in width). Secondly, the 71° domain wall density (160 nm in width) is significantly increased compared with the DCP sample. Additionally, in Figure (c), these tiny 71° domain walls have two orientations, [101] and [10-1], between two 109° domain walls, while there is only one orientation in DCP sample shown in Figure (b). The supplementary PFM result, provided in Fig. S1, proves these 71° domains in ACP sample share the same in-plane <100> polarization component. Thus, if the unswitched (same as DCP) <001> polarization component is marked as [001] and the backswitched one is marked as [00-1], the rhombohedral <111> polarizations of 71° domains can be marked as unswitched ones along [111]/[1-11] and backswtiched ones along [11-1]/[1-1-1], where their <010> polarization component is the out-plane PFM result shown in Figure . Under the ACP electric field, the domain wall nuclear, leading to the growth of both unswitched and backswtiched domain walls. As a comparison, such backswitched domain structure is not observed in the DCP samples. Since the AC field used in ACP is amplitude symmetric (±5 kV/cm), it may cause the backswitched 71° domain walls having the similar length and width to those unswitched ones. Generally, the domain structures in ACP sample are more uniform and it is corresponding to the lower full width half maximum (FWHM) in the XRD result shown in Figure . From the view of domain engineering, the significant domain wall density increase in ACP samples is likely the origin of the piezoelectric property enhancement.
Figure 3. The PFM images of domain morphology for PMN-30%PT in different poling conditions: (a) unpoled (E = 0 kV/cm), (b) using DCP method, (c) using ACP method (1 Hz, 7 cycles). The poling field is 10 kV/cm and along [001] direction. The scanned plane is (010) cross section plane.
![Figure 3. The PFM images of domain morphology for PMN-30%PT in different poling conditions: (a) unpoled (E = 0 kV/cm), (b) using DCP method, (c) using ACP method (1 Hz, 7 cycles). The poling field is 10 kV/cm and along [001] direction. The scanned plane is (010) cross section plane.](/cms/asset/9b3147ae-e461-4e64-b716-f6de44c45e1c/tmrl_a_1498812_f0003_c.jpg)
As it is discussed in XRD results above, DCP samples remain R phase and ACP samples experience R→MA field-induced phase transition. Here, engineered ACP domain structure still demonstrates R phase domain configuration (4R)[Citation3], showing that such phase transition was not complete, and the phase transition caused by ACP is R→MA+R. The dielectric and piezoelectric properties in ferroelectrics are related to both intrinsic and extrinsic factors. In our work, ACP is proved to engineer the PMN-30PT in both ways. XRD measurement shows the intrinsic lattice symmetry is affected by the existence of MA phase and PFM measurement shows the extrinsic domain wall density is increased significantly. Both factors lead to the outstanding dielectric and piezoelectric properties after ACP [Citation33–35].
Further temperature-dependent dielectric constant measurement result is shown in Figure (a,b). Before the phase transition, the ACP samples poled with 20 AC cycles has a maximum dielectric constant value (∼40,000), which is much higher than the DCP sample (
∼20,000) at the same temperature. It has been reported that the poled rhombohedral PMN-x%PT has a phase transition sequence of R→T→C during the zero field heating [Citation36]. In this work, the similar dielectric constant curve in Figure (a) shows the phase transition temperatures of DCP PMN-30%PT single crystal are 90°C (363 K) for R→T and 130°C (403 K) for T→C. Comparingly, ACP samples have the same phase transition temperature near 90°C and 130°C, while extra anomalies of dielectric constant drops at 92°C ∼ 96°C (365 K ∼ 369 K) are shown in dielectric constant curves of ACP samples, as shown in Figure (b). It demonstrates that the different poling conditions lead to the different phase transition sequences during the process of depoling.
Figure 4. Dielectric constant as function of temperature for PMN-PT single crystal after (a) DCP and (b) ACP processes (including 3 cycles, 7 cycles, and 20 cycles for the ACP process). (c) (004) peaks showing T and R phase coexistence during the phase transition near 90°C in ACP sample (7 cycles).
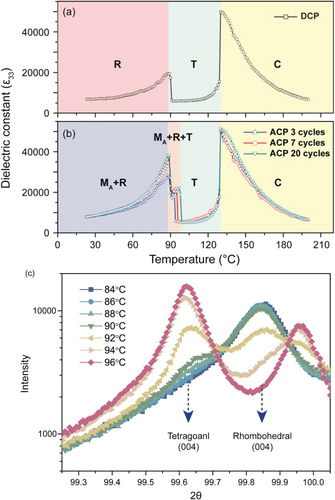
As the XRD and PFM results discussed above, in ACP samples MA+R phase exists at room temperature. So, the extra anomalies of dielectric constant appear between the MA+R and T phase. Additional in-situ XRD tracking on (004) peak was made to further study this unique phase transition sequence, and the ACP sample poled with 7 AC cycle was measured in the condition of zero-field heating. The in-situ XRD results with temperatures around the appearance of dielectric constant anomalies are shown in Figure (c), while the result with whole temperature range (from 25°C to 250°C) is provided in Fig. S2. As the arrows pointing out, both T phase (004) and R phase (004) are observable and indicate the existence of phase coexistence. At the first phase transition temperature around 90°C, the T phase (004) peak begins to rise and R phase peak drops a little bit. While at the temperature between 92°C and 96°C, T phase (004) peak promptly rises and R phase peak disappears at the same time. In conclusion, the dielectric constant for ACP samples droppings at 90°C and 92°C to 96°C are caused by the appearance of T phase and the completely transformation of T phase, respectively. In the meantime, Figure (c) cannot determine the existence of MA phase at this temperature range, since the MA phase peak is covered by the intense new T phase peak. Thus, the phase transition sequence of ACP samples should be MA+R→MA+R + T→T→C (used in Figure (b)) or MA+R→R(MA)+T→T→C and such a phase coexistence state is not shown in DCP sample. In addition, Figure (b) shows that the temperatures of extra anomalies (MA+R + T→T phase transition) are ACP-cycle-number-dependent. In other words, ACP sample with higher ACP-cycle-number has higher MA+R + T→T phase transition temperature. And the little difference between 7-cycle and 20-cycle shows such increment is also limited. Interestingly, the lower MA+R→MA+R + T phase transition temperatures are ACP-cycle-number-independent, which is also shown in Figure (b). According to the Landau theory[Citation37,Citation38], the split of the T phase transition temperature indicates that the bulk free energy of R (or R + MA) phase is increased nonuniformly after ACP. In details, the unchanged MA+R→MA+R + T phase transition temperatures between ACP and DCP samples indicate that some part of the ACP sample is not influenced by the backswitching field of ACP, so free energy change is the same as DCP sample. On the other hand, the higher MA+R + T→T phase transition temperature from ACP sample indicates that the free energy from the rest part of ACP sample is higher than the level of DCP sample and higher ACP-cycle-number can help ACP sample approaching the free energy maximum.
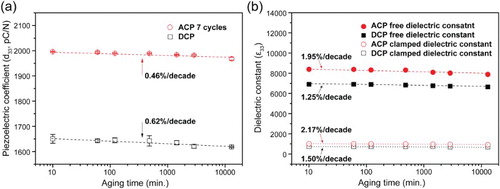
Considering the new domain structure shown in PFM result, the property stability of such phase coexistence heterogenous structure was tested by the following aging experiment. In the experiment, the aging characteristics of the piezoelectric coefficient and dielectric constant were collected right after the poling process and after a certain period of time at room temperature. The properties of aging data were measured using a d33 meter and an impedance analyzer at room temperature. Figure (a) shows the aging characteristics of the piezoelectric coefficient with different poling methods. The aging behaviors of poled PMN-30%PT single crystals follow the logarithmic law similar to BaTiO3 and PZT [Citation39,Citation40], and the aging equation can be written as follows.
(3) where
is the piezoelectric or dielectric constant after aging time t,
is the initial value of the property.
is the absolute aging rate which is the absolute decrease for one decade. The relative aging rate is expressed as
(4) It was observed that the piezoelectric aging of the ACP and DCP samples follow linear, logarithmic time dependence with aging rate (
) of 0.5%/decade and 0.6%/decade, respectively. The aging of free and clamped dielectric constant is shown in Figure (b). The aging rate of free dielectric constant around 1.3∼2.0%/decade by DCP and ACP method, which is similar to the Mn-doped Pb(In1/2Nb1/2)O3- Pb(Mg1/3Nb2/3)O3-PbTiO3 (∼1.5%/decade) with the dielectric constant of 4000 [Citation41]. The ACP and DCP samples also have a similar aging rate of clamped dielectric constant. Therefore, the ACP method can be used to enhance the dielectric and piezoelectric properties with reduced time of poling process without any aging concerns.
Figure 5. The aging rate of DCP and ACP. (a) The aging rate of piezoelectric coefficient, (b) The aging rate of free and clamped dielectric constant.
In summary, the ACP single crystal samples (10 kV/cm alternating current E-field with 1 Hz 7 cycles) exhibit a higher piezoelectric coefficient of 2000 ± 10 pC/N and dielectric constant of 8500 ± 100 that those of their DCP counterparts (continuities 10 kV/cm E-field for 30 min) at the room temperature. Further XRD and PFM results depict that ACP method engineers the lattice symmetry and domain structure at the same time. The enhanced piezoelectric coefficient and dielectric constant in ACP samples may originate from the appearance of field-induced MA phase. Also, the finer R phase domain structures generated by ACP method provide the other important origin of the better piezoelectric performance from the view of domain engineering. Based on these XRD and PFM results, the unique phase transition sequences of ACP samples are marked in the temperature dependent dielectric constant measurement. In addition, the aging rate of the piezoelectric coefficient and dielectric constants of the ACP samples are 0.5%/decade and 2.0%/decade, respectively. Thus, the reported ACP method exhibits a great potential to enhance the piezoelectric and dielectric properties of relaxor-PT single crystals without aging concerns.
Supplementary_information_v4.docx
Download MS Word (698.1 KB)Acknowledgments
This work was primarily supported by ONR under Grant # N00014-15-1-2418. This work was performed in part at the Analytical Instrumentation Facility (AIF) at North Carolina State University, which is supported by the State of North Carolina and the National Science Foundation (award number ECCS-1542015). The AIF is a member of the North Carolina Research Triangle Nanotechnology Network (RTNN), a site in the National Nanotechnology Coordinated Infrastructure (NNCI).
Disclosure statement
No potential conflict of interest was reported by the authors.
ORCID
Wei-Yi Chang http://orcid.org/0000-0003-1000-8121
Ching-Chang Chung http://orcid.org/0000-0002-6490-6827
Chengtao Luo http://orcid.org/0000-0003-1207-2960
Taeyang Kim http://orcid.org/0000-0002-8162-2973
Yohachi Yamashita http://orcid.org/0000-0003-4432-646X
Additional information
Funding
Related Research Data
References
- Wang Y, Gray D, Berry D, et al. An extremely low equivalent magnetic noise magnetoelectric sensor. Adv Mater. 2011;23:4111–4114. doi: 10.1002/adma.201100773
- Zheng M, Zheng R-K. Electric-field-tunable ferroelastic control of nonvolatile resistivity and ferromagnetic switching in multiferroic La0.67Ca0.33MnO3/[PbMg1/3Nb2/3O3]0.7[PbTiO3]0.3 heterostructures. Phys Rev Appl. 2016;5:1–8. 044002. doi: 10.1103/PhysRevApplied.5.044002
- Zhang S, Li F. High performance ferroelectric relaxor-PbTiO3 single crystals: status and perspective. J Appl Phys. 2012;111:1–50. 031301.
- Zhang S, Li F, Jiang X, et al. Advantages and challenges of relaxor-PbTiO3 ferroelectric crystals for electroacoustic transducers – A review. Prog Mater Sci. 2015;68:1–66. doi: 10.1016/j.pmatsci.2014.10.002
- Setter N. Piezoelectric materials in devices: extended reviews on current and emerging piezoelectric materials, technology, and applications. Lausanne: EPFL Swiss Federal Institute of Technology; 2002.
- Ma J, Martin KH, Li Y, et al. Design factors of intravascular dual frequency transducers for super-harmonic contrast imaging and acoustic angiography. Phys Med Biol. 2015;60:3441. doi: 10.1088/0031-9155/60/9/3441
- Zhang S, Shrout TR. Relaxor-PT single crystals: observations and developments. IEEE Trans Ultrason Ferroelectr Freq Control. 2010;57:2138–2146. doi: 10.1109/TUFFC.2010.1670
- Li D, Bonnell DA. Ferroelectric lithography. Ceram Int. 2008;34:157–164. doi: 10.1016/j.ceramint.2006.09.021
- Chang W-Y, Huang W, Bagal A, et al. Study on dielectric and piezoelectric properties of 0.7 Pb(Mg1/3Nb2/3)O3-0.3 PbTiO3 single crystal with nano-patterned composite electrode. J Appl Phys. 2013;114:1–6. 114103.
- Yamamoto N, Yamashita Y, Hosono Y, et al. Ultrasonic probe, piezoelectric transducer, method of manufacturing ultrasonic probe, and method of manufacturing piezoelectric transducer [Internet]. 2014 [cited 2017 Jul 26]. Available from: http://www.google.com/patents/US20140062261.
- Ye Z-G. Handbook of advanced dielectric, piezoelectric and ferroelectric materials: synthesis, properties and applications. Cambridge: Woodhead Publishing; 2008.
- Wada S, Tsurumi T. Enhanced piezoelectricity of barium titanate single crystals with engineered domain configuration. Br Ceram Trans. 2004;103:93–96. doi: 10.1179/096797804225012747
- Ahluwalia R, Lookman T, Saxena A, et al. Piezoelectric response of engineered domains in ferroelectrics. Appl Phys Lett. 2004;84:3450–3452. doi: 10.1063/1.1737059
- Yamashita Y, Yamamoto N, Hosono Y, et al. Piezoelectric transducer, ultrasonic probe, and piezoelectric transducer manufacturing method [Internet]. 2015 [cited 2017 Jul 21]. Available from: http://www.google.com/patents/US20150372219.
- Plessner KW. Ageing of the dielectric properties of barium titanate ceramics. Proc Phys Soc Sect B. 1956;69:1261. doi: 10.1088/0370-1301/69/12/309
- Bradt RC, Ansell GS. Aging in tetragonal ferroelectric barium titanate. J Am Ceram Soc. 1969;52:192–198. doi: 10.1111/j.1151-2916.1969.tb13364.x
- Zhang L, Ren X. Aging behavior in single-domain Mn-doped BaTiO3 crystals: implication for a unified microscopic explanation of ferroelectric aging. Phys Rev B. 2006;73: 094121.
- Shepard JF, Chu F, Kanno I, et al. Characterization and aging response of the d31 piezoelectric coefficient of lead zirconate titanate thin films. J Appl Phys. 1999;85:6711–6716. doi: 10.1063/1.370183
- Kholkin AL, Tagantsev AK, Colla EL, et al. Piezoelectric and dielectric aging in pb(zr,ti)o3 thin films and bulk ceramics. Integr Ferroelectr. 1997;15:317–324. doi: 10.1080/10584589708015722
- DeLaunay J, Smith PL. Aging of Barium Titanate and Lead Zirconate-Titanate Ferroelectric Ceramics [Internet]. NAVAL RESEARCH LAB WASHINGTON DC, NAVAL RESEARCH LAB WASHINGTON DC; 1970 [cited 2017 Jul 30]. Report No.: NRL-7172. Available from: http://www.dtic.mil/docs/citations/AD0715624.
- Devonshire AF. Theory of ferroelectrics. Adv Phys. 1954;3:85–130. doi: 10.1080/00018735400101173
- Zhang QM, Zhao J, Cross LE. Aging of the dielectric and piezoelectric properties of relaxor ferroelectric lead magnesium niobate–lead titanate in the electric field biased state. J Appl Phys. 1996;79:3181–3187. doi: 10.1063/1.361261
- Shrout TR, Huebner W, Randall CA, et al. Aging mechanisms in Pb(Mg1/3Nb2/3)O3-based relaxor ferroelectrics. Ferroelectrics. 1989;93:361–372. doi: 10.1080/00150198908017368
- Wang P-C, Luo H-S, Pan X-M, et al. Dielectric and piezoelectric properties of PMN-PT single crystals grown by Bridgman method. In: Applications of Ferroelectrics, 2000. ISAF 2000 proc. 2000 12th IEEE Int. symp. vol. 2. p. 537–540, Honolulu, HI, USA: IEEE.
- Zhang S, Lee S-M, Kim D-H, et al. Characterization of Mn-modified Pb(Mg1/3Nb2/3)O3–PbZrO3–PbTiO3 single crystals for high power broad bandwidth transducers. Appl Phys Lett. 2008;93:1–3. 122908.
- IEEE Standard on Piezoelectricity. IEEE standard on piezoelectricity. New York: ANSIIEEE Std; 1988. p. 176–1987 doi: 10.1109/IEEESTD.1988.79638
- Cao H, Li J, Viehland D, et al. Fragile phase stability in (1- x) Pb(Mg1/3Nb2/3O3)-xPbTiO3 crystals: A comparison of [001] and [110] field-cooled phase diagrams. Phys Rev B. 2006;73:1–9. 184110.
- Bai F, Wang N, Li J, et al. X-ray and neutron diffraction investigations of the structural phase transformation sequence under electric field in 0.7Pb(Mg1/3Nb2/3)-0.3PbTiO3 crystal. J Appl Phys. 2004;96:1620–1627. doi: 10.1063/1.1766087
- Vanderbilt D, Cohen MH. Monoclinic and triclinic phases in higher-order devonshire theory. Phys Rev B. 2001;63:1–9. 094108. doi: 10.1103/PhysRevB.63.094108
- Dkhil B, Kiat JM, Calvarin G, et al. Local and long range polar order in the relaxor-ferroelectric compounds PbMg1/3Nb2/3O3 and PbMg0.3Nb0.6Ti0.1O3. Phys Rev B. 2001;65:1–8. 024104. doi: 10.1103/PhysRevB.65.024104
- Phelan D, Rodriguez EE, Gao J, et al. Phase diagram of the relaxor ferroelectric (1 - x)Pb(Mg1/3Nb2/3)O3 + xPbTiO3 revisited: a neutron powder diffraction study of the relaxor skin effect. Phase Transit. 2015;88:283–305. doi: 10.1080/01411594.2014.989226
- Wong KS, Zhao X, Dai JY, et al. Study of domain boundary polarization in (111)-cut [Pb(Mg1/3Nb2/3)O3]0.7(PbTiO3)0.3 single crystal by piezoresponse force microscopy. Appl Phys Lett. 2006;89:1–3. 092906.
- Wada S. Domain wall engineering in piezoelectric crystals with engineered domain configuration. Handbook of Advanced Dielectric, Piezoelectric and Ferroelectric Materials-Synthesis, Characterization and Applications. Cambridge, England: Woodhead (2008): 266–303.
- Wang YU. Field-induced inter-ferroelectric phase transformations and domain mechanisms in high-strain piezoelectric materials: insights from phase field modeling and simulation. J Mater Sci. 2009;44:5225–5234. doi: 10.1007/s10853-009-3663-9
- Li F, Zhang S, Xu Z, et al. Composition and phase dependence of the intrinsic and extrinsic piezoelectric activity of domain engineered (1-x)Pb(Mg1/3Nb2/3)O3-xPbTiO3 crystals. J Appl Phys. 2010;108:1–9. 034106.
- Shabbir G, Kojima S, Feng C. High temperature dc field poling effects on the structural phase transformations of (1-x)Pb(Mg1/3Nb2/3)O3–xPbTiO3 single crystal with morphotropic phase boundary composition. J Appl Phys. 2006;100:1–4. 064107. doi: 10.1063/1.2337103
- Damjanovic D. Contributions to the piezoelectric effect in ferroelectric single crystals and ceramics. J Am Ceram Soc. 2005;88:2663–2676. doi: 10.1111/j.1551-2916.2005.00671.x
- Li F, Lin D, Chen Z, et al. Ultrahigh piezoelectricity in ferroelectric ceramics by design. Nat Mater. 2018;17:349–354. doi: 10.1038/s41563-018-0034-4
- Wu K, Schulze WA. Aging of the weak-field dielectric response in fine- and coarse-grain ceramic BaTiO3. J Am Ceram Soc. 1992;75:3390–3395. doi: 10.1111/j.1151-2916.1992.tb04439.x
- Srilomsak S, Schulze WA, Pilgrim SM, et al. Harmonic analysis of polarization hysteresis of aged PZTs. J Am Ceram Soc. 2005;88:2121–2125. doi: 10.1111/j.1551-2916.2005.00418.x
- Luo N, Zhang S, Li Q, et al. Crystallographic dependence of internal bias in domain engineered Mn-doped relaxor-PbTiO 3 single crystals. J Mater Chem C. 2016;4:4568–4576. doi: 10.1039/C6TC00875E