
 ?Mathematical formulae have been encoded as MathML and are displayed in this HTML version using MathJax in order to improve their display. Uncheck the box to turn MathJax off. This feature requires Javascript. Click on a formula to zoom.
Abstract
Predicting the phase precipitation of multicomponent alloys, especially the Ni-base superalloys, is a difficult task. In this work, we introduced a dependable and efficient way to establish the relationship between composition and detrimental phases in Ni-base superalloys, by integrating high throughput experiments and machine learning algorithms. 8371 sets of data about composition and phase information were obtained rapidly, and analyzed by machine learning to establish a high-confidence phase prediction model. Compared with the traditional methods, the proposed approach has remarkable advantage in acquiring and analyzing the experimental data, which can also be applied to other multicomponent alloys.
IMPACT STATEMENT
By integrating the high throughput experiments and machine learning algorithms, it is hopeful to facilitate the design of new Ni-base superalloys, and even other multicomponent alloys.
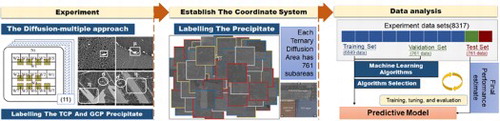
GRAPHICAL ABSTRACT
1. Introduction
The multicomponent alloys including Ti-base [Citation1], Ni-base [Citation2,Citation3], Fe-base [Citation4], Al-base [Citation5], and high entropy alloys [Citation6], are composed of five or more metallic elements, which makes it increasingly complex to study the relationships among composition, phases, process, and properties. For example, the Ni-base superalloys, used for turbine blades and disks, generally contain over eight alloying elements, the phase precipitation and mechanical properties are found very sensitive to the composition variation [Citation3,Citation7]. Therefore, there were great efforts on the composition design of superalloys over the past decades [Citation8,Citation9]. The phases of the Ni-base superalloys generally include γ matrix, γ′ phase, topologically close-packed (TCP) phases, and geometrically close-packed (GCP) phases [Citation10,Citation11]. Wherein the TCP and GCP phases are always thought detrimental to the alloys, as their precipitation would deplete the strengthening elements, and facilitate the crack initiation [Citation10,Citation12]. Thereby, the TCP and GCP phases should be avoided during the alloy design, and reliable prediction of these phases becomes indispensable.
At the very initial stage, the valence electron concentration was used to predict the formation of the TCP phases in simple binary and ternary systems [Citation13,Citation14]. Thereafter, phase computation, known as PHACOMP [Citation15] and newPHACOMP [Citation16], had been proposed successively. But those methods were unable to accurately predict the precipitation behavior of new generation Ni-base superalloys. So far, the calculation of phase diagram (CALPHAD) is thought a powerful method to bridge the composition and equilibrium phases. As CALPHAD is generally based on the database derived from simple systems within certain composition ranges, the accuracy of TCP and GCP phases prediction in complex systems or outside domains needs further verification.
With the continuous progress in materials design, more statistical methods, especially the machine learning (ML), have been adopted [Citation17,Citation18], providing new hints for exploring multicomponent superalloys. However, as adequate data ranging from tens to over hundreds are needed to train the ML algorithm, enough experimental results are were necessary, which is always time-consuming for traditional methods. Hence a high-throughput experiment combining with superalloys diffusion-multiples and automatic composition-phase identification is introduced here. In specific, the diffusion-multiples yield tremendous alloys with composition gradients in large ranges. Aided with advanced microdomain detection technologies, the site dependent composition and phases could be automatically detected. Thus, a reliable experimental database has been established for ML to train phase precipitation models and composition design of superalloys, which can also be broadly applied to other multicomponent alloys.
2. Materials and methods
2.1. Materials and sample preparation
Several superalloys were utilized to assemble a diffusion multiple contain complex compositions, as shown in Table . Alloy compositions of W2 to W7 were adjusted based on W1 by substituting Co, W, Mo, Ti, Ta, Nb for Ni respectively. Those alloys were prepared by vacuum induction melting method firstly and homogenized by heat treatment. Then alloy W1-W7 were arranged and assembled as shown in Figure . After hot isostatic pressing at 1180°C/150 MPa for 8 h and two-stage aging process of 1180°C / 1000 h plus 800°C / 2000h, the alloys with different components were closely bonded and fully diffused to form compositional and microstructural gradient.
Figure 1. Schematic workflow of the proposed method.
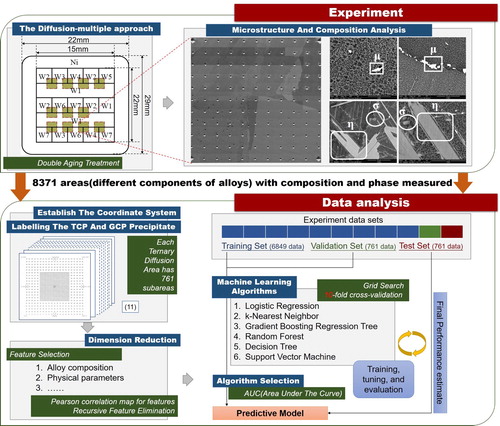
Table 1. Measured composition of multicomponent alloys in wt.%.
2.2. Composition identification and microstructure characterization
Micro-XRF (X-ray fluorescence) equipment BRUKER M4 TORNADO was used to automatically and continuously identify the elemental composition at different regions. SEM (scanning electron microscope) was performed by ZEISS SUPRA 55 equipped on an automated photographic platform.
The bulk samples contained 11 diffusion multiples totally, and each diffusion multiple was in a size of and divided into 761 sections. Above mentioned division method was shown in Figure . Considering the composition changes of the central sections were more significant than these of edge regions, denser data points were collected therein. In specific, we firstly established a rectangular coordinate system based on the actual dimensions of each diffusion multiple, setting the ranges of x and y axises as 0–2000; secondly, set coordinate points in step of 50 nm within 500≤x≤1500 and 500≤y≤1500, and the square area of
was the feature region of corresponding center coordinate point. In other areas outside the core domains, the step was set as 100 nm, hence the square area of
was the feature region of the center point. By marking the existence of TCP and GCP in each area, whole 8371 pieces of data containing alloy composition and these phases were obtained.
2.3. Machinal learning
According to the NFL(No Free Lunch) theorem [Citation19], different machine learning algorithms own respective advantages and disadvantages, the following commonly used six different machine learning classification algorithms have been used here: logistic regression (LR), k-nearest neighbor (KNN), gradient boosting regression tree (GBRT), random forest (RF), decision tree (DT), and support vector machine (SVM). The predictability of these algorithms model was judged by comparing area under curve (AUC), as adopted by other authors [Citation20,Citation21]. Before modeling, the features were filtered by Pearson correlation and recursive feature elimination. In order to avoid overfitting of the model and evaluate the feasibility of the models, 761 pieces of data detected from NiX-W-Nb diffusion multiple were picked as a test set, and the remaining 7610 pieces of data were used for training, which were randomly divided into 10 parts, 9 of which were used as the trading set and 1 was used as the validation set. To acquire acceptable accuracy and stability, we applied 10-fold cross validation and a grid-search technique for the hyperparameters selection.
3. Results and discussion
3.1. Phase identification.
The microstructures of seven original alloys, W1-W7, are shown in Figure (A–L). The γ, γ′, σ, µ and η phases are the major phases in the diffusion multiple. In specific, the γ matrix is mainly strengthened by solid solution elements. The γ′ phase is the L12 ordered phase based on Ni3Al, and is the main strengthening phase in Ni-based superalloys. The σ and µ phases are TCP phases, and the η phase is a typical GCP phase. In terms of morphological features, µ and σ phases are mainly in punctate, acicular, irregular, and discontinuous shapes, and the η phase is generally in shapes of large flake and lathy needle. Basically, γ, γ′ and GCP in the alloy could be distinguished from the typical morphologies. As both µ and σ phases are harmful and in similar geometric features, these two phases are unified into TCP phases.
Figure 2. (A-G) SEM images of W1-W7 alloys; (H, I) the magnified images of σ, µ and η phases, respectively; (J, K, L) the electron backscattered diffraction Kikuchi patterns of µ, σ, and η, respectively; (M) labeled and (N) montaged SEM images of NiX-6W-4Nb diffusion triple.
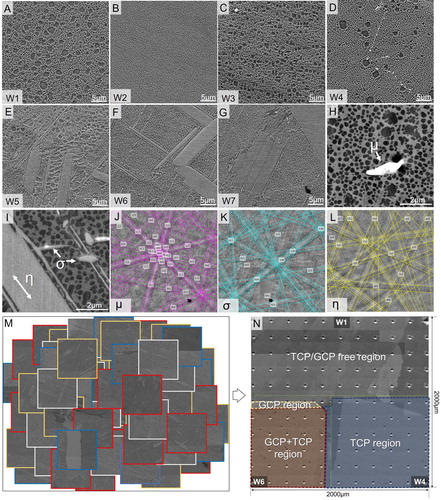
In the light of the distributions of TCP and GCP phases, the microstructural images of 761 sections were classified and matched. As shown in Figure (M,N), the GCP and TCP phases simultaneously precipitate at the areas marked by red frames; yellow and blue frames correspond to GCP and TCP phase precipitated regions, respectively.
Moreover, the white frame illustrates that there is no harmful phase. Thereby, the distribution of precipitates in the diffusion multiple could be identified directly after the labeled images were integrated into the whole NiX-6W-4Nb diffusion triple. To obtain adequate data source, this labeling method was also applied for the other 10 diffusion triples.
3.2. Feature set determination
Selecting typical and moderate features is the key for ML, since superabundant features would increase the dimension of the feature space, raise the risk of overfitting, and even destruct the interpretability on results. Therefore, strong related features with absolute value of Pearson correlation coefficient over 0.75 were removed. Firstly, the elemental factors were considered. Because Ni-base superalloys are alloyed with many elements, the interactions among different elements are complicated. As shown in Figure (A), even if the strongly related Ni is removed, the model is still high-dimensional and does not have acceptable generalization ability.
Figure 3. Pearson correlation map for features of (A) alloy composition, and (B) 12 physical parameters.
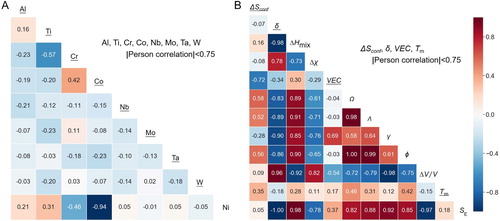
Thereafter, in order to further reduce the dimensions and improve the model interpretability, 12 physics parameters integrating element information were chosen as candidate features, as illustrated in Table . Based on Figure (B), after removing the significantly related parameters, four physical parameters (ΔSconf, δ, VEC, and Tm) with less correlation can be retained as the features.
Table 2. Physic parameters.
Furthermore, recursive feature elimination (RFE) was adopted to reduce feature dimensions. Specifically, RFE was performed to obtain the importance of each feature through the attribution returned by the algorithm, and remove the weakly weighted features for next round training. According to the feature importance determined by three models of gradient boosting regression tree (GBRT), random forest (RF), and decision tree (DT), as illustrated in Figure (A,C), the VEC and ΔSconf have relatively lower feature importance. Moreover, the area under curve (AUC) values of all models are illustrated in Figure (B,D). The overall prediction accuracy of these models stayed at high level when ΔSconf, δ, and Tm are used as feature set X. While the model accuracy dropped sharply when both VEC and ΔSconf are removed from the feature set. Thereafter, the feature X including ΔSconf, δ, and Tm was chosen.
Figure 4. Recursive feature elimination results showing (A) the feature importance and (B) AUC value of TCP phases; (C) the feature importance and (D) AUC value of GCP illustrating predicted by models with different feature sets; the SHAP values of (E) TCP and (F) GCP.
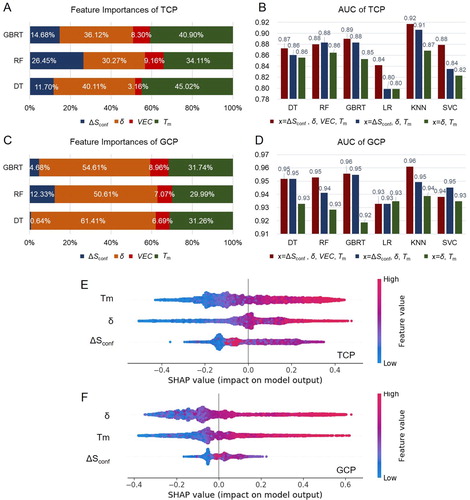
To improve the interpretability of the model, the impact of each eigenvalue on the prediction results was evaluated by SHAP (SHapley Additive exPlanations) [Citation32], as shown in Figure (E,F). The dots in the figure represent all data points in the data set. The dots in more reddish color own greater characteristic value, and the bluer the converse. Positive values represent the promotion of harmful phases, and negative values mean the suppression of harmful phases. It was detected that the lower ΔSconf, δ, and Tm were beneficial to suppress the formation of harmful phases. The strengthening effects of nickel-based superalloys are mainly solid solution strengthening, precipitation strengthening and grain boundary strengthening. The order of atomic size is: Ni < Co<Cr<Mo<W<Al<Ti<Nb<Ta, and the element with smaller atomic size difference from the Ni matrix is easier to solute into Ni. For Ni-base superalloys, Co, Cr, Mo and W are the major solid solution strengthening elements. Hence, when the δ is smaller, as the component atomic-size difference is relatively small, the component atoms easily substitute for each other to form solid solution. Meanwhile, the mixing enthalpy values is not negative enough for matrix to form a compound [Citation23]. With low solid solubility in matrix, Al, Ti, Nb and Ta could form intermetallic compounds with Ni, such as γ′-Ni3(Al, Ti), η- Ni3(Al, Ti)0.5Nb0.5 and so on. The γ′ phase with low ΔSconf is a long-range ordered face-centered cubic structure, which is the main precipitation strengthening phase. The η phase with high ΔSconf is a close-packed hexagonal structure. Thereby, the overall ΔSconf is smaller, less prone to form harmful phases. Basically, the addition of refractory elements including Cr, W, Ta, Mo and Nb can effectively improve the performance of the alloy, but excessive addition, which would cause the higher Tm, leads to the precipitation of harmful phases.
3.3. Validity of ML model
The algorithm with best general predictability on TCP and GCP phase precipitation was k-nearest neighbor (KNN), which was also selected for the following test. The predicted results of the test set (i.e. NiX-6W-4Nb diffusion triple) were compared with the experimental data to evaluate the feasibility of this ML method. In Figure , the green and red points represent the specific area where the harmful phase is accurately and inaccurately predicted respectively. The blue point means that the harmful phase does not precipitate experimentally but is predicted to be appeared, and the gray point manifests that KNN has exactly estimated that the harmful phase does not precipitate there. Additionally, the red line shows the Zero-Phase Fraction (ZPF) line, and the dotted line was the prediction ZPF line.
Figure 5. The predicted results showing (A) the distribution and (B) ZPF line of TCP phases by ML and (C) Thermo-Calc; (D) the distribution and (E) ZPF line of GGP phases by ML and (F) Thermo-Calc; and the phase diagram by (G) experimental, (H) ML and (I) Thermo-Calc in NiX-6W-4Nb diffusion triple.
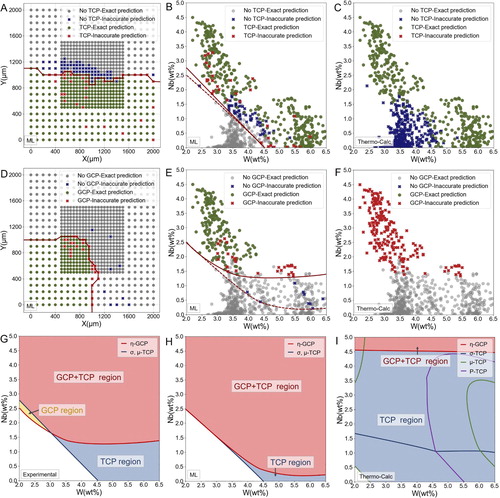
In general, using the physical parameters ΔSconf, δ and Tm, the KNN model has accurately predicted the precipitation of harmful phases, as the AUC values of TCP and GCP reached 0.88 and 0.92, respectively. Compared with the phase diagram of 800°C calculated by Thermo-calc with thermodynamic database TTNI8, it could be found that the traditional CALPHAD calculation seriously underestimates the precipitation trend of GCP phase and overestimates the precipitation of TCP phase. Thereby, integrating the high throughput experiment and machine learning had better predictability.
Considering the training data has completely excluded NiX-6W-4Nb diffusion triple data, this prediction model had a strong generalization ability, and can be well applied to untrained elementary composition range. This method, can also be extended to predict the phase precipitation in other multicomponent alloys, such as iron steels, Ti alloy, and Al alloys.
4. Conclusions
In conclusion, we established a ML model to predict the relationship between composition and detrimental phases in multicomponent nickel-based superalloys, based on the database obtained from high throughput experiments.
This method used advanced detection equipment to automatically collect the composition and microstructure information of the alloy, and introduced the physic parameters as the feature set to reduces the dimension reasonably. Within six different machine learning algorithms, a trusted model with AUC values of 0.88 and 0.92 for TCP and GCP was finally screened. As a great challenge in alloy design lies in avoiding the precipitation of detrimental phases, this model with sound predictability offers a promising opportunity to find novel Ni-based superalloys within undiscovered composition ranges. Moreover, the method applied in this work can also be extensively used for other multicomponent alloys.
Data and materials availability
The data supporting the findings of this work is available in the main text. Raw data are available from the corresponding authors on reasonable request.
Supplemental Material
Download JPEG Image (904.2 KB)
Acknowledgments
The authors acknowledge Prof. Ji-Cheng Zhao from University of Maryland and Prof. Zhanpeng Jin from Central South University for insightful discussions.
Disclosure statement
No potential conflict of interest was reported by the author(s).
Additional information
Funding
Related Research Data
References
- Alabort E, Barba D, Shagiev MR, et al. Alloys-by-design: application to titanium alloys for optimal superplasticity. Acta Mater. 2019;178:275–287.
- Smith T, Esser B, Antolin N, et al. Phase transformation strengthening of high-temperature superalloys. Nat Commun. 2016;7(1):1–7.
- Pollock TM. Alloy design for aircraft engines. Nat Mater. 2016;15(8):809–815.
- Almirall N, Wells P, Yamamoto T, et al. Precipitation and hardening in irradiated low alloy steels with a wide range of Ni and Mn compositions. Acta Mater. 2019;179:119–128.
- Sun W, Zhu Y, Marceau R, et al. Precipitation strengthening of aluminum alloys by room-temperature cyclic plasticity. Science. 2019;363(6430):972–975.
- Ding Q, Zhang Y, Chen X, et al. Tuning element distribution, structure and properties by composition in high-entropy alloys. Nature. 2019;574(7777):223–227.
- Wang Z, Zhang L, Li W, et al. High throughput experiment assisted discovery of new Ni-base superalloys. Scr Mater. 2020;178:134–138.
- Jones N, Christofidou K, Mignanelli P, et al. Influence of elevated Co and Ti levels on polycrystalline powder processed Ni-base superalloy. Mater Sci Technol. 2014;30(15):1853–1861.
- Christofidou KA, Hardy MC, Li H-Y, et al. On the effect of Nb on the microstructure and properties of next generation polycrystalline powder metallurgy Ni-based superalloys. Metallurgical and Materials Transactions A. 2018;49(9):3896–3907.
- Seiser B, Drautz R, Pettifor D. TCP phase predictions in Ni-based superalloys: structure maps revisited. Acta Mater. 2011;59(2):749–763.
- Antonov S, Detrois M, Isheim D, et al. Comparison of thermodynamic database models and APT data for strength modeling in high Nb content γ–γ′ Ni-base superalloys. Mater Des. 2015;86:649–655.
- Rae CM, Reed RC. The precipitation of topologically close-packed phases in rhenium-containing superalloys. Acta Mater. 2001;49(19):4113–4125.
- Rideout S, Manly W, Kamen E, et al. Intermediate phases in ternary alloy systems of transition elements. JOM. 1951;3(10):872–876.
- Das D. Intermediate phases in the Mo-Fe-Co, Mo-Fe-Ni, and Mo-Ni-Co ternary systems. rn. 1952;1:2–1.
- Boesch WJ, Slaney JS. Preventing sigma phase embrittlement in nickel base superalloys. Metal Progress. 1964;86(1):109–111.
- Morinaga M, Yukawa N, Adachi H, et al. New PHACOMP and its applications to alloy design. Superalloys 1984. 1984: 523–532.
- Butler KT, Davies DW, Cartwright H, et al. Machine learning for molecular and materials science. Nature. 2018;559(7715):547–555.
- Balachandran PV, Young J, Lookman T, et al. Learning from data to design functional materials without inversion symmetry. Nat Commun. 2017;8(1):1–13.
- Adam SP, Alexandropoulos S-AN, Pardalos PM, et al. No free lunch theorem: a review. Approximation and optimization. Cham, Switzerland: Springer; 2019. p. 57–82.
- Choubin B, Borji M, Mosavi A, et al. Snow avalanche hazard prediction using machine learning methods. J Hydrol. 2019;577:123929.
- Min X, Yu B, Wang F. Predictive modeling of the hospital readmission risk from patients’ claims data using machine learning: a case study on COPD. Sci Rep. 2019;9(1):1–10.
- Morinaga M, Yukawa N, Adachi H, Ezaki H, New PHACOMP and its applications to alloy design. In: Gell M, et al., editors. Superalloys 1984. Warrendale, PA, USA: The Metallurgical Society of AIME; 1984. p. 523–532.
- Zhang Y, Zhou YJ, Lin JP, et al. Solid-solution phase formation rules for multi-component alloys. Adv Eng Mater. 2008;10(6):534–538.
- Guo S, Hu Q, Ng C, et al. More than entropy in high-entropy alloys: Forming solid solutions or amorphous phase. Intermetallics. 2013;41:96–103.
- Takeuchi A, Inoue A. Classification of bulk metallic glasses by atomic size difference, heat of mixing and period of constituent elements and its application to characterization of the main alloying element. Mater Trans. 2005;46(12):2817–2829.
- Guo S, Ng C, Lu J, et al. Effect of valence electron concentration on stability of fcc or bcc phase in high entropy alloys. J Appl Phys. 2011;109(10):103505.
- Fang S, Xiao X, Xia L, et al. Relationship between the widths of supercooled liquid regions and bond parameters of Mg-based bulk metallic glasses. J Non Cryst Solids. 2003;321(1-2):120–125.
- Yang X, Zhang Y. Prediction of high-entropy stabilized solid-solution in multi-component alloys. Mater Chem Phys. 2012;132(2-3):233–238.
- Singh AK, Kumar N, Dwivedi A, et al. A geometrical parameter for the formation of disordered solid solutions in multi-component alloys. Intermetallics. 2014;53:112–119.
- Wang Z, Huang Y, Yang Y, et al. Atomic-size effect and solid solubility of multicomponent alloys. Scr Mater. 2015;94:28–31.
- Ye Y, Wang Q, Lu J, et al. Design of high entropy alloys: a single-parameter thermodynamic rule. Scr Mater. 2015;104:53–55.
- Lundberg SM, Lee S-I. A unified approach to interpreting model predictions. Advances in neural information processing systems; 2017.