
 ?Mathematical formulae have been encoded as MathML and are displayed in this HTML version using MathJax in order to improve their display. Uncheck the box to turn MathJax off. This feature requires Javascript. Click on a formula to zoom.
Abstract
The influence of epitaxial strain on the electronic structure of α-Cr2O3(0001) thin films is probed by combining X-ray photoemission spectroscopy and crystal field multiplet calculations. In-plane lattice strain introduces distortions in the CrO6 octahedron and splits the 3d orbital triplet t2g into a1 + e orbitals. For relaxed thin films, the lines-shape of the Cr 2p core levels are well reproduced when the t2g subset is fully degenerated. In-plane tensile strain stabilizes a1 with respect to e orbitals, whereas compressive strain destabilizes a1 orbitals. Understanding these crystal field variations is essential for tuning the physical properties of α-Cr2O3 thin films.
GRAPHICAL ABSTRACT
Cr2O3 is an archetype magnetoeletric antiferromagnet oxide often envisioned for use in future high-performance spintronic applications [Citation1,Citation2], e.g. storage, memory and logic use [Citation3,Citation4]. Cr2O3-based systems are particularly promising for voltage control devices as they have reversible, isothermal switching of the exchange-bias field at room temperature [Citation5,Citation6]. A crucial issue toward device application is the enhancement of Cr2O3 operating temperature to assure enough stability for room temperature processes. A promising approach to overcome this issue is strain engineering, because it can influence not only the Néel temperature, but also the magnetic anisotropy of the material [Citation7–9]. In Cr2O3, the magnetic interaction is mainly controlled by the Cr–Cr direct exchange interaction. Therefore, any change in the Cr–Cr bond length affects the orbital overlap between these cations and, consequently, modifies the intra-layer antiferromagnetic exchange. In addition, strains induce distortions in the CrO6 octahedron, which strongly affects the magnetocrystalline anisotropy through the modulation of the crystal field.
In this Letter, we assess variations of the crystal field in α-Cr2O3(0001) layers strained through substrate lattice mismatch. By means of Crystal Field Multiplet (CFM) calculations, we exploit the features of X-ray Photoemission Spectroscopy (XPS) measurements to extract the crystal field parameters of α-Cr2O3 thin films in different strain scenarios. A quantitative relation is subsequently established between distortions of the CrO6 octahedron and the crystal field splitting of chromium d-orbitals. This relationship is crucial to predict changes in the magnetic and electronic properties of α-Cr2O3 when a certain amount of internal strain is considered.
XPS is an analytical technique very sensitive to modifications of the surface chemistry of any compound. Theoretical works [Citation10] have long predicted that changes in the local geometry of the transition metal may lead to changes in the multiplet splitting features of the XPS spectrum. In this regard, Cr2O3 is a very challenging compound since its 2p photoemission structure is known to have a particularly complex spectral shape due to the coupling between the 2p core-hole and the unpaired electrons in the 3d outer shell [Citation11]. Thus, even if studies [Citation12–14] have shown that the spectral shape of the Cr 2p XPS spectrum is related to the cation local environment, a thorough investigation to quantitatively link these changes with the crystal field strength is still lacking.
The main aim of our study is to explore line-shape differences of the Cr 2p core-level spectra in order to quantify changes in the crystal field around the Cr3+ cation induced by different epitaxial strains. To do so, we have investigated epitaxial ultrathin films of α-Cr2O3(0001) directly on α-Al2O3(0001) substrate or on α-Fe2O3(0001) buffer layer grown on the same sapphire substrate. These three oxides have a corundum-like crystal structure with in-plane lattice parameters (a) equal to 0.476, 0.492 and 0.503 nm for α-Al2O3(0001), α-Cr2O3(0001), and α-Fe2O3(0001), respectively [Citation15]. The in-plane lattice mismatch is +3.36% for α-Cr2O3 on α-Al2O3 and −2.19% for α-Cr2O3 on α-Fe2O3. Hence, we were able to analyze the photoemission spectra of Cr2O3 thin films under either compressive (for α-Cr2O3 on α-Al2O3 substrate) or tensile (for α-Cr2O3 on α-Fe2O3 buffer) in-plane strain.
All samples were grown by Oxygen-plasma-assisted Molecular Beam Epitaxy (O-MBE) on α-Al2O3(0001) substrates pre-cleaned in a H2O2/NH4OH/H2O solution and then in situ by exposure to the oxygen plasma. During the growth, the sample holder temperature was around 450°C and the metal evaporation rate was 0.03 nm·min−1. Connected to the ultrahigh-vacuum O-MBE chamber, a Reflection High-Energy Electron Diffraction (RHEED) gun allow us to monitor in real time the diffraction patterns and the evolution of the in-plane lattice parameter of each oxide layer. These RHEED images were acquired with the primary beam aligned parallel to azimuth. The O-MBE setup is described in detail elsewhere [Citation16]. Following growth, the thickness of each sample was measured ex situ by X-ray reflectivity. Ex situ XPS analyses were then carried out for each sample at room temperature with an Escalab 250 XI using a monochromatic Al Kα source (hν = 1486.6 eV). As the substrate is an insulator, we used a low-energy electron flood gun during spectral acquisition to avoid charge effects.
We started by depicting the evolution of the in-plane lattice parameter vs. coverage (dotted lines in Figure ) extracted from the RHEED images. For simplicity sake, the spacing between the and
streaks in pixel is normalized to a value of 100% for α-Al2O3. Thus, values of 96.64% and 94.33% are obtained for bulk α-Cr2O3 and α-Fe2O3 (dashed lines in Figure ), respectively. As expected for α-Cr2O3 single layers grown on α-Al2O3 substrate [Citation15], the strong in-plane compressive strain observed at very early stages of the growth gradually relaxes with deposition time (Figure (a)). Therefore, we selected three α-Cr2O3 single layers with thicknesses of 1.1, 5.3 and 16.7 nm to evaluate the Cr 2p XPS spectrum of α-Cr2O3 under high, moderate and low compressive strain, respectively. Then, we turned our attention to α-Cr2O3 layers grown on α-Fe2O3 buffer. In this bilayer, Cr2O3 should remain under lateral tension up to several Angstroms, exhibiting similar in-plane lattice parameter as the α-Fe2O3 buffer [Citation15]. The growth of the α-Fe2O3 buffer was optimized years ago [Citation17,Citation18]. Herein, we selected a α-Fe2O3 film thickness of 5.7 nm associated to a fully relaxed state (Figure (b)). On this relaxed buffer layer, an ultrathin film of 3.0 nm thickness of α-Cr2O3 was grown successfully. As predicted, we clearly observed an in-plane tensile strain in the Cr2O3 layer (Figure (b)).
Figure 1. Evolution of the relative RHEED streak spacing and Cr 2p XPS spectra during the growth of α-Cr2O3(0001) under (a) compressive (α-Cr2O3 on α-Al2O3 substrate) and (b) tensile (α-Cr2O3 on α-Fe2O3 buffer) in-plane strain. The inset RHEED images were acquired with the 30 keV beam aligned along the azimuth. Examples of high-resolution Cr 2p core level spectra are depicted for α-Cr2O3 samples under high (c1) and moderate (c2) compressive strain as well as for a fully relaxed film (c3) and under high tensile strain (c4). A Shirley-type background subtraction was used for all spectra.
![Figure 1. Evolution of the relative RHEED streak spacing and Cr 2p XPS spectra during the growth of α-Cr2O3(0001) under (a) compressive (α-Cr2O3 on α-Al2O3 substrate) and (b) tensile (α-Cr2O3 on α-Fe2O3 buffer) in-plane strain. The inset RHEED images were acquired with the 30 keV beam aligned along the [11¯00] azimuth. Examples of high-resolution Cr 2p core level spectra are depicted for α-Cr2O3 samples under high (c1) and moderate (c2) compressive strain as well as for a fully relaxed film (c3) and under high tensile strain (c4). A Shirley-type background subtraction was used for all spectra.](/cms/asset/5a2ae289-393e-4a95-acb9-9a6da86ba780/tmrl_a_1863877_f0001_oc.jpg)
For all samples, the RHEED patterns (inset in Figure (a,b)) exhibit sharp streaks without spots or extra streaks, indicating a bidimensional growth mode and layers of high crystalline quality without secondary phases. A perfect epitaxial growth is mandatory for the study of strain evolution as structural defects (e.g. grain boundaries) promote relaxation phenomena and disturb the analysis [Citation19].
We focused then on the description of the Cr 2p XPS spectra of α-Cr2O3 samples in different strain scenarios. In α-Cr2O3 single layers (Figure (c1-3)), the Cr XPS spectrum have two broad peaks: one centered at 576.5 eV for the Cr 2p3/2 peak and the other centered at 586.5 eV for the Cr 2p1/2 peak. The Cr 2p1/2 envelope exhibits minor changes in all strain scenarios, whereas the multiplet splitting features of the Cr 2p3/2 envelope steadily evolve with the in-plane lattice parameter. For high compressive strain (Figure (c1)), the multiplet peak at 575.5 eV (A) is less intense than the one at 577.0 eV (B) and the splitting of the Cr 2p3/2 envelope is indistinct. Meanwhile, for moderate compressive strain or for relaxed films (Figure (c2 and c3)), we observed a remarkable splitting of the Cr 2p3/2 envelope where the multiplet peaks A and B have almost the same intensity. In the case of the bilayer, i.e. for high tensile strain of Cr2O3 (Figure (c4)), the multiplet peak A is also less intense than B; however, contrary to the high compressive strain scenario (Figure (c1)), we observed in Figure (c4) a prominent shoulder at 578.5 eV (C).
In order to account for all these subtle changes in the multiplet splitting features of the Cr 2p3/2 XPS spectra, we performed semiempirical Crystal Field Multiplet (CFM) [Citation20,Citation21] calculations. The Cr 2p XPS spectra were simulated by solving Green’s functions in second quantization using the quantum many-body program QUANTY [Citation22–24] within the graphical interface CRISPY [Citation25]. The CFM calculations describe the transitions for a single Cr3+ cation from the 3d3 initial state to the 2p53d3 final state. They result in atomic multiplets, described by the Coulomb and exchange interactions, the spin–orbit coupling and the crystal field. The 3d–3d and 2p–3d Coulomb and exchange interactions are parametrized in Slater-Condon integrals Fkdd, Fkpd (Coulomb) and Gkpd (exchange), whereas the 2p and 3d spin–orbit coupling are parametrized as ζ2p and ζ3d for ab initio Hartree–Fock calculations. In the corundum structure, the Cr3+ cations lay on the center of a slightly distorted octahedron [Citation26], where a C3 rotation axis traverses the cation and the center of the two equilateral triangles formed by the oxygen ions. Thus, the crystal field is parametrized in terms of the C3v point group by Dq, Dσ and Dτ parameters [Citation27].
The treatment of the above-mentioned parameters is described in detail elsewhere [Citation28]. In brief, we reduced the Hartree–Fock values of the Slater-Condon integrals to impute the iono-covalent behavior of the Cr-O chemical bond. The reduction factors of F2dd (54%) and F4dd (81%) were determined using the experimental Racah B and C parameters (B = 0.057 eV and C = 0.433 eV [Citation29]) through the relationship: and
. F2pd and G1pd were scaled to 80% of the associated atomic values, while G3pd was scaled to 90% to fit the distance between multiplet peaks. For the crystal field parameters, Dq was set to the experimental value of 0.208 eV [Citation29], Dσ to 0.600 eV and Dτ was optimized to fit each photoemission spectrum. For all calculated spectra, the ground state was populated with the Boltzmann distribution at 298 K. The resulting sharp peaks were convoluted with a Lorentzian and Gaussian function (FWHM = 0.3 and 0.6 eV) to mimic the broadening of the experimental spectra.
The CFM model considers the crystal field surrounding the metal ion in terms of symmetry reduction. The introduction of an octahedral field (Oh) breaks the degeneracy of the spherical 3d orbitals into two subsets of t2g and eg orbitals. The symmetry reduction from Oh to C3V is associated to a further splitting of the t2g orbital subset into a1 + e. The energy splitting (δ) between the geometric centers of a1 and e orbitals is therefore proportional to distortions in the CrO6 octahedral center. For instance, δ is calculated as ∼2 meV in a fully relaxed Cr2O3 crystal [Citation29]. However, this value may increase as a strain is applied.
In the basis of the C3v symmetry, δ is related to the crystal field parameters through the relationship: [Citation30,Citation31]. Since the value of Dσ is fixed in our study, δ depends only on the Dτ value obtained by adjusting the calculated Cr 2p3/2 envelope to the experimental one. Figure describes the results of the CFM simulations for α-Cr2O3(0001) thin films under high (Figure (a)) and moderate (Figure (b)) in-plane compression, fully relaxed (Figure (c)) and under in-plane tension (Figure (d)). For a fully relaxed film, the Cr 2p XPS spectrum is well fitted with Dτ = −0.270 ± 0.005 eV for which the t2g orbital subset is fully degenerated (δ = 0). When an in-plane compression is applied, Dτ value decreases and δ increases proportionally to the amount of strain. For instance, the spectrum of 1.1 nm α-Cr2O3 film, highly compressed through mismatch with α-Al2O3 substrate, is well fitted with Dτ = −0.295 ± 0.005 eV for which δ = 170 meV. In turn, the spectrum of partial relaxed 5.3 nm film is well fitted with Dτ = −0.280 ± 0.005 eV for which δ = 70 meV. For these samples, the 3d orbital diagrams (inset in Figure ) showed that the higher the in-plane compression, the more destabilized is a1 in relation to e orbitals. Interestingly, the tension scenario showed an opposite tendency: the in-plane tension increases the Dτ value, which decreases δ by stabilizing a1 in relation to e orbitals. For instance, the spectrum of 3.0 nm α-Cr2O3 film, strained through mismatch with α-Fe2O3 buffer, is well fitted with Dτ = −0.260 ± 0.005 eV for which δ = −70 meV.
Figure 2. Calculated Cr 2p XPS spectra (red line) in comparison with the experimental spectra (black circles) for α-Cr2O3(0001) thin films under (a) high and (b) moderate compressive strain as well as (c) fully relaxed and (d) under in-plane tension. Below each spectrum, the calculated stick diagrams (FWHM = 0.1 eV) are shown. At the top right, the relative 3d orbital diagram are plotted for Dq = 0.208 eV, Dσ = 0.600 eV and Dτ = −0.295 ± 0.005 eV (a), −0.280 ± 0.005 eV (b), −0.270 ± 0.005 eV (c) and −0.260 ± 0.005 eV (d). At the top left, a schematic representation of the CrO6 distortion are depicted.
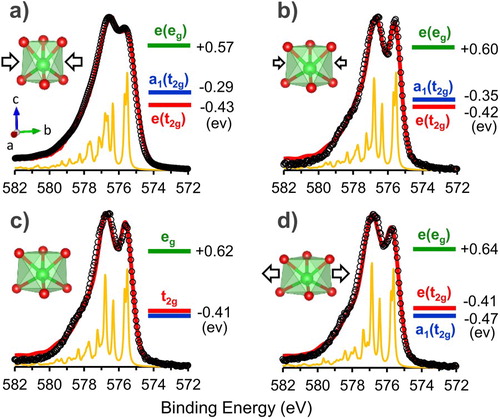
The decreasing energy of a1 regarding e orbital when switching from compression to tension scenario is indeed coherent with deformations in the xy plane. In the C3v representation [Citation32], the a1 orbital corresponds to the z2 component of the t2g subset oriented along the C3 axis. By compressing (or stretching) the xy plane, the top three as well as the bottom three ligands come closer (or move apart). Epitaxial thin films of α-Cr2O3(0001) compensate the in-plane lattice strain by relaxation of out-of-plane lattice parameter and internal angles, as indicated by high-resolution transmission electron microscopy [Citation15,Citation33]. Hence, a lateral compression of α-Cr2O3(0001) layer limits the space of the z2 component and destabilizes a1 (Figure (a)), whereas a lateral tension acts in the opposite way (Figure (d)).
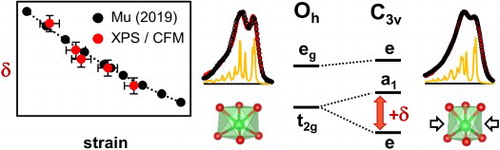
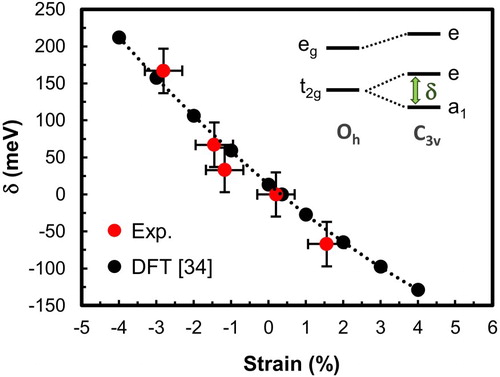
The quantitative relationship between the energy splitting δ extracted from experimental photoemission spectra (Figure ) and the residual strain determined using the RHEED images (Figure ) is depicted in Figure . Herein, we observed that δ decreases under increasing strain and crosses zero at a small positive value of strain. These results bring great support to theoretical predictions reported recently by Mu and Belashchenko [Citation34]. Both our experimental findings and results of first principles calculations are almost superimposed, as shown in Figure .
The energy splitting δ is a key parameter to fine-tune the structural and physical properties of thin films. According to literature [Citation34], even small changes of 30 meV in δ are enough to make positive the magnetocrystalline anisotropy of Cr2O3. In our study, this value of δ appears in α-Fe2O3-buffered Cr2O3 layers under 1.6% of lateral tension (Figure ), for which an enhanced magnetocrystalline anisotropy energy is known [Citation35,Citation36].
Figure 3. Evolution of the t2g level splitting δ with epitaxial strain. The positive or negative sign of the δ parameter indicates that a1 orbital is above or below e orbital, respectively. In inset, a schema of the 3d energy level for octahedral and trigonal symmetry highlighting the value of the δ parameter.
In conclusion, we have grown epitaxial α-Cr2O3(0001) thin films under different strain scenarios from compressive, tensile to fully relaxed state. The subtle line-shape differences of the Cr 2p X-ray photoemission spectra were explored via Crystal field multiplet calculations in order to extract the crystal field parameters and retrieve the 3d orbital diagram of Cr2O3 in each strain scenario. The careful analysis of the Cr photoemission spectra allowed us to interpret the multiplet features of Cr 2p3/2 envelope in the light of deformations in the CrO6 octahedron. This convenient methodology provides a structural tool for understanding the influence of strain on the electronic structure of complex oxides.
Acknowledgements
Internal financial support of the RSTB/RBNEW Project is acknowledged.
Disclosure statement
No potential conflict of interest was reported by the author(s).
References
- Hu J-M, Nan C-W. Opportunities and challenges for magnetoelectric devices. APL Mater. 2019;7:080905.
- Cheong S-W, Fiebig M, Wu W, et al. Seeing is believing: visualization of antiferromagnetic domains. Quantum Mater. 2020;5:1–2.
- Kosub T, Kopte M, Radu F, et al. All-electric access to the magnetic-field-invariant magnetization of antiferromagnets. Phys Rev Lett. 2015;115:097201.
- Kosub T, Kopte M, Hühne R, et al. Purely antiferromagnetic magnetoelectric random access memory. Nat Commun. 2017;8:13985.
- He X, Wang Y, Wu N, et al. Robust isothermal electric control of exchange bias at room temperature. Nat Mater. 2010;9:579–585.
- Wang J-L, Echtenkamp W, Mahmood A, et al. Voltage controlled magnetism in Cr2O3 based all-thin-film systems. J Magn Magn Mater. 2019;486:165262.
- Gorodetsky G, Hornreich RM, Shtrikman S. Magnetoelectric determination of the pressure-induced TN shift in Cr2O3. Phys Rev Lett. 1973;31:938–940.
- Nozaki T, Sahashi M. Magnetoelectric manipulation and enhanced operating temperature in antiferromagnetic Cr2O3 thin film. Jpn J Appl Phys. 2018;57:0902A2.
- Kota Y, Imamura H, Sasaki M. Strain-induced néel temperature enhancement in corundum-type Cr2O3 and Fe2O3. Appl Phys Express. 2013;6:113007.
- Gupta RP, Sen SK. Calculation of multiplet structure of core p-vacancy levels. II. Phys Rev B. 1975;12:15–19.
- Biesinger MC, Brown C, Mycroft JR, et al. X-ray photoelectron spectroscopy studies of chromium compounds. Surf Interf Anal. 2004;36:1550–1563.
- Zhang L, Kuhn M, Diebold U. Growth, structure and thermal properties of chromium oxide films on Pt(111). Surf Sci. 1997;375:1–12.
- Chambers SA, Droubay T. Role of oxide ionicity in electronic screening at oxide/metal interfaces. Phys Rev B. 2001;64:075410.
- Bataillou L, Martinelli L, Desgranges C, et al. Growth kinetics and characterization of chromia scales formed on Ni–30Cr alloy in impure argon at 700°C. Oxid Met. 2020;93:329–353.
- Chambers SA, Liang Y, Gao Y. Noncommutative band offset at α-Cr2O3/α-Fe2O3(0001) heterojunctions. Phys Rev B. 2000;61:13223–13229.
- Moussy J-B. From epitaxial growth of ferrite thin films to spin-polarized tunnelling. J Phys D: Appl Phys. 2013;46:143001.
- Barbier A, Belkhou R, Ohresser P, et al. Electronic and crystalline structure, morphology, and magnetism of nanometric Fe2O3 layers deposited on Pt(111) by atomic-oxygen-assisted molecular beam epitaxy. Phys Rev B. 2005;72:245423.
- Barbier A, Bezencenet O, Mocuta C, et al. Dislocation network driven structural relaxation in hematite thin films. Mater Sci Eng B. 2007;144:19–22.
- Spaepen F. Interfaces and stresses in thin films. Acta Mater. 2000;48:31–42.
- De Groot F, Kotani A. Core level spectroscopy of solids. Boca Raton: CRC Press; 2008.
- Cowan RD. The theory of atomic structure and spectra. Berkeley: University of California Press; 1981.
- Haverkort MW, Zwierzycki M, Andersen OK. Multiplet ligand-field theory using Wannier orbitals. Phys Rev B. 2012;85:165113.
- Haverkort MW, Sangiovanni G, Hansmann P, et al. Bands, resonances, edge singularities and excitons in core level spectroscopy investigated within the dynamical mean-field theory. Europhys Lett. 2014;108:57004.
- Lu Y, Höppner M, Gunnarsson O, et al. Efficient real frequency solver for dynamical mean field theory. Phys Rev B. 2014;90:085102.
- Retegan M. Crispy: version 0.7.3 [Internet]. 2019. DOI:10.5281/zenodo.1008184.
- Newnham RE, Haan YM. Refinement of the α-Al2O3, Ti2O3, V2O3 and Cr2O3 structures. Zeitschr Kristallogr. 1962;117:235–237.
- Konig E, Kremer S. Ligand field: energy diagrams. New York: Plenum Press; 1977.
- Vasconcelos Borges Pinho P, Chartier A, Moussy J-B, et al. Crystal field effects on the photoemission spectra in Cr2O3 thin films: from multiplet splitting features to the local structure. Materialia. 2020;12:100753.
- Brik MG, Avram NM, Avram CN. Crystal field analysis of energy level structure of the Cr2O3 antiferromagnet. Solid State Commun. 2004;132:831–835.
- Vercamer V, Hunault MOJY, Lelong G, et al. Calculation of optical and K pre-edge absorption spectra for ferrous iron of distorted sites in oxide crystals. Phys Rev B. 2016;94:1–15.
- Juhin A, Brouder C, Arrio M-A, et al. X-ray linear dichroism in cubic compounds: the case of Cr3+ in MgAl2O4. Phys Rev B. 2008;78:1–19.
- Kang SK, Tang H, Albright TA. Structures for d0 ML6 and ML5 complexes. J Am Chem Soc. 1993;115:1971–1981.
- Kaspar TC, Chamberlin SE, Bowden ME, et al. Impact of lattice mismatch and stoichiometry on the structure and bandgap of (Fe,Cr)2O3 epitaxial thin films. J Phys Condens Matter. 2014;26:135005.
- Mu S, Belashchenko KD. Influence of strain and chemical substitution on the magnetic anisotropy of antiferromagnetic Cr2O3: an ab-initio study. Phys Rev Mater. 2019;3:034405.
- Shimomura N, Pati SP, Nozaki T, et al. Enhancing the blocking temperature of perpendicular-exchange biased Cr2O3 thin films using buffer layers. AIP Adv. 2017;7:025212.
- Nozaki T, Shiokawa Y, Kitaoka Y, et al. Large perpendicular exchange bias and high blocking temperature in Al-doped Cr2O3/Co thin film systems. Appl Phys Express. 2017;10:073003.