
 ?Mathematical formulae have been encoded as MathML and are displayed in this HTML version using MathJax in order to improve their display. Uncheck the box to turn MathJax off. This feature requires Javascript. Click on a formula to zoom.
Abstract
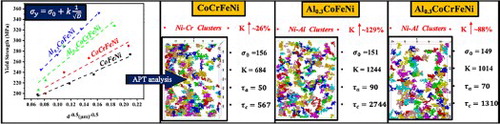
This paper reports a dramatic increase in the grain boundary strengthening or Hall-Petch coefficient, K, by systematically investigating the effect of Al addition on tensile yield strength in CoFeNi and CoCrFeNi high entropy alloys (HEAs) or complex concentrated alloys (CCAs). Additionally, detailed atom probe tomography (APT) revealed a high number density of Ni-Al rich nano-clusters in the Al0.3CoFeNi and Al0.3CoCrFeNi HEAs/CCAs, which can be rationalized based on the strong chemical ordering tendency between these elements. Consequently, the huge increase in K value can be attributed to the additional stress required for overcoming coherency strain fields arising from these nano-clusters.
GRAPHICAL ABSTRACT
IMPACT STATEMENT
This paper reports that the Hall-Petch co-efficient (K) dramatically increase when Al is added to CoFeNi/CoCrFeNi alloys. Such a trend is attributed to the ordering mediated nano-clustering in Al containing HEA/CCAs.
Introduction
While there has been an explosion in research on high entropy alloys (HEAs) or complex concentrated alloys (CCAs), there remain some fundamental gaps in the understanding of the nature of the concentrated solid solution in these alloys [Citation1,Citation2]. Wu et.al have investigated the equi-atomic CoFeNi and CoCrFeNi HEA/CCAs [Citation3]. Despite both these HEA/CCAs being single-phase FCC in the solution treated and quenched condition, they exhibited good mechanical properties [Citation3,Citation4]. However, the literature suggests that their properties could further be enhanced by adding elements like Al [Citation5], Ti [Citation6,Citation7], Cu [Citation8,Citation9], Mn [Citation10]. Of all these elements, addition of Al and Ti, possibly due to their inherently larger atomic radii, have been reported to result in the maximum enhancement in mechanical properties. However, the role of Al and Ti in solid-solution strengthening of these HEA/CCAs remains somewhat unclear. Additionally, the same alloying elements also tend to introduce chemical ordering in the face-centered cubic (FCC) solid solution of CoCrFeNi based HEA/CCAs, leading to further enhancement of their mechanical properties due to the formation of strong intermetallic precipitates [Citation5,Citation11–13].
While there are quite a few reports in the literature on developing the Hall-Petch relation for CoFeNi, CoCrFeNi and Al0.3CoCrFeNi HEA/CCAs [Citation4], there are no reports for the Al0.3CoFeNi HEA/CCA. The typical Hall Petch expression for tensile yield strength is given as: [Citation14] where
is the lattice friction stress, K is the grain boundary (or Hall-Petch) strengthening coefficient, and d is the average grain size. Both the parameters, friction stress
and slope (K) are likely to be dependent on the composition and the crystal structure of the matrix phase. There is stark disagreement in the published literature with respect to the values of
and K values for many HEA/CCAs, including Al0.3CoCrFeNi [Citation15,Citation16]. Therefore, in order to reconcile the data from earlier studies and to address inconsistencies, in the present study, Hall-Petch analysis has been performed systematically on the four HEA/CCAs. The conventional thermomechanical processing (cold rolling and solution treatment) has been employed in this study for appropriate comparison with other alloy systems. Additionally, based on detailed transmission electron microscopy (TEM) and atom probe tomography (APT) investigations, a modified dislocation pile-up model has been used for explaining the Hall-Petch behavior of the two Al containing HEA/CCAs, Al0.3CoFeNi and Al0.3CoCrFeNi.
For this study, pre-alloyed bars of Al0.3CoCrFeNi, Al0.3CoFeNi, CoCrFeNi and CoFeNi CCAs were obtained from ACI alloys, California. All the alloys were homogenized at 1200°C/1 hr and cold rolled to 90%. All the rolled samples were encapsulated in quartz tube backfilled with Argon and then solutionized at different time intervals and temperatures as per supplementary Table S1. The solutionizing temperatures for the first set (CoFeNi and Al0.3CoFeNi) and the second set (CoCrFeNi and Al0.3CoCrFeNi) of CCAs were chosen based on CALPHAD simulated pseudo-binary phase diagrams shown in supplementary Figs. S1(a) and S1(b), respectively. Tensile specimens of dimensions, 5 mm gauge length, ∼1 mm width and ∼0.8 mm thickness were machined from the solutionized samples of all four CCAs using Kent Wire saw EDM WSI-200. Electron back scatter diffraction (EBSD) was carried out using FEI-Quanta Nova-Nano SEM 230. OIMTM software was used to produce Inverse Pole Figure (IPF) maps and to subsequently obtain the average grain sizes from the EBSD scans. The grain sizes were determined from EBSD using the ‘grain size (diameter)’ tool in the TSLTM OIM software. This tool determines the grain size assuming equivalent grain radius model. For all the alloys, annealing twins were considered to be a part of the parent grain and not as a separate grain. The supplementary Table S1 summarizes the heat treatment times and temperatures along with resultant grain sizes. Further, IPF maps showing the various grain sizes produced via thermo-mechanical processing of CoFeNi, Al0.3CoFeNi, CoCrFeNi and Al0.3CoCrFeNi, are represented in the supplementary Figs. S2-S5, respectively. At least four tensile tests were performed at strain rate of 10−3 s−1 for each condition. TEM and APT lift-outs were prepared using FEI Nova 200 dual-beam focused ion beam (FIB) microscope. TEM foils were characterized using FEI Tecnai G2 F20 ST S/TEM, a transmission electron microscope (TEM operating at 200 kV). APT was performed using Cameca LEAP 5000XS 3D Atom Probe Microscope operating at a temperature of 30 K, pulse rate of 200 kHz, and a detection rate of 0.005-0.01 ion/pulse in laser mode with laser pulse energy of 50 nJ. IVAS 3.8.4 software was used to analyze the APT data.
The tensile engineering stress–strain curves for various grain sizes in CoFeNi, Al0.3CoFeNi, CoCrFeNi and Al0.3CoCrFeNi CCAs are shown in Figures (a-d), respectively. The corresponding linear fitted yield stress vs plots for these CCAs are shown in Figure (e). The increasing trend in yield stress is consistent with decreasing grain size for all four CCAs. Additionally, all the alloys exhibited substantial strain hardening and good ductility for all grain sizes. Further, based on the linear fittings (Figure (e)), the y-intercepts
and slopes (K) were determined to be 157 and 541 MPa
in case of CoFeNi, and 151 and 1244 MPa
in case of Al0.3CoFeNi, respectively. Similarly,
and K values were found out to be 156 and 684 MPa
for CoCrFeNi, and 149 and 1014 MPa
for Al0.3CoCrFeNi, respectively. The lattice friction stress
and Hall-Petch coefficient (K) for all four CCAs are listed in Table . Comparing these Hall-Petch parameters for both base alloys (without Al), CoCrFeNi and CoFeNi, with those previously reported for the same alloys [Citation14], while
values are comparable for CoCrFeNi, the K value is substantially larger in the present case. With regards to Al0.3CoCrFeNi alloy, there are extremely different values of
and K reported in the literature [Citation15,Citation16]. The values of
and K have been reported to be 95 and 824 MPa
in one case [Citation15], while they have been reported to be 193 and 15 MPa
in the other case [Citation16]. These previously reported values highlight the inconsistencies in the published literature with respect to the Hall-Petch coefficients for the same HEA/CCA. It should be noted that, the lattice friction stress
values for all four CCAs obtained in the current study are nearly identical ∼150 MPa. Interestingly however, the K values for the CCAs containing Al, i.e. Al0.3CoFeNi (1244 MPa
) and Al0.3CoCrFeNi (1014 MPa
) are substantially higher as compared to their counterpart base alloys (without Al), CoFeNi (541 MPa
) and CoCrFeNi (684 MPa
). These remarkable increases in the Hall-Petch coefficients (K), ∼130% in case of CoFeNi and ∼48% in case of CoCrFeNi is clearly an outcome of Al addition. However, the underlying rationale, associating these staggering increases in K values, due to Al addition is not evident. Therefore, detailed microstructural characterization of all the CCAs was carefully carried out using TEM and APT.
Figure 1. Engineering Stress versus Plastic Strain plots for (a) CoFeNi, (b) Al0.3CoFeNi, (c) CoCrFeNi and (d) Al0.3CoCrFeNi CCAs. (e) Yield Strength versus 1/√d plots for CoFeNi, Al0.3CoFeNi, CoCrFeNi and Al0.3CoCrFeNi CCAs.
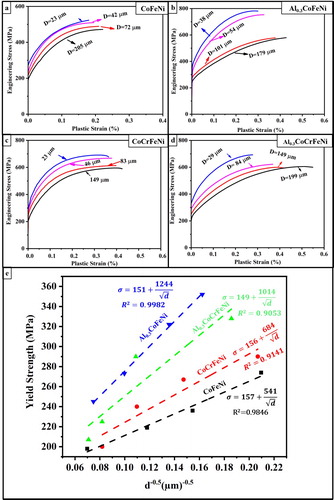
Table 1. Lattice friction stress (σ0) and Hall-Petch strengthening co-efficient (K) values along with the grain size range for each alloy.
The results of the TEM and APT analysis for the base alloys, CoFeNi and CoCrFeNi are shown in Figures and , respectively. The Selected Area Electron Diffraction (SAED) pattern recorded from [011] FCC zone axis is shown in Figure (a). The SAED pattern does not reveal any super lattice reflections which indicates the absence of any secondary phases/ordering in the CoFeNi CCA. Besides, the ion maps for Fe and Ni from APT reconstruction shown in Figures (b) and (c), respectively suggest a homogenous distribution of the elements. Further, frequency distribution analysis for Ni ions was performed on a 30 × 30 × 40 nm3 volume of the total reconstruction, and the resultant curves are shown in Figure (d). In this plot, the dotted black line shows the theoretical/binomial Ni distribution while the solid back curve shows the Ni distribution from CoFeNi APT dataset. These curves do not reveal any statistically significant non-random distribution. The SAED pattern recorded from [011] FCC zone axis of CoCrFeNi CCA represented in Figure (a) does not provide any evidence for second phase precipitation/ordering in this alloy. Also, the Ni and Cr ion maps from APT reconstructions, shown in Figures (b,c), do not reveal any apparent compositional partitioning within the FCC phase. However, the frequency distribution analysis (Figure (d)) performed on a volume of 30 × 30 × 40 nm3 indicated a non-random distribution for the Ni and Cr ions. Further, cluster analysis was carried out using the maximum separation method [Citation17,Citation18] on Ni and Cr ions, since these ions exhibited non-random distribution. Additionally, from a thermodynamic standpoint, Ni-Cr pairs exhibit the maximum affinity for mixing () as compared to Ni-Fe
and Ni-Co (
) pairs. The binary interaction parameter or regulation solution parameter for the various binary pairs are listed in supplementary Table S2. The 3D reconstruction of Ni-Cr rich clusters obtained from the volume of 30 × 30 × 40 nm3 is shown in Figure (e) and composition of the clusters and matrix are shown in Figure (f). It has to be noted that the Ni-Cr rich domains are referred to as clusters in APT terminology but are actually short-range ordered domains according to thermodynamics, based on the preferential pairing of unlike atoms.
Figure 2. SAED pattern obtained from [101] Zone Axis for CoFeNi CCA. APT results for CoFeNi CCA: Reconstructed ion maps for (b) Fe and (c) Ni. (d) Observed (solid line) and theoretical/binomial (dotted line) frequency distributions for Ni.
![Figure 2. SAED pattern obtained from [101] Zone Axis for CoFeNi CCA. APT results for CoFeNi CCA: Reconstructed ion maps for (b) Fe and (c) Ni. (d) Observed (solid line) and theoretical/binomial (dotted line) frequency distributions for Ni.](/cms/asset/14fec1a5-6a32-466e-a68e-49afb0262dbd/tmrl_a_1871440_f0002_oc.jpg)
Figure 3. (a) SAED pattern obtained from [101] Zone Axis for CoCrFeNi CCA. APT results for CoCrFeNi CCA: Reconstructed ion maps for (b) Ni and (c) Cr. (d) Observed (solid line) and theoretical/binomial (dotted line) frequency distributions for Ni. (e) 3D reconstruction of Ni-Cr rich clusters obtained via cluster analysis and (f) Table listing the composition of the matrix and the Ni-Cr clusters.
![Figure 3. (a) SAED pattern obtained from [101] Zone Axis for CoCrFeNi CCA. APT results for CoCrFeNi CCA: Reconstructed ion maps for (b) Ni and (c) Cr. (d) Observed (solid line) and theoretical/binomial (dotted line) frequency distributions for Ni. (e) 3D reconstruction of Ni-Cr rich clusters obtained via cluster analysis and (f) Table listing the composition of the matrix and the Ni-Cr clusters.](/cms/asset/2836be95-3d9e-4f91-b39d-9df20905b524/tmrl_a_1871440_f0003_oc.jpg)
The TEM and APT results from the Al-containing CCAs, Al0.3CoFeNi and Al0.3CoCrFeNi are shown in Figures and , respectively. Similar to the base alloys (without Al), CoFeNi and CoCrFeNi, the SAED pattern shown in Figure (a), recorded using [011] FCC zone axis, indicates a single-phase FCC microstructure for the Al0.3CoFeNi CCA. Additionally, the Ni ion map (Figure (b)) from the APT data, appear to be homogenous without any obvious signs of chemical partitioning. However, the frequency distribution analysis revealed a significant deviation from the binomial distribution for Ni ions (Figure (c)) and therefore cluster analysis was performed on Ni-Al pairs (, Refer Table S1), using maximum separation method. The 3D reconstruction of Ni-Al rich clusters obtained from the volume of 30 × 30 × 40 nm3 is shown in Figure (d) and composition of the clusters and matrix are shown in Figure (e). The size scale and volume fraction of clusters are also shown on Figure (d). Similar to the other CCAs, Al0.3CoCrFeNi exhibited a single-phase microstructure as per the SAED pattern shown in Figure (a). Further, the Ni ion map reconstructed using APT data shown in Figure (b) appears identical to the one obtained for Al0.3CoFeNi (Figure (b)), without any noticeable chemical inhomogeneity. However, the frequency distribution analysis shows a significant deviation from the binomial distribution for Ni ions (Figure (c)). Subsequently, cluster analysis was performed on Ni-Al pair using maximum separation method. The 3D reconstructed map of Ni-Al rich clusters obtained from the volume of 30 × 30 × 40 nm3 is shown in Figure (d) and composition for the clusters and matrix are shown in Figure (e). The size scale and volume fraction of clusters are also shown on Figure (d). In summary, the detailed APT investigations revealed nano-scale clustering of Ni & Cr in CoCrFeNi and Ni & Al in Al0.3CoFeNi and Al0.3CoCrFeNi CCAs. This further establishes the non-random nature of the FCC solid solution phase constituting these CCAs. It should be noted that the CCAs that exhibited clustering namely, CoCrFeNi, Al0.3CoFeNi and Al0.3CoCrFeNi showed higher Hall-Petch Coefficient (K) values than that of CoFeNi which exhibited a truly single-phase FCC microstructure, indicating a significant influence of clustering on the determined K values.
Figure 4. (a) SAED pattern obtained from [101] Zone Axis for Al0.3CoFeNi CCA. APT results for Al0.3CoFeNi CCA: (b) Reconstructed Ni ion map and (c) Observed (solid line) and theoretical/binomial (dotted line) frequency distributions for Ni. (d) 3D reconstruction of Ni-Al rich clusters obtained via cluster analysis and (e) Table listing the composition of the matrix and the Ni-Al clusters.
![Figure 4. (a) SAED pattern obtained from [101] Zone Axis for Al0.3CoFeNi CCA. APT results for Al0.3CoFeNi CCA: (b) Reconstructed Ni ion map and (c) Observed (solid line) and theoretical/binomial (dotted line) frequency distributions for Ni. (d) 3D reconstruction of Ni-Al rich clusters obtained via cluster analysis and (e) Table listing the composition of the matrix and the Ni-Al clusters.](/cms/asset/de585424-f085-4ba7-866b-4f8f9989e38a/tmrl_a_1871440_f0004_oc.jpg)
Figure 5. (a) SAED pattern obtained from [101] Zone Axis for Al0.3CoCrFeNi CCA. APT results for Al0.3CoCrFeNi CCA: (b) Reconstructed Ni ion map and (c) Observed (solid line) and theoretical/binomial (dotted line) frequency distributions for Ni. (d) 3D reconstruction of Ni-Al rich clusters obtained via cluster analysis and (e) Table listing the composition of the matrix and the Ni-Al clusters.
![Figure 5. (a) SAED pattern obtained from [101] Zone Axis for Al0.3CoCrFeNi CCA. APT results for Al0.3CoCrFeNi CCA: (b) Reconstructed Ni ion map and (c) Observed (solid line) and theoretical/binomial (dotted line) frequency distributions for Ni. (d) 3D reconstruction of Ni-Al rich clusters obtained via cluster analysis and (e) Table listing the composition of the matrix and the Ni-Al clusters.](/cms/asset/5272237c-9b79-40ac-b30f-3c7f37346154/tmrl_a_1871440_f0005_oc.jpg)
The Ni-Al rich domains found in this study are a result of the thermodynamic driving force for ordering between Ni and Al. The ordered domains could have formed either during solutionizing treatment or water quenching. In this study, high temperatures (>1100°C) were employed for solution annealing treatments where entropic contribution to free energy is expected to be dominant. Therefore, with increasing temperature in the single FCC phase-field the SRO tendency will eventually be obviated by entropy. During water quenching, the SRO is expected to develop and intensify with decreasing temperature. Therefore, it is more likely that these SRO domains formed during the process of quenching from the high temperature single FCC phase field to room temperature.
Assuming that these domains likely formed during water quenching, and a simplistic case of Al diffusing in Ni, diffusion distance calculations have performed to understand the length scale involved in the formation of these domains using the following equations:
where x is the diffusion length, t is time, D is the diffusivity at a temperature T, Do is the diffusivity at infinite temperature, Q is the activation energy and R is the gas constant. The Do and Q values were taken to be 1 cm2/s and 260 kJ/mol, which were determined for Al diffusivity in Ni in a temperature range of 919–1212 K [Citation19]. The diffusion lengths were calculated for a temperature range of 800°C-200°C and are tabulated in supplementary table S3. The maximum temperature of 800°C was chosen to have a significant thermodynamic driving force for SRO formation and a minimum temperature of 200°C was chosen to allow significant diffusion. It can be observed form this table that the formation of ∼4 nm diameter Ni-Al rich clusters as observed in APT is quite possible during water quenching the solid solution to room temperature. Based on this argument, the holding time at solutionizing temperature is not expected to influence the size and inter-domain spacing of the SRO domains. Therefore, we would not expect a change in inter-domain spacing for different grain sizes in the same alloy.
Further, an attempt has been made to understand the factors influencing the Hall-Petch coefficient (K) using a dislocation pileup model proposed by Armstrong [Citation20,Citation21].
where
; m, Taylor factor = 3.06; ms, Sachs orientation factor = 2.2; G,
and b are the shear modulus, poissons ratio and magnitude of Burgers vector, respectively. The values of G,
for CoFeNi and CoCrFeNi were adopted from Yoshida et.al. [Citation4] and are assumed to be the same for Al-containing counterparts. The values of Burger’s vector was taken as ∼0.253 nm based on the FCC lattice parameters obtained from XRD.
According to the dislocation pileup model, grain boundaries tend to act as obstacles to the dislocations moving in a slip plane. If a dislocation source is assumed to be at the center of the grain, dislocation pileups of length equal to D/2 (D is the grain diameter) are formed against the grain boundaries. The pileup process continues until the net resolved stress (τ) ahead of the pileup reaches a critical value (τc). At this moment, i.e. when net τ Z τc, the neighboring grain starts yielding which marks the onset of plastic deformation in the material. In other words,
is the critical resolved shear stress that is required to transmit the deformation from an already deforming grain to a neighboring grain [Citation22]. This transmission occurs by the activation of a new dislocation source ahead of the pileup in the neighboring grain [Citation23]. Therefore, it can be understood that the value of critical resolved shear stress parameter, τc is determined by the initial microstructure of the material. The calculated τc values for all the four alloys are listed in Table . It can be observed that τc values in Al0.3CoFeNi and Al0.3CoCrFeNi are far higher than in CoFeNi and CoCrFeNi. Using the τc values, resolved shear stress (applied) to overcome grain boundary barrier,
can be back calculated using the equation below [Citation20,Citation24]:
where, D is grain diameter which is taken as 20 µm for all alloys. The calculated
values are tabulated in Table . Clearly, the
values are higher in case of Al containing alloys. Interestingly, the increase in
values can be understood in terms of the coherency strengthening caused by Ni-Al rich clusters. The strengthening from short-range ordering (SRO) has been estimated using the coherency strain field equation given below [Citation12,Citation25]:
where
is the constrained lattice mismatch between cluster and the matrix, r is the radius of cluster and f is volume fraction of clusters. The calculated contributions are 125 MPa for Al0.3CoFeNi and 31 MPa for Al0.3CoCrFeNi. For comparison, coherency stress caused by L12 precipitates in an FCC matrix in an austenitic steel has been calculated based on the reported lattice misfit strain of 0.42% [Citation26]. For similar radius and volume fraction of ∼2 nm and 12%, the coherency stress was calculated to be ∼60 MPa. However, it has to be noted that order strengthening which arises from the energy involved in shearing the ordered domains (anti-phase boundary energy) is a dominant strengthening mechanism as the domains are ordered precipitates in the FCC-L12 case. Nevertheless, the coherency stress caused by L12 precipitates in FCC matrix is in agreement with the values calculated in the current study. Further, the coherency stresses can be converted to shear stress using the Taylor factor, which yields 41 MPa for Al0.3CoFeNi and 10 MPa for Al0.3CoCrFeNi. Adding the coherency shear stress to the applied shear stress of CoFeNi/CoCrFeNi gives 80.5 MPa (39.5 + 41 MPa) for Al0.3CoFeNi and 60 MPa (50 + 10 MPa) for Al0.3CoCrFeNi. These values are in reasonable agreement with the
values back-calculated from
.
Table 2. Calculated critical shear stress (), coherency strengthening, resolved shear stress for overcoming grain boundary barrier (
), and predicted
.
In summary, Hall Petch analysis has been conducted on four FCC based CCAs namely CoFeNi, CoCrFeNi, Al0.3CoFeNi and Al0.3CoCrFeNi in order to investigate the effect of Al content on the Hall-Petch parameters, σ0 and K. From the derived Hall-Petch expressions, it is clear that increasing Al content has a significant effect on the Hall-Petch coefficient (K) but not on the friction stress (σ0). The underlying reasons have been studied using advanced characterization techniques like TEM and APT. Nano clusters of Ni-Cr were found in CoCrFeNi and Ni-Al were found in Al0.3CoCrFeNi and Al0.3CoFeNi CCAs. Further, a modified version of dislocation pile-up model has been used to model the contribution of Ni-Al rich clusters to the observed increments in Hall-Petch coefficient (K).
Supplemental Material
Download MS Word (2.9 MB)Acknowledgements
The work was supported by cooperative agreement between the US Army Research Laboratory and the University of North Texas (grant number W911NF-16-2-0189), and the US Air Force Office of Scientific Research (grant number FA9550-17-1-0395). The authors acknowledge the Materials Research Facility (MRF) at the University of North Texas for use of microscopy facilities.
Disclosure statement
No potential conflict of interest was reported by the author(s).
Data availability
The data that support the findings of this study are available from the corresponding author upon reasonable request.
Additional information
Funding
References
- Miracle DB, Senkov ON. A critical review of high entropy alloys and related concepts. Acta Mater. 2017;122:448–511.
- Zhang Y, Zuo TT, Tang Z, et al. Microstructures and properties of high-entropy alloys. Prog Mater Sci. 2014;61:1–93.
- Wu Z, Bei H, Otto F, et al. Recovery, recrystallization, grain growth and phase stability of a family of FCC-structured multi-component equiatomic solid solution alloys. Intermetallics. 2014;46:131–140.
- Yoshida S, Ikeuchi T, Bhattacharjee T, et al. Effect of elemental combination on friction stress and Hall-Petch relationship in face-centered cubic high / medium entropy alloys. Acta Mater. 2019;171:201–215.
- Wang WR, Wang WL, Wang SC, et al. Effects of Al addition on the microstructure and mechanical property of Al xCoCrFeNi high-entropy alloys. Intermetallics. 2012;26:44–51.
- Fujieda T, Chen M, Shiratori H, et al. Mechanical and corrosion properties of CoCrFeNiTi-based high-entropy alloy additive manufactured using selective laser melting. Addit Manuf. 2019;25:412–420.
- Fu Z, Chen W, Xiao H, et al. Fabrication and properties of nanocrystalline Co0.5FeNiCrTi0.5 high entropy alloy by MA-SPS technique. Mater Des. 2013;44:535–539.
- Lin CM, Tsai HL. Effect of annealing treatment on microstructure and properties of high-entropy FeCoNiCrCu0.5 alloy. Mater Chem Phys. 2011;128:50–56.
- Tao WJ, Zhang WQ, Fu HM. Diffusion behavior of Cu and Ni atoms in CuCoCrFeNi high entropy alloy. Cailiao Rechuli Xuebao/Transactions Mater Heat Treat. 2017;38:34–39.
- Rogachev AS, Vadchenko SG, Kochetov NA, et al. Structure and properties of equiatomic CoCrFeNiMn alloy fabricated by high-energy ball milling and spark plasma sintering. J Alloys Compd. 2019;805:1237–1245.
- Dasari S, Jagetia A, Soni V, et al. Engineering transformation pathways in an Al0.3CoFeNi complex concentrated alloy leads to excellent strength–ductility combination. Mater Res Lett. 2020;8:399–407.
- Nartu MSKKY, Alam T, Dasari S, et al. Enhanced tensile yield strength in laser additively manufactured Al0.3CoCrFeNi high entropy alloy. Materialia. 2020; 9:100522.
- Gwalani B, Gorsse S, Choudhuri D, et al. Tensile yield strength of a single bulk Al 0.3 CoCrFeNi high entropy alloy can be tuned from 160 MPa to 1800 MPa. Scr Mater. 2019;162:18–23.
- Petch NJ. The ductile-brittle transition in the fracture of α-iron: I. Philos Mag. 1958;3:1089–1097.
- Gwalani B, Soni V, Lee M, et al. Optimizing the coupled effects of Hall-Petch and precipitation strengthening in a Al 0.3 CoCrFeNi high entropy alloy. Mater Des. 2017;121:254–260.
- Annasamy M, Haghdadi N, Taylor A, et al. Static recrystallization and grain growth behaviour of Al 0.3 CoCrFeNi high entropy alloy. Mater Sci Eng A. 2019;754:282–294.
- Hyde JM, Marquis EA, Wilford KB, et al. A sensitivity analysis of the maximum separation method for the characterisation of solute clusters. Ultramicroscopy. 2011;111:440–447.
- Stephenson LT, Moody MP, Liddicoat P V, et al. New techniques for the analysis of fine-scaled clustering phenomena within atom probe tomography (APT) data. Microsc Microanal. 2007;13(6): 448–463.
- Gale WF, Totemeier TC. Smithells metals reference book. Smithells Met. Ref. B. 2003.
- Armstrong RW. Hall-Petch analysis of yield, flow and fracturing. Mater Res Soc Symp - Proc. 1995.
- Hughes GD, Smith SD, Pande CS, et al. Hall-petch strengthening for the microhardness of twelve nanometer grain diameter electrodeposited nickel. Scr Metall. 1986;20:93–97.
- Li JCM, Chou YT. The role of dislocations in the flow stress grain size relationships. Metall Mater Trans. 1970;1:1145–1159.
- Cottrell AH. Theory of Brittle Fracture. Trans Met Soc AIME. 1958;212:369–374.
- Meyers MA, Chawla KK. Mechanical behavior of materials. Cambridge: Cambridge university press; 2008.
- Guo Z, Sha W. Quantification of precipitation hardening and evolution of precipitates. Mater Trans. 2002;43:1273–1282.
- Singhal LK, Martin JW. The mechanism of tensile yield in an age-hardened steel containing γ′ (ordered Ni3Ti) precipitates. Acta Metall. 1968;16:947–953.