
 ?Mathematical formulae have been encoded as MathML and are displayed in this HTML version using MathJax in order to improve their display. Uncheck the box to turn MathJax off. This feature requires Javascript. Click on a formula to zoom.
Abstract
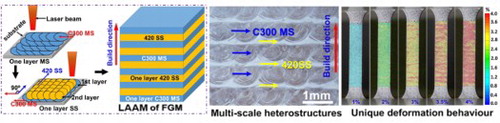
Additive manufacturing (AM) enables the processing of heterogeneous materials with customised architectures to improve strength-ductility synergy. Herein, layerwise-heterostructured high-strength steels were processed by AM of two steel powders following the designed architectures. The fabricated high-strength steels with hierarchical heterogeneous characteristics at the layer, melt-pool and grain scales, exhibit good strength-ductility combination, reaching a strength of 1.32 GPa together with an elongation of 7.5%. The increased strength attributes to hetero-deformation induced strengthening. In-situ deformation monitoring reveals many unique deformation bands in heterostructure materials, which delays necking and improves ductility. The findings demonstrate a novel potential approach to circumvent material property trade-offs.
GRAPHICAL ABSTRACT
IMPACT STATEMENT
Additively manufactured heterogeneous materials with controllable architectures achieved a good strength-ductility combination; the underlying strengthening mechanism and unique deformation behaviour are revealed.
1. Introduction
The strength-ductility trade-off is a longstanding challenge existing in engineering metallic materials, considering that the improvement in strength generally leads to a reduction in ductility, and vice versa [Citation1]. Recently, metallic materials with engineered gradient structures [Citation2], heterogeneous microstructure [Citation3], twinning [Citation1] and hierarchical microstructure [Citation4], are demonstrated as potential methods for achieving both high strength and high ductility. For instance, the deformation twins in metallic materials is an essential deformation mechanism (distinct from dislocation slipping principle), which results in ‘twinning-induced plasticity’ and increases the strength and ductility simultaneously [Citation5]. In contrast, heterogeneous structural materials are affected by the ‘soft’ and ‘hard’ regions corresponding to the coarse grains/soft phase and fine grains/hard phase, respectively. During plastic deformation, the hetero-zones deform inhomogeneously and form back stresses in the soft zones and forward stresses in the hard zones, which together result in hetero-deformation induced (HDI) strengthening while retaining a good ductility [Citation3]. However, the TWIP effect exists in limited types of metals. Furthermore, it is difficult to control the volume fraction and the periodic distribution of twinning and heterogeneous structure induced by conventional thermo-mechanical processes (such as rolling). This could result in significant anisotropy and high uncertainty in the mechanical properties [Citation6].
Functionally graded material (FGM) is a typical heterogeneous material, which is characterised by spatial variations in compositions/constituents and/or microstructures along single or multiple directions, providing an efficient way for improving the stress-ductility combination as they can inherit different merits (i.e. strength, ductility, and toughness) from their constitutive materials [Citation7]. Additive manufacturing (AM) as a disruptive technology provides more design freedom and flexible manufacturability, paving the ways for innovative FGMs design with controllable architectures and tailored performance [Citation8]. Existing mainstream of AM FGMs can be roughly classified into three categories [Citation9,Citation10]: (i) AM of material A on materials B directly, (ii) AM of material A on materials B with a material C as an intermediate layer, (iii) AM of material A and material B with gradient variation of the two materials by their weight percentage. Those FGMs cannot fully leverage on the advantages of constitutive materials to achieve strength-ductility combination due to limited interfacial interactions. Furthermore, the AM of heterogeneous materials with customised architectures to combine superior properties from each constitutive material for enhancing overall properties are overlooked.
Different from the existing AM-processed FGMs, this work explores a new approach to improve the strength-ductility combination of high-strength steels by additive manufacturing of layerwise-heterostructured FGMs. The microstructural evaluation, mechanical properties, and deformation and failure mechanisms were investigated. The findings highlight the new research domain of AM processing of heterostructured materials with controllable properties and functions.
2. Materials and methods
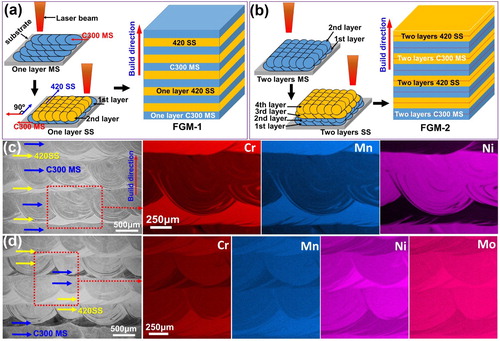
The gas-atomized spherical grade 300 maraging steel (C300 MS) powder (Fe-18.3Ni-9.1Co-4.9Mo-0.75Ti-0.1Si-0.09Cr-0.04Mn-0.01C, wt.%) and AISI 420 stainless steel (420 SS) powder (Fe-13.78Cr-1.04Mn-0.85Si-0.21C, wt.%) were used as feedstock. The particle size distributions MS and SS are 15–53 and 45–106 µm, respectively. The powder-blown laser aided additive manufacturing (LAAM) system used in this study was developed by Singapore Institute of Manufacturing Technology, equipped with a 1 kW IPG Ytterbium continuous wave fibre laser. As illustrated in Figure (a,b), two types of layerwise-heterostructured FGMs were processed by LAAM of MS and SS two powders; one consists of alternating materials between every layer (termed as FGM-1, Figure (a)), while the other one alternating materials for every two deposited layers (termed as FGM-2, Figure (b)). The optimised laser process parameters, i.e. laser power, scan speed and hatch space, for MS are 850 W, 20 mm/s and 0.8 mm, respectively. Likewise, the process parameters for SS are 890 W, 20 mm/s and 0.65 mm, respectively. Both materials were deposited using the raster scan strategy with 90 degrees rotation for alternate layers. The as-built samples were sectioned along the build (Z) direction to study the microstructural evolution using an OLYMPUS MX51 optical microscope (OM). Electron back-scattered diffraction (EBSD) tests were performed using a step size of 150 nm with an Oxford EBSD detector equipped in an FEI 600i scanning electron microscope system. The energy dispersive spectrum (EDS) was captured during EBSD scan simultaneously. Interfacial microhardness was measured by a MATSUZAWA MMT-X3 micro-hardness tester with a load and dwelling time of 100 g and 15s, respectively. The mechanical tensile properties were evaluated using an Instron 5982 universal material testing machine with a loading and unloading speed of 1 mm/min. The unloading started at the strain of 2, 3 and 4%, respectively, until 30 MPa; and then reverting to loading automatically. A 2D digital image correlation (DIC) system was used for in-situ monitoring of the localised strain and failure behaviour. High-resolution (6000 × 4000 pixel) images were taken at 5 frames/second (aperture size f/2.8 and exposure time 1/20 s) using a Canon CCD camera. A Zeiss GOM correlate software was used to analyse those images to obtain the strain distribution maps.
Figure 1. Schematics showing the processes of LAAM of (a) FGM-1 and (b) FGM-2 two types of layerwise-heterostructured FGMs; OM morphologies and EDS maps of the (c) FGM-1 and (d) FGM-2 samples along build direction.
3. Results and discussion
The OM morphologies of the FGMs shown in Figure (c,d) exhibit the layerwise architectures. Energy disperse spectroscopy (EDS) mapping analysis at the selected regions in Figure (c,d) suggests that the brighter layers are the 420 SS while the darker layers are C300 MS, owing to the better corrosion resistance of SS. The penetration depth of the subsequent layer on the previous layer is close to the layer thickness (Figure (c)), which implies near-complete mixing of the MS with the previously deposited SS in the melt-pool. For the FGM-2, the thickness of the SS or MS layers is almost doubled compared with FGM-1. Thus, the subsequently deposited SS layer only partially penetrates the MS layer, thereby forming a dilution layer between SS and MS, which is the greyish region in Figure (d). In addition, circular flows are evident in the MS melt pools, as observed from the OM images, which is rich in SS material (e.g. Cr and Si). The circular features are typical convective flows caused by the Marangoni effect [Citation11].
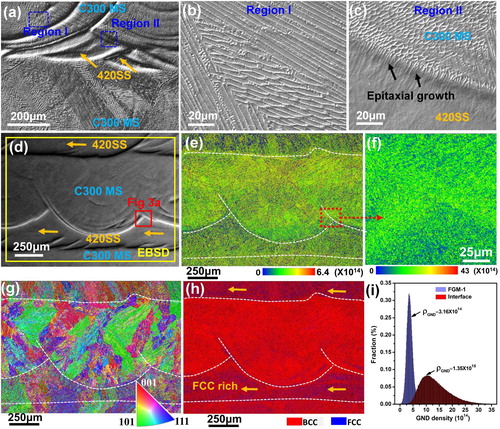
Figure shows the cross-sectional microstructure analysis of the FGM-1. The MS and SS regions can be distinguished in Figure (a). The observed highly curved features are melt-pool solidification fronts formed by strong convective Marangoni flows, driven by melt-pool temperature gradient and temperature-dependent surface tension coefficient [Citation11]. The selected close-up regions in Figure (a) are given in Figure (b,c), depicting the slender columnar structures formed in region I, with inter-spacing of about 0.5 µm. Epitaxial columnar structures (without significant nucleation ahead of the growing cell array) perpendicular to the melt pool boundary is dominant due to preferential competitive grain growth along the primary heat flow direction [Citation12]. The epitaxial growth of columnar structures (region II) crossing the SS/MS interface (Figure (c)) benefits the interlayer bonding of these two materials. Large-area EBSD analysis on the selected region in Figure (d) was performed to investigate the grain orientation, phase distribution and dislocation density; the SS and MS regions are determined by EDS maps from Figure (c). The geometrically necessary dislocations (GNDs) were calculated based on the strain gradient model using the equation [Citation13]. Where
is unit length (equals to twice the EBSD acquisition step size), b is the magnitude of Burgers vector, and
is the kernel average misorientation (KAM), which is retrieved directly from EBSD data with a square kernel method (filter size 3 × 3 and subgrain angle 2°) as previously elucidated in earlier publication [Citation13]. The GNDs distribution map in Figure (e) demonstrates that the SS region has a lower GNDs density than MS, suggesting a low dislocation density in SS regions. In contrast, GNDs are found to accumulate in the vicinity of interfaces (see Figure (f,i)). The average GND density at the interfacial region can reach 1.35 × 10¹⁵/m2, which is much higher than the average value of 3.16 × 10¹⁴/m2 in FGM-1. The higher GND density in the interface could be caused by incompatibility and mismatch in material physical properties such as coefficient of thermal expansion (CTE) and mechanical properties. The IPF in Figure (g) suggests an overall random orientation, but grains with identical orientations across the interface can also be found. Phase distribution map (Figure (h)) indicates that both the MS and SS have major BCC phase, but the SS has a higher fraction of FCC than MS. The higher fraction of FCC phase in the SS layers could increase the deformability of the heterostructure materials, due to the FCC to BCC transformation-induced plasticity (TRIP) effect under deformation [Citation14].
Figure 2. OM and EBSD microstructural investigations of the FGM-1 sample along build direction. (a) Low-magnification image showing the cross-sectional microstructures, (b) and (c) zoom-in images corresponding to selected regions from (a) showing microstructures of MS and layer boundary, (d) EBSD scan region, (e) and (f) GND map, (g) IPF, (h) phase distribution map, and (i) GND density distributions.
Further high-magnification EBSD analysis on the interface is present in Figure (c), is provided in Figure . The inter-locking morphology at the interface in Figure (a) is caused by convection flows. Figure (b) reveals different microstructure morphologies in the MS and SS regions, in which the MS mainly consists of slender columnar dendrites, while acicular and cellular structures are found in the SS regions. Additionally, the IPF in Figure (c) suggests that the MS and SS grains are mainly along the <0117> and <001> orientations, respectively. The distinct grain orientations across the interface could also lead to high interfacial energy. The phase composition in MS and SS regions is also different, with more FCC phase in the SS than MS region. Figure (e) depicts elements segregation caused by inhomogeneous melt-pool intermixing. Notably, the Cr and Si from SS are segregated in MS, while the Ni and Mo from MS are locally riched within the SS regions. Interestingly, both Si and Mo are segregated at the boundaries of columnar structures.
Figure 3. High-magnification EBSD analysis of the interface and microstructure evaluation mechanism. (a) EBSD scan region of the layer interface corresponding to the marked region in Figure (c), (b) band contrast image, (c) IPF, (d) phase distribution map, (e) EDS maps, (f) schematics showing microstructural evaluation mechanism and multi-scale heterostructures (F stands for the synthetic force between surface tension and gravity). The schematics of Marangoni convection are adapted from [Citation15].
![Figure 3. High-magnification EBSD analysis of the interface and microstructure evaluation mechanism. (a) EBSD scan region of the layer interface corresponding to the marked region in Figure 2(c), (b) band contrast image, (c) IPF, (d) phase distribution map, (e) EDS maps, (f) schematics showing microstructural evaluation mechanism and multi-scale heterostructures (F stands for the synthetic force between surface tension and gravity). The schematics of Marangoni convection are adapted from [Citation15].](/cms/asset/e3cad815-4f54-49bc-ac01-26ffb3f9b442/tmrl_a_1904299_f0003_oc.jpg)
Overall, multi-scale heterostructures are formed in these multi-materials: (i) macro-scale (layer scale) refers to the layerwise heterostructures formed by the alternating deposition of two materials with centimetre-scale periodic structures (see Figure (c,d)). (ii) Meso-scale (melt-pool scale): inter-mixing of two materials caused by circular flows in almost all the melt pools, contributing to millimetre-scale heterostructures. (iii) Micro-scale (grain scale): the Mo (from MS) and Si (from SS) elements (Figure (e)) and FCC phase (Figure (c)) segregations along the interface of micron-size columnar structures lead to micro-scale heterostructures. The microstructural evolutions in meso- and micro-scales are illustrated in Figure (f). The Marangoni convection depends on surface tension gradient and temperature gradient, as the temperature at the centre of melt pool is higher than that of the boundary, which leads to the surface tension gradient in the melt pool from centre to boundary [Citation11,Citation15]. So the liquid metal is pushed toward the melt pool boundary, while the gravity leads the liquids to flow downwards towards the bottom of the melt pool, therefore, forming circular flows in melt pools and inter-locking structures at the layer interface. The columnar boundary segregation could be mainly attributed to the solute partition of materials, as the elemental diffusion during LAAM process is limited owing to the transient laser heating time (in ms level) and rapid cooling rate (up to 105 K/s).
The microhardness indentations across the different materials are shown in Figure (a), along with the hardness profile in Figure (b), which shows a higher hardness value in the SS layer than the MS layer. A gradient hardness transition between the hard and soft domains is observed in Figure (a,b), which is possibly caused by the dilution and intermixing between the two materials, alleviating abrupt hardness variation across the interface. The tensile properties of the FGMs in comparison with the LAAM-processed single MS are provided in Figure (c). The ultimate tensile strength (UTS) of FGM-1 and FGM-2 are all higher than 1.3 GPa, which has increased by more than 200 MPa, compared with MS (about 1.1 GPa). Besides, the elongation (El) of the FGMs reaches 7.5%, which is higher than that of the heat-treated (HTed) MS (average El 5.6%). The achieved mechanical properties of FGMs in comparison to the typical properties of laser additively manufactured MS from literature are plotted in Supplementary Figure S1, which highlights a balanced strength-ductility achieved in FGMs. The increased UTS could be caused by stress redistribution away from the soft (plastically-deforming) to the hard (non-deforming) zones. Specifically, when the heterostructured material deforms, the softer domains will undergo plastic deformation first while the harder domains remain elastic. However, the deformation compatibility requirements will lead to deformation-induced long-range internal stresses with forward stresses in the hard zones and back stresses in the soft zones, which together produce hetero-deformation induced (HDI) strengthening to materials, making the softer domain appear stronger and endure higher stress [Citation16].
Figure 4. The mechanical performance and deformation behaviour of the layerwise-heterostructured FGMs. (a) OM image showing the micro-hardness indentations crossing several layers, (b) hardness distribution map of the selected region in (a), (c) engineering tensile stress–strain curve of the C300 MS and FGMs, (d) true stress–strain curves of C300 MS and FGM samples during loading–unloading tests, and (e) strain distribution maps in different stage monitored by DIC.
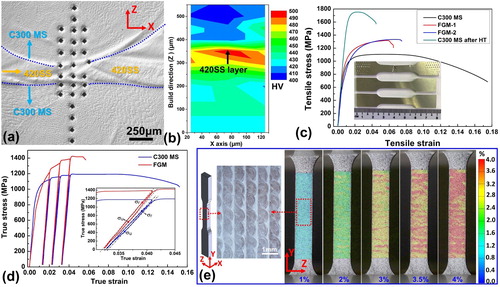
To quantify the HDI stress, cyclic loading–unloading tensile tests were performed, and the obtained typical true stress–strain curves of samples were shown in Figure (e). The HDI stress () can be calculated from the hysteresis by the equation [Citation17]:
where
and
are the yield stress during reloading and unloading, respectively; both of them can be measured from each hysteresis loop, as exemplified in Figure (e). The unloading-reloading hysteresis loops indicate the existence of inhomogeneous deformation in the material. For the homogeneous C300 MS, the plastic deformation could be still inhomogeneous at microscale due to the presence of massive grain boundaries and textures [Citation17]. The
of C300MS and FGM-2, are measured as 621 and 747 MPa, respectively. The higher HDI stress in FGM than C300 MS (about 126 MPa) explains the improved strength of FGM. Besides, the FGM-1 shows a higher yield strength than FGM-2 since each MS/SS layer interface produces an interface-affected zone with considerable GND pileups. Thus, the higher number of MS/SS interfaces in FGM-1, implies a higher overall density of GND pileups, increasing HDI stress [Citation18].
The deformation processes monitored during tensile testing was provided in Figure (f). The measured sample surface shows uniform deformation when the strain is 1% or lower. However, with the average strain increasing to 2%, non-uniform strain localisation was observed at some points on the sample. These points will further expand across layers and form many deformation bands (the red stripes) perpendicular to the tensile loading direction at the strain of 3% and 3.5%. This is evidently distinct from conventional homogeneous materials, whereby higher strain localisation only occurs near the necking region prior to sample fracture. In this elastic-plastic deformation stage, GNDs will be blocked and pile up against layer boundaries, which produces long-range internal stress (i.e. back stress) in the SS regions [Citation16]. The high-strain bands gradually merge together with further increasing strain, followed by fracture therein when reaching a strain limit. The multiple deformation bands could delay the necking and improve the ductility [Citation19].
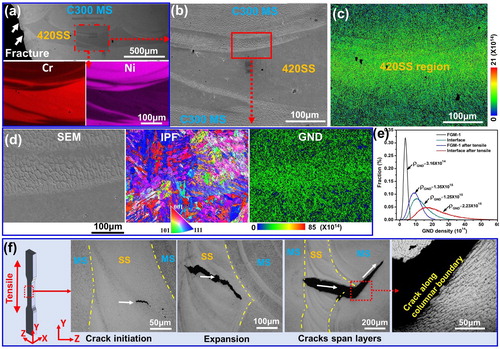
Microstructure analysis of the fractured sample was conducted to further consolidate understanding of the deformation processes. As shown in Figure (a), a region close to the fracture was selected, and the MS and SS regions in Figure (b) were distinguished by EDS mapping. The GND map in Figure (c) shows a higher GND density in the SS region and MS/SS interface, which is distinctive from the non-deformed sample as revealed by Figure (e), in which the MS region exhibited a higher GND density. Hence, the results suggest the SS region underwent more severe deformation than MS during tensile tests. Further close-up EBSD analysis on the interface was carried out (see Figure (d)) to compare the GNDs density in the interface and multi-layer region (i.e. Figure (c)), and their results are summarised in Figure (e). The fractured sample demonstrates a higher GND in the layer interface and within the entire sample compared with the as-built condition. The GND pileups in FGMs, especially in the SS region, could increase back stress and contribute HID strengthening to the sample [Citation18]. Based on microstructural observations of the fractured sample, the likely fracture behaviours were illustrated in Figure (f). First, the cracks were likely initiated in the SS regions, especially at regions close to the highly curved structures (inter-mixing of MS and SS), since the yield strength of AM-processed SS (about 700–850 MPa [Citation20,Citation21]) is lower than that of MS (typically 900–1150 MPa [Citation22]). During this stage, the SS regions will undergo severe deformation as demonstrated by localised GNDs in SS regions in Figure (c), while the MS domain will remain elastic until the back stress in the SS domain reached limitation. Hence the global yield stress can be increased when both domains are deforming plastically. Second, the cracks propagated across the SS layer and headed towards the MS layer. In this stage, the deformation of MS zones may gradually transit from elastic to plastic with further increase in strain, which produces elastoplastic transition and induces strain hardening [Citation23]. Third, the cracks crossed the layer interface, and further propagate along the columnar structure boundaries in MS layer. The crack tip propagation direction changed after crossing the layer boundary from SS to MS; the change of crack tip propagation direction could delay the breaking process and increase break elongation.
Figure 5. Microstructural and fracture mechanism analysis on the fractured FGM-1 sample after the tensile test. (a) SEM and EDS maps showing the EBSD measurement region. (b) SEM image showing the SS and MS regions, (c) GND map, (d) a close-up EBSD analysis on interface as circled in (b), (e) GND density distributions of the FGM-1 before and after tensile tests, and (f) schematics showing the fracture processes.
These layerwise-heterostructured FGMs could lead to anisotropic mechanical behaviours along different loading directions. This is one potential limitation of our work and perhaps, also for most other lamellar-structured materials. The above-mentioned good strength-ductility combination was measured with tensile loading parallel to the interface of two materials. Hence, further evaluation of anisotropic mechanical properties and how to minimise the anisotropy effect through tailoring of deposition patterns for multi-materials, will be conducted in our future work.
4. Conclusion
In summary, a promising approach was demonstrated for processing heterostructured materials with controllable architectures by LAAM. The alternating deposition of two materials in different layers leads to the formation of macro-scale layerwise architecture, while the melt pool dilution/ intermixing caused by Marangoni flows led to meso-scale heterostructure. These phenomena together with the observed elemental segregations along the microsized columnar boundaries, constituted the multi-scale heterostructures in LAAM-processed high-strength steels. The heterostructured materials achieved a UTS of 1.32 GPa and an elongation of 7.5%, showing a superior strength-ductility combination compared with the parent MS material. The increase in strength is attributed to hetero-deformation induced strengthening. In-situ deformation monitoring revealed numerous unique deformation bands, which are distinct from homogeneous materials and could contribute to an improved elongation. These findings highlight a new research area and approach to circumvent property trade-offs in materials by processing multi-materials following a pre-designed spatial pattern using AM.
Supplemental Material
Download MS Word (198.8 KB)Acknowledgements
This research was financially supported by the Agency for Science, Technology and Research (A*Star), Singapore, under the IAF-PP program (No: A1893a0031).
Disclosure statement
No potential conflict of interest was reported by the author(s).
Additional information
Funding
References
- Wei Y, Li Y, Zhu L, et al. Evading the strength–ductility trade-off dilemma in steel through gradient hierarchical nanotwins. Nat Commun. 2014;5(1): 1–8.
- Wu X, Zhu Y. Heterogeneous materials: a new class of materials with unprecedented mechanical properties. Mater Res Lett. 2017;5(8):527–532.
- Zhu Y, Ameyama K, Anderson PM, et al. Heterostructured materials: superior properties from hetero-zone interaction. Mater Res Lett. 2020;9(1):1–31.
- Wang YM, Voisin T, McKeown JT, et al. Additively manufactured hierarchical stainless steels with high strength and ductility. Nat Mater. 2018;17(1):63–71.
- Pham MS, Dovgyy B, Hopper PA. Twinning induced plasticity in austenitic stainless steel 316L made by additive manufacturing. Mater Sci Eng A. 2017;704:102–111.
- Li G, Liu M, Lyu S, et al. Simultaneously enhanced strength and strain hardening capacity in FeMnCoCr high-entropy alloy via harmonic structure design. Scr Mater. 2021;191:196–201.
- Zhang C, Chen F, Huang Z, et al. Additive manufacturing of functionally graded materials: a review. Mater Sci Eng A. 2019;764:138209.
- Bandyopadhyay A, Heer B. Additive manufacturing of multi-material structures. Mater Sci Eng R Rep. 2018;129:1–16.
- Yan L, Chen Y, Liou F. Additive manufacturing of functionally graded metallic materials using laser metal deposition. Addit Manuf. 2020;31:100901.
- Tan C, Zhang X, Dong D, et al. In-situ synthesised interlayer enhances bonding strength in additively manufactured multi-material hybrid tooling. Int J Mach Tools Manuf. 2020;155:103592.
- Mills K, Keene B, Brooks R, et al. Marangoni effects in welding. Philos Trans R Soc Lond A Math Phys Eng Sci. 1998;356(1739):911–925.
- Pham MS, Dovgyy B, Hooper PA, et al. The role of side-branching in microstructure development in laser powder-bed fusion. Nat Commun. 2020;11(1):749.
- Calcagnotto M, Ponge D, Demir E, et al. Orientation gradients and geometrically necessary dislocations in ultrafine grained dual-phase steels studied by 2D and 3D EBSD. Mater Sci Eng A. 2010;527(10–11):2738–2746.
- Tamura I. Deformation-induced martensitic transformation and transformation-induced plasticity in steels. Met Sci. 1982;16(5):245–253.
- Tan C, Zhou K, Ma W, et al. Interfacial characteristic and mechanical performance of maraging steel-copper functional bimetal produced by selective laser melting based hybrid manufacture. Mater Des. 2018;155:77–85.
- Zhu Y, Wu X. Perspective on hetero-deformation induced (HDI) hardening and back stress. Mater Res Lett. 2019;7(10):393–398.
- Liu Y, Cao Y, Mao Q, et al. Critical microstructures and defects in heterostructured materials and their effects on mechanical properties. Acta Mater. 2020;189:129–144.
- Fang XT, He GZ, Zheng C, et al. Effect of heterostructure and hetero-deformation induced hardening on the strength and ductility of brass. Acta Mater. 2020;186:644–655.
- Wu H, Fan G, Huang M, et al. Deformation behavior of brittle/ductile multilayered composites under interface constraint effect. Int J Plast. 2017;89:96–109.
- Nath SD, Irrinki H, Gupta G, et al. Microstructure-property relationships of 420 stainless steel fabricated by laser-powder bed fusion. Powder Technol. 2019;343:738–746.
- Nath SD, Clinning E, Gupta G, et al. Effects of Nb and Mo on the microstructure and properties of 420 stainless steel processed by laser-powder bed fusion. Addit Manuf. 2019;28:682–691.
- Tan C, Zhou K, Ma W, et al. Research progress of laser additive manufacturing of maraging steels. Acta Metall Sin. 2019;56(1):36–52.
- Moan G, Embury J. A study of the Bauschinger effect in Al-Cu alloys. Acta Metall. 1979;27(5):903–914.