
 ?Mathematical formulae have been encoded as MathML and are displayed in this HTML version using MathJax in order to improve their display. Uncheck the box to turn MathJax off. This feature requires Javascript. Click on a formula to zoom.
Abstract
Molecular dynamics simulations were used to study deformation-induced face-centered cubic (fcc) to body-centered cubic (bcc) transformation during uniaxial compression of an 80Fe-20Ni (at%) alloy with and without precipitates. Our purpose was to better understand recent experimental results in an Fe-Ni-based medium-entropy alloy where certain precipitates were found to constrain the fcc to bcc transformation. We find that larger precipitates and smaller spacings between precipitates hinder the phase transformation by impeding relaxation of internal elastic strains. These results deconvolute the individual effects of precipitate size and spacing and help interpret the experimental results where only their combined effects could be measured.
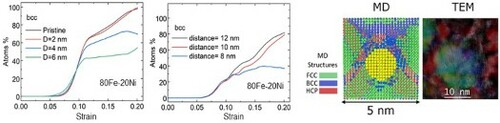
GRAPHICAL ABSTRACT
IMPACT STATEMENT
Using atomistic modelling, we investigate the individual effects of precipitate size and spacing in phase transition and help interpret the experimental results where only their combined effects could be measured.
Medium-entropy alloys (MEAs) and high-entropy alloys (HEAs) have been extensively studied since 2004 [Citation1,Citation2]. Some of them exhibit improved properties such as high tensile ductility [Citation3,Citation4] and toughness [Citation4,Citation5] compared to traditional alloys. The introduction of microstructural features such as twin boundaries [Citation6], grain boundaries [Citation7] and precipitates [Citation8–10] has been shown to improve strength. It has been additionally shown that precipitates can interact with thermally induced phase transformations during heat treatments [Citation11–13]. Recently, Yang et al. [Citation10] have shown that precipitates can also influence deformation-induced phase transformation. They investigated the role of precipitates in fcc to bcc to phase transformation in an Fe-Ni based MEA subjected to two different heat treatments. One produced finer, closely spaced precipitates while the other produced coarser, more widely spaced precipitates. The volume fraction of precipitates was the same in both cases. Their experimental results showed that smaller precipitates separated by smaller distances hinder the deformation-induced phase transition, presumably by imposing a physical constraint, whereas larger precipitates spaced further apart allowed the transformation to occur during plastic deformation thereby enhancing strength and ductility by the so-called TRIP effect (transformation-induced plasticity). However, the individual effects of size and spacing could not be determined in that study.
Experimentally it is nontrivial, if not impossible, to disentangle the roles of precipitate size and spacing on deformation-induced phase transformation given that they are not independent variables if volume fraction is held constant, as was the case in the Yang et al. study [Citation10]. On the other hand, if it is not kept constant, there are other confounding effects that arise from the change in composition required to alter the volume fraction, which can potentially change the thermodynamic driving force for transformation. Therefore, in this work, we investigate the effects of precipitate size and spacing (the distance between the precipitates) separately on deformation-induced phase transformation (without having to keep volume fraction constant), which is possible in molecular dynamics (MD) simulations. We believe this is a reasonable approach to understand the main results of our earlier experiments [Citation10] because there the volume fraction of precipitates played only an indirect role, through its effects on precipitate size and spacing. If the effects of the latter two variables are understood, the role of volume fraction will naturally become clear.
MD simulations are a useful tool for studying the effects of the precipitate characteristics on phase transformation, because of the ability to separately control the precipitate size and distance. For example, recent MD simulations of one precipitate in nickel-titanium alloys [Citation14,Citation15] have provided useful insights in shape-memory alloys regarding thermally induced [Citation14] and athermal phase transformations [Citation15]. Here, we investigate the fcc to bcc phase transition under uniaxial compression in a model fcc Fe-Ni alloy, namely 80Fe-20Ni (all compositions in this paper are in at%) to shed light on the behavior of Fe-Ni based MEAs and HEAs, by varying the size of a single precipitate, or the spacing between two precipitates of the same size. This alloy was chosen for the following reasons. It has a thermodynamic driving force for fcc to bcc transformation at low temperatures [Citation16] and was therefore expected to undergo a deformation-induced transformation during MD compression. It has a reliable embedded atom potential [Citation17]. Finally, although the alloy in our experimental study [Citation10] contained Al and Ti in addition to the principal constituents Ni and Fe, the Al and Ti partitioned into the precipitate phase along with some of the Ni to produce Ni3(Al,Ti) type L12 precipitates, leaving the matrix with a composition of approximately 73.7Fe-22.3Ni-3.6Al-0.4Ti, which makes the 80Ni-20Fe binary a reasonable surrogate to simulate the deformation-induced transformation observed in the experimental alloy. The goal of the present simulations is to improve understanding of the previously observed effects of precipitate size and spacing on deformation-induced microstructure evolution, which is necessary to ultimately improve the mechanical properties of alloys through composition and microstructure optimization and control of the deformation mechanisms during plastic deformation.
The simulations were performed using the LAMMPS code [Citation17]. An embedded atom model (EAM) interatomic potential [Citation18] was used to describe the forces between the atoms in the fcc 80Fe-20Ni alloy. To investigate the effect of the precipitate size on the phase transition, we compared a pristine system (without precipitates) and systems containing one precipitate with diameter of 2, 4 nm or 6 nm. The precipitates’ centers are placed in the middle of the MD box. In all these cases the system size is 17.5 nm × 11 nm × 11 nm. To investigate the effect of the interparticle distance
on the phase transition, we compared a pristine system and systems with two precipitates of 2 nm diameter at three different interparticle distances, namely 8, 10 nm or 12 nm, placed in the middle of the y and z dimensions of the MD box. These systems have size 24.5 nm × 11 nm × 11 nm. All systems in this work have periodic boundary conditions. In all simulations with precipitates, the composition of the precipitates is pure iron, and their structure is fcc. The Atomsk program [Citation19] was used for the construction of the structures. The temperature was 300 K for all simulations. All systems were initially equilibrated under the constant pressure and temperature (NPT) ensemble, using a timestep of 1 fs. For the uniaxial deformation simulations, the systems were compressed along the x-direction of the box, which is the [100] direction of the system. The applied engineering strain rate is 3 × 10¹⁰ s−1 and was applied up to 20% engineering strain. During compression, the precipitates are stationary (frozen) with only the surrounding matrix atoms allowed to move in response to the applied strain, and the volume of the MD box is constant, such that when the x dimension of the MD box decreases the y and z dimensions increase. The NPT ensemble was used for the compression simulations, with 1 fs timestep. Structure identification was performed using the software OVITO [Citation20] and the interval common neighbor analysis (CNA) algorithm. The atomic-level elastic strain was calculated using the elastic strain calculation modifier of the OVITO program. This modifier computes the atomic-level elastic strain and the deformation gradient tensors.
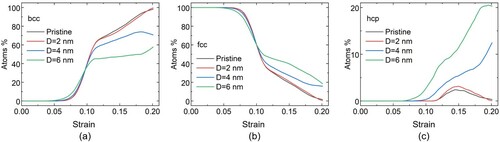
Figure shows the effect of precipitate size on the phase transition from fcc to bcc as a function of strain. The percentage of atoms shown in these plots (as well in Figure ) include the matrix atoms only, not the atoms within the precipitate. Figure (a) shows the percentage of the atoms in the fcc structure as a function of strain for systems with and without a precipitate. Figure (b) shows the increase of the bcc phase as a function of strain for the same systems, while Figure (c) shows the formation and evolution of atoms with hcp (hexagonal close-packed) coordination. For low strains, up to about 4.5%, the response of all systems is similar, and no transition takes place. Subsequently, for strains up to 10%, the transformation from fcc to bcc takes place faster as the precipitate size increases. At 10% strain, a crossover is observed, after which the transformation is faster for smaller precipitate size.
Figure 1. Structure evolution with applied strain in systems with and without precipitates. Percentage of atoms in the matrix with (a) fcc coordination, (b) bcc coordination, and (c) hcp coordination for a system without precipitates (black curve) and systems containing one precipitate each, with diameter of 2 nm (red curve), 4 nm (blue curve) and 6 nm (green curve).
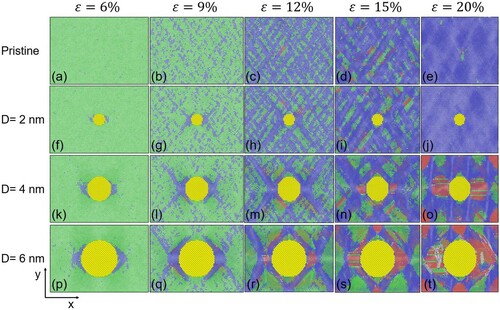
To understand this behavior, we provide snapshots at different strains in Figure . Movies of the whole simulation length for all four systems can be found in the Supplementary Information. The plane of Figure is the x(horizontal)-y(vertical) plane with the z-direction perpendicular to this plane. The snapshots in Figure show cross-sections along the x-y plane through the center of the precipitates located in the middle of the z dimension of the MD box. The snapshots shown correspond to 6%, 9%, 12%, 15% and 20% strain. The green color indicates fcc structure, the blue bcc and the red hcp coordination. In the pristine system (Figure (a-e)), the fcc to bcc transition takes place homogenously throughout the simulated volume. When a precipitate is present, the transformation nucleates heterogeneously at the interface between precipitate and matrix (Figure (a,f,k,p)), which has a more profound effect for larger precipitates due to the larger interface area. Because the energy barrier for homogeneous nucleation is greater than that for heterogeneous nucleation, and the number of potential heterogeneous nucleation sites increases with increasing interfacial area between precipitates and matrix [Citation21], bcc nucleation occurs at lower strains in systems with larger precipitates. At larger strain, the energy barrier of homogeneous nucleation is overcome, and since there are more potential nucleation sites (i.e. overall volume) available in the matrix of the pristine system than in systems with a precipitate, bcc formation occurs faster in the pristine system than in systems with a precipitate. As the deformation further increases, hcp-coordinated atoms, and then areas, are formed. Their amounts increase in a sequential order, first in the pristine system Figure (c), then in systems with a 2 nm (Figure (h)), 4 nm (Figure (m)) and 6 nm (Figure (m)) precipitate. The hcp-coordinated regions seem to nucleate at the interface between fcc/bcc regions or between precipitate/bcc. In the pristine and 2 nm-precipitate systems hcp coordination first increases then decreases with strain, suggesting it is a transient, but in the 4 and 6 nm precipitate systems it continues to increase with strain. This suggests that larger, immobile, precipitate/fcc interface areas promote the formation of large areas with hcp coordination which, unlike the small hcp areas in pristine or 2 nm precipitate system, are difficult to transform into bcc coordination. Thus, our findings show that the system with the smallest precipitate (D = 2 nm) behaves similarly to the pristine one, indicating that a single, tiny precipitate does not have a significant effect on the phase transition compared to the pristine system. Larger precipitates cause larger deformation, resulting in larger areas of hcp coordinated atoms as the precipitate size increases, as seen in Figure (c) and Figure (n,o) and Figure (s,t). In summary, the larger the precipitate, the larger the immobile interface area, the more the number of atoms with hcp coordination, the more difficult the fcc to bcc transition; that is, the phase transition from fcc to bcc is hindered as the precipitate size increases (Figure (s,t)). Overall, when only heterogeneous bcc nucleation is activated, systems with larger precipitates accelerate the fcc to bcc transformation due to the availability of more nucleation sites at precipitate/fcc interfaces, while when both homogeneous and heterogeneous nucleation are activated, this behavior is reversed, and the systems with no or small precipitates undergo faster fcc to bcc transition due to more homogeneous nucleation sites being available. The fcc to bcc transition becomes more difficult with increasing precipitate size because more hcp coordination is formed due to more constraint from immobile precipitate/fcc matrix. From these simulations it can be inferred that, if the precipitate is less mobile than the matrix, as the precipitate size increases, the spatial confinement of the matrix increases due to the larger less-mobile interfaces between the matrix and precipitate and the induced stresses from the deformation cannot be relaxed, and so the transformation to bcc is hindered.
Figure 2. Snapshots of the x-y plane of the systems at different applied strains. The images shown are for a pristine system (a-e), a system with a precipitate of 2 nm diameter (f-j), a system with a precipitate of 4 nm diameter (k-o), and a system with a precipitate of 6 nm diameter (p-t). The green atoms represent fcc structure, the blue bcc and the red hcp. The precipitate has the fcc structure, but it is shown in yellow for clarity.
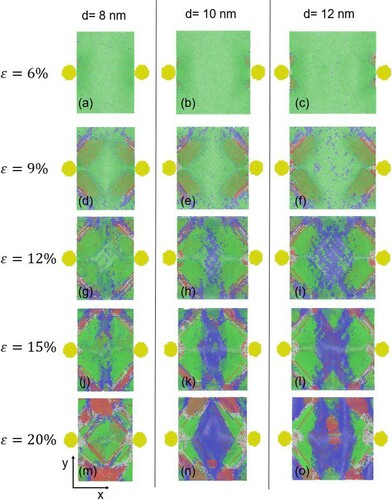
In order to understand how the distance between the precipitates affects the transition, we focused on changes happening in the volume between two precipitates of 2 nm diameter size, in three systems with different precipitate spacings. Before deformation, these volumes have sizes of 8 nm × 11 nm × 11 nm, 10 nm × 11 nm × 11 nm and 12 × nm × 11 nm × 11 nm where the distances between the precipitates (8, 10 and 12 nm) are along the x-direction of the MD box. During deformation, the x dimension of this volume is constant (consistent with the precipitates being stationary), while the y and z dimension change (such that the volume of the whole MD box is constant). The x-y planes of these volumes are shown in Figure S1 of the Supplementary Information. In Figure , the evolution of the structure in the volumes between the precipitates is shown as a function of strain, in terms of the percentage of fcc (Figure (a)) and bcc (Figure (b)) atoms. Figure shows snapshots of the structures in the aforementioned volumes between the precipitates, along the plane through the center of the precipitates (x-y plane) at the middle of the z dimension of the MD box, at different strains. In this figure, the atoms outside the volume we examine (namely, the volume between the precipitates) have been omitted for clarity; the full MD box can be seen in Fig. S1. Again, the green color indicates fcc structure, the blue bcc, and the red hcp atom coordination. The movies showing the response of these volumes with strain can be found in the Supplementary Information. As seen in Figure and Figure (a-c), the matrix starts to transform at about 6% strain, which is consistent with the observation in the pristine systems and the systems containing one precipitate. Thereafter, until about 10% strain, the material between the precipitates responds similarly for all three distances, as seen in Figures and (d-f). In this regime, the transformation takes place mainly in the vicinity of the precipitates, which delays the transition at other locations within the interparticle volume. It can be seen, however, that the fcc to bcc transition starts sooner in the case of the larger interparticle distance (12 nm), where the matrix volume between the precipitates is larger compared to the smaller distances. This effect continues for larger strain and can be also seen in Figure (g-i) and (j-l). At very high strain, for the small distance of 8 nm, as seen in Figure (b) the transition reaches a plateau, due to the volume restriction and the formation of hcp coordination, while larger precipitate distances (10 and 12 nm) allow the continued transition to bcc of the volume between the particles (4(m-o)). Overall, larger distance between the precipitates facilitates the matrix transition from fcc to bcc, while shorter distance hinders it.
Figure 3. Structure evolution with applied strain in systems with different interparticle distance, where the precipitate has 2 nm diameter. Percentage of (a) fcc structure and (b) bcc structure in the volume between the precipitates in systems with 12 nm (black curve), 110 nm (red curve), and 8 nm (blue curve) interparticle distance.
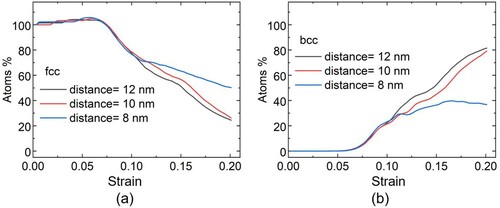
Figure 4. Snapshots of the x-y plane of the systems at different applied strains. The images show the structure between two precipitates of 2 nm diameter in a system with 8 nm interparticle distance (first column), for a system with 10 nm interparticle distance (second column) and for a system with 12 nm interparticle distance (third column). The green atoms represent fcc structure, the blue bcc and the red hcp. The precipitates are shown in yellow. The atoms outside this volume between the precipitates have been omitted for clarity.
In addition to analyzing the structure, we also analyzed local strains in the system as described earlier. Figures S2 and S3 of the Supplementary Materials present the εxx component, given that the uniaxial deformation in our simulations is along the x-axis. These images show snapshots at the same applied strains as in Figures and , respectively, except that they represent local-strain maps rather than local-structure maps. A comparison of these figures shows that regions with greater compressive strain (shown in blue) remain as untransformed fcc while regions where some of the compressive strain has relaxed (shown in lime green) have transformed to bcc. This is consistent with the notion that spatial confinement hinders the phase transition. Larger matrix volume (space) around the precipitates, in the case of both one or two precipitates, facilitates the strain release and therefore the transition from fcc to bcc.
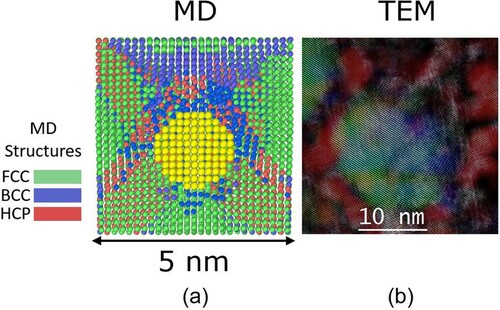
It is instructive to compare the present MD simulation results with some experimental results obtained in an Fe-Ni MEA [Citation10]. Figure (a) shows a precipitate (in yellow) of 2 nm diameter and the matrix structure around it (fcc in green, bcc in blue and hcp in red color) after 6% applied strain in the MD simulation. The precipitate-matrix interface facilitates heterogeneous nucleation of bcc in the originally fcc matrix surrounding the precipitate. Additionally, the relatively large blue area towards the top indicates where the nucleated bcc has grown into a region that is associated with relaxed compressive strain, as discussed above. For comparison, a scanning transmission electron microscope (STEM) image is shown in Figure (b) where an L12 precipitate facilitates heterogeneous nucleation of bcc at its interface with the fcc Fe-Ni-based matrix. Upon deformation to 6.8% strain (see Supplementary Information for details of the experiment and Fig. S4 for details of how the composite image was created), the bcc regions grow and consume increasing amounts of the originally fcc matrix. The experiments also showed that when the precipitates are smaller and more closely spaced than in the above example, nucleation of the bcc phase is entirely suppressed, both during the thermal quench and during subsequent deformation. Our MD simulation results are thus broadly similar to the experimental results. But they provide a couple of additional insights that are helpful in developing a better understanding of the experiments. We find that both increased precipitate size and decreased precipitate spacing contribute to spatial confinement and thus impede the deformation-induced fcc to bcc transformation (in our previous experimental study, we could not separate effects of size from those of spacing). Additionally, we find that regions where the fcc to bcc transformation occurs are associated with lower compressive strain, that is, the transformation is associated with strain relaxation.
Figure 5. Comparison of MD (a), and STEM (b). The image in panel (a) shows a precipitate (in yellow) of 2 nm diameter after 6% applied strain and the matrix structure around it (fcc in green, bcc in blue and hcp in red). The STEM image in (b) shows an overlay of a high-angle anuular dark field image and RGB composites of inverse Fourier transforms of diffractograms obtained from L12 precipitates (green) and the matrix structures around it, where the fcc areas are in blue and bcc in red showing the result of the phase transformation induced by 6.8% strain.
Our simulation results help us better understand recent experimental results showing L12-structured precipitates in an fcc matrix of a Fe-Ni based complex alloy affect the propensity of the matrix to undergo deformation-induced fcc to bcc transformation: fine, closely spaced precipitates prevent the transformation whereas coarse, widely spaced precipitates allow it [Citation10]. Here, atomistic modeling allows us to investigate separately the effects of precipitate size and spacing to gain insights into fundamental mechanisms of the phase transition from fcc to bcc in an 80Fe-20Ni alloy, which in turn sheds light on phase stability and deformation-induced phase transformation in medium-entropy alloys such as in the aforementioned study. Our findings indicate that larger precipitate size accelerates the initiation of the fcc to bcc transformation at low strain, while at high strain, this behavior is reversed, and the transition is hindered because of the larger precipitate size. Additionally, we found that smaller distance between the precipitates hinders the phase transition, with this hindrance decreasing as the distance between precipitates increases until, at large enough separation, the phase transformation behavior is similar to that of a pristine system without any precipitates. Finally, we observe that strain relaxation facilitates the transition to bcc. These results indicate that the precipitate size and spacing can be systematically varied to tune the propensity for deformation-induced phase transformation. These results provide fundamental understanding of the mechanisms that inhibit or facilitate phase transition and phase stability in Fe-Ni alloys, and further investigation of the interplay between matrix and precipitates is needed in order to fully understand these mechanisms and ultimately control them through the design of new microstructures and precipitates by tuning the composition and the heat treatment of the systems. Complex alloys can exhibit certain unique and desirable behaviors. Identifying and understanding new mechanisms that affect their microstructure and mechanical properties and how they correlate with their unique chemical compositions is crucial for the development of novel materials with improved functionality.
Supplemental Material
Download MS Word (1.2 MB)Disclosure statement
No potential conflict of interest was reported by the author(s).
Additional information
Funding
References
- Cantor B, Chang ITH, Knight P, et al. Microstructural development in equiatomic multicomponent alloys. Mat Sci Eng a-Struct. 2004 Jul 15;375:213–218.
- Yeh JW, Chen SK, Lin SJ, et al. Nanostructured high-entropy alloys with multiple principal elements: novel alloy design concepts and outcomes. Adv Eng Mater. 2004 May;6(5):299–303.
- Gali A, George EP. Tensile properties of high- and medium-entropy alloys. Intermetallics. 2013 Aug;39:74–78.
- Gludovatz B, Hohenwarter A, Thurston KVS, et al. Exceptional damage-tolerance of a medium-entropy alloy CrCoNi at cryogenic temperatures. Nat Commun. 2016 Feb;7:10602.
- Gludovatz B, Hohenwarter A, Catoor D, et al. A fracture-resistant high-entropy alloy for cryogenic applications. Science. 2014 Sep 5;345(6201):1153–1158.
- Lu L, Chen X, Huang X, et al. Revealing the maximum strength in nanotwinned copper. Science. 2009 Jan 30;323(5914):607–610.
- Kumar KS, Van Swygenhoven H, Suresh S. Mechanical behavior of nanocrystalline metals and alloys. Acta Mater. 2003 Nov 25;51(19):5743–5774.
- Gladman T. Precipitation hardening in metals. Mater Sci Tech Ser. 1999 Jan;15(1):30–36.
- Jiang SH, Wang H, Wu Y, et al. Ultrastrong steel via minimal lattice misfit and high-density nanoprecipitation. Nature. 2017 Apr 27;544(7651):460.
- Yang Y, Chen TY, Tan LZ, et al. Bifunctional nanoprecipitates strengthen and ductilize a medium-entropy alloy. Nature. 2021 Jul 8;595(7866):245.
- Luo HB, Shan FL, Hue YL, et al. Effect of precipitates on phase transformation behavior of Ti-49 at.% Ni film. Thin Solid Films. 1999 Feb 8;339(1-2):305–308.
- La Roca P, Baruj A, Sobrero CE, et al. Nanoprecipitation effects on phase stability of Fe-Mn-Al-Ni alloys. J Alloy Compd. 2017 Jun 25;708:422–427.
- Ioannidou C, Arechabaleta Z, Navarro-López A, et al. Interaction of precipitation with austenite-to-ferrite phase transformation in vanadium micro-alloyed steels. Acta Mater. 2019;181:10–24.
- Ataollahi S, Mahtabi MJ. Effects of precipitate on the phase transformation of single-crystal NiTi alloy under thermal and mechanical loads: A molecular dynamics study. Mater Today Commun. 2021 Dec;29:102859.
- Chen JY, Huo DH, Yeddu HK. Molecular dynamics study of phase transformations in NiTi shape memory alloy embedded with precipitates. Mater Res Express. 2021 Oct;8(10):106508.
- Cacciamani G, De Keyzer J, Ferro R, et al. Critical evaluation of the Fe-Ni, Fe-Ti and Fe-Ni-Ti alloy systems. Intermetallics. 2006;14(10-11):1312–1325.
- Plimpton S. Fast parallel algorithms for short-range molecular-dynamics. J Comput Phys. 1995 Mar 1;117(1):1–19.
- Zhou XWW, Foster ME, Sills RB. An Fe-Ni-Cr embedded atom method potential for austenitic and ferritic systems. J Comput Chem. 2018 Nov 5;39(29):2420–2431.
- Hirel P. Atomsk: A tool for manipulating and converting atomic data files. Comput Phys Commun. 2015 Dec;197:212–219.
- Stukowski A. Visualization and analysis of atomistic simulation data with OVITO-the open visualization tool. Model Simul Mater Sc. 2010 Jan;18(1):015012.
- D. E. Porter, K.E. Easterling, M. Y. Sherif. Phase transformations in metals and alloys. 4th ed. Boca Raton: CRC Press, Taylor & Francis Group; 2022.