
 ?Mathematical formulae have been encoded as MathML and are displayed in this HTML version using MathJax in order to improve their display. Uncheck the box to turn MathJax off. This feature requires Javascript. Click on a formula to zoom.
Abstract
We propose an active learning guided density functional theory calculation framework for rapid screening of multi-principal element alloys (MPEAs) with superior mechanical properties. Using this framework, we fast construct the datasets of the bulk modulus (B), shear modulus (G), yield strength, and Pugh’s ratio of 12,698 noble metal MPEAs. These datasets were obtained with density functional theory prediction accuracy (R2 = 0.98 and 0.96 for B and G, respectively) based on active learning guided 120 DFT calculated data. Analysis of the dataset shows that Ni and Au would enhance the yield strength and the toughness of these noble MPEAs, respectively.
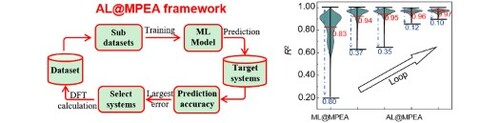
GRAPHICAL ABSTRACT
IMPACT STATEMENT
An active learning guided density functional theory calculation framework, which reduces computation time by three orders of magnitude, was proposed for rapidly screening multi-principal element alloys with superior mechanical properties.
Multi-principal element alloys (MPEAs) represent a new area of materials research, and often exhibit superior mechanical properties beyond traditional alloys [Citation1–3]. Many MPEAs with different compositions have been studied, aiming to obtain ultrahigh strength combined with high ductility [Citation4–7]. Since the number of potential compositions of MPEAs are dramatic larger than those of conventional alloys, the regions that have been investigated hitherto are merely the tip of the iceberg. The huge regions of composition space set a significant challenge in compositional optimization, especially if explored by ‘trial and error’ experiments. Hence, it would be urgently needed to develop an accurate and efficient method that can rapidly forecast target properties of MPEAs within the huge composition space.
Data-driven approaches such as machine learning (ML) provide an effective way to tackle the above challenge [Citation8–10]. These approaches begin with a heterogeneous and sparse data set and train general models to predict the properties of new compounds on unknown broad spaces. Several promising ML models have been developed to search for high-performance MPEAs [Citation11–18]. These models include novel machine learning algorithm [Citation13], improved descriptors [Citation14–16], intrinsic quantitative relationships [Citation17], and the construction of high-throughput calculations database [Citation18]. These studies showed that the quantity and quality of training data is normally the most important factor, and the most labor-intensive part, for ensuring a good performance of a ML algorithm. Typically, based on the density functional theory (DFT) calculated B and G of 1940 inorganic compounds in the material project database [Citation19], one has developed an ML model [Citation12] that can well predict the B and G of over 30,000 compound inorganic compounds (with root mean squared error of 7.5% and 13.8% for B and G, respectively). However, when applying this model to MPEAs the predicted B of Al0.3CoCrFeNi (208 GPa) has a large relative error of 21% with respect to experiments (172 GPa) [Citation13]. The large prediction error was attributed to the fact that the dataset does not contain any information of MPEAs [Citation10].
DFT calculations have been proven to be effective in accurately predicting the B and G values of MPEAs. For instance, DFT calculations were used to predict a bulk modulus of 133 GPa for MnFeCoNi, which matches well with the experimental value of 126 GPa [Citation20]. Similarly, the B and G values of Al0.3CoCrFeNi quinary alloys were also accurately predicted using DFT, as evidenced by the good agreement between the calculated results (161 and 73 GPa, respectively) and the experimental values reported by George et al. (177 and 85 GPa, respectively) [Citation13]. As a result, it is reasonable to expect that developing a ML model based on the MPEAs dataset would lead to even more precise predictions of B and G for MPEAs.
In this contribution, starting with a small number of DFT calculated MPEA datasets, we propose an active learning (AL) guided DFT calculation framework for rapidly forecasting the datasets of the bulk modulus (B), shear modulus (G), yield strength, and Pugh’s ratio of MPEAs. This framework, termed as AL@MPEA, uses the active learning loop to select poorly predicted candidates for DFT calculations, and then feedbacks into the training data to improve the model’s predictive ability. After four-loop iteration of the AL@MPEA framework, we established the elastic properties database of 12,698 noble metal MPEAs, which achieves excellent accuracy (R2 = 0.98 and 0.96 for B and G, respectively) based on merely 120 DFT calculated data. Moreover, analysis of the datasets shows that Ni and Au that would enhance the yield strength and the toughness of these noble MPEAs, respectively. The proposed framework provides quantitative connection between alloy composition and mechanical properties of MPEAs, which may apply to other series MPEAs and help to design MPEAs with excellent mechanical properties.
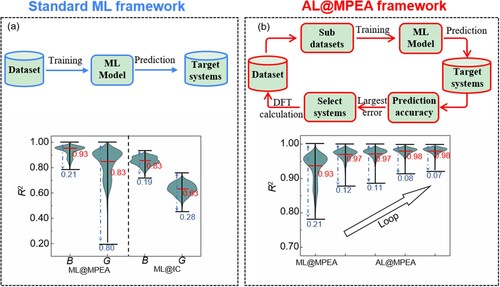
The workflow of standard ML-based material property prediction is shown in Figure (a), which begins with preparing initial dataset and training general ML models to predict the properties of new compounds on target systems. Here, the target systems include 12,698 equal or near equal atomic ratios MPEAs formed by Au, Ag, Cu, Ni, Pd, Pt, Rh, and Ir elements, which involve 168 ternary systems (25 at.% < x < 35 at.%, x represents concentration of each element), 1330 quaternary alloys (20 at.% < x < 30 at.%), 8680 quinary alloys (15 at.% < x < 25 at.%), and 2520 senary alloys (10 at.% < x < 20 at.%). In the target systems, we randomly selected 80 systems as the initial datasets to perform DFT calculations, along with the occurrence probability of each element ranging from 10% to 15% (see supplementary information Table S1 for details). The special quasi-random structures (SQSs) [Citation21] generated by the alloy theoretic automated toolkit (ATAT), were used to model the random solid solution character of multi compositional systems. The Vienna Ab-initio Simulation Package (VASP) code were utilized to perform DFT calculations [Citation22]. The calculation details are shown in supplementary materials.
Figure 1. (a) The standard framework of ML-based material property prediction, which begins with the preparing materials dataset and training general ML models to predict the properties of new compounds on unknown broad spaces. The violin plot of distribution of determination coefficient for bulk modulus (B) and shear modulus (G) under one thousand trials by 80 MPEA datasets (ML@MPEA) and MP datasets constructed by 4898 ordered inorganic compounds datasets (ML@IC). The distribution of prediction accuracies is represented between the two black horizontal lines. The averaged prediction accuracy is denoted with red line. (b) The active learning guided density functional theory workflow (AL@MPEA). The AL@MPEA framework start with small number of DFT calculated MPEA datasets, using active learning loop to select poorly predicted candidates for DFT calculations, and feedback into the training data to improve the model's predictive ability. The violin plot of distribution of determination coefficient for bulk modulus under one thousand trials from ML@MPEA to AL@MPEA with four-loop iteration.
To guide the ML model for the elastic property prediction, nine physical/thermodynamic parameters were combined using weighted mean to generate descriptors denoted as compositional features. Their formulas and property descriptions are shown in Table . Among them, there are four commonly used thermo-physical parameters, i.e. valance electron concentration Nv, electronegativity difference Δχ, mixing configurational entropy ΔSmix, and mixing enthalpy ΔHmix. We also introduced five crystal characteristics descriptors, i.e. the averaged atomic radius R, lattice constants of FCC structure a, bulk modulus B, shear modulus G, Young’s modulus E of the involved constituents.
Table 1. Descriptors used to predict the bulk and shear modulus for gradient boosting decision tree models. The symbols represent valence electron concentrations (Nv), electronegativity difference (Δχ), mixing configurational entropy (ΔSmix), mixing enthalpy (ΔHmix), atomic radius (R), lattice constants of FCC structure (a), bulk modulus (B), shear modulus (G), Young’s modulus (E). bi is the concentration of i-th element, is the average electronegativity difference of alloys.
For the standard ML computations, we applied the gradient-boosted trees regression algorithm [Citation23], as implemented in the open-source code scikit-learn, to build the ML model [Citation24]. The constructed dataset was split randomly into 80% training and 20% testing subsets for the effective optimization of our model. Five-fold cross validation was used to assess how well our model can be generalized to an independent test set. Considering that the accuracy of the prediction is sensitive to the training and testing set splits, the training procedure is executed 1000 times to eliminate the impact of randomness. The determination coefficient (R2) of the testing set was selected to assess the accuracy of the prediction. Figure (a) shows the R2 distribution probability of B and G predicted by 80 MPEA datasets trained ML models (termed as ML@MPEA). The mean value of R2 is 0.93 and 0.83 for B and G, respectively. Notably, the R2 results predicted by 4898 ordered inorganic compounds (IC) datasets trained ML models (termed as ML@IC) are significantly smaller than those of ML@MPEA (see Figure (a); 0.85 for B and 0.63 for G). Here, we constructed a dataset for training the ML@IC model by selecting inorganic compounds from the Material Project that contain the eight elements (Au, Ag, Cu, Ni, Pd, Pt, Rh, and Ir), which are involved in our MPEAs. As a result, a total of 4898 ordered inorganic compounds were included in our dataset. We trained the ML@IC model using this dataset and the same methodology as described in the reference paper. The large R2 of ML@MPEA is presumably because the MPEA dataset only contains FCC structure systems, which would increase the effectiveness of the training process [Citation10]. However, as shown in Figure (a), the difference between the maximum and minimum distribution probability (ΔR2) for B and G is 0.21 and 0.80 for the ML@MPEA, larger than that of ML@IC (0.19 for B and 0.28 for G). The large fluctuation of ML@MPEA may originate from the small number of the datasets, which cannot well capture the relationship between the property and features determined by the underlying physics [Citation10].
Generally, by adding more DFT calculation results to the training set of ML models, one may increase the mean values and reduce the fluctuation of R2 predicted by the models. However, objectless addition of large number of DFT calculated results is apparently unreasonable, difficult, and time consuming. Fortunately, the active learning strategy could solve this problem by intentionally screening out poorly predicted results as the target systems to test, then feed back into the training data to improve the ability to learn from previous data [Citation10,Citation25]. Figure (b) shows the framework of the AL@MPEA, which combines the active learning approach with the DFT calculations. Again, we start with the same 80 number of DFT calculated MPEA datasets. Then, we construct 1000 sub-datasets by randomly select 80% systems in the initial dataset, and training ML model to predict the B and G values of alloys in the entire search space. Finally, the standard variance (σ2) of the 1000 prediction values were used to select 10 most poorly predicted candidates for DFT calculations, and then feedback into the training data to improve the model's predictive ability. Here, the standard variance is defined as: , where X is the predicted values of every system,
is the average value, and N is the total predicted number.
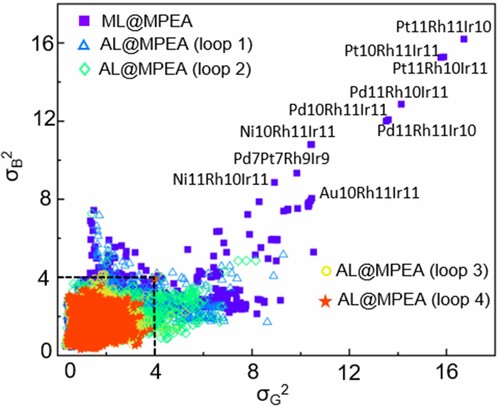
Figure shows the σ2 values of B and G calculated from four-loop iteration in the AL@MPEA framework. Based on the initial 80 MPEA data, large variance values are observed on alloys containing Rh and Ir, with the largest σ2 of 16.2 and 16.7 for B and G, respectively. The large variance suggests that the properties of these alloys cannot be well described by ML model based on the initial dataset. Thus, we attempted to add these alloys into the training dataset, with the aim to improve the prediction accuracy. To determine the optimal number of systems (n), we tested different values ranging from 0 to 14 and evaluated the prediction error on the first iteration. Given that the majority of the variance of B and G, as calculated from the initial dataset, is concentrated in the region where
< 4 (as shown in Fig. S2), we propose to use the number of systems with
greater than 4 as the parameter to assess the performance of system count. As shown in Fig. S1(b), we observed that with an increase in the number of systems added from 0 to 14, the number of systems with
large than 4 decreased from 244 to 158, and the convergent result appears at n = 10. Therefore, we selected 10 systems as the optimal number to balance the computational efficiency and accuracy of our model. We would like to emphasize that the optimal number of each step may vary and should be tested carefully. Here, considering that the number of first step is small, we only select 10 systems for each iteration in our AL algorithm. Very encouragingly, after adding only 10 systems in this iteration, the largest σ2 decreases significantly from 16.2 to 7.2 for B and from 16.7 to 9 for G. Similarly, to construct the second, third, and fourth-loop iteration, each time 10 systems with the largest σ2 are selected as labeled alloys for DFT calculations. After four-loop iteration, the σ2 values of B and G become smaller than 4 for all alloys, indicating the good stability of the ML model on the target training systems.
Figure 2. The variation of standard variance σ2 of B and G calculated from four-loop iteration. Active learning loop was performed by select 10 systems with the largest σ2 as candidates for DFT calculations, and feedback into the training data to improve the model’s predictive ability. After four-loop iteration, the σ2 values of B and G become smaller than 4 for all alloys, indicating the good stability of the ML model on the target training systems.
The R2 distribution probability of B and G predicted by AL@MPEA are plotted in Figure (b) and Fig. S1. These models show large mean values and small fluctuations simultaneously. The mean values of R2 of B and G increase to 0.98 and 0.97 for B and G, while the difference between the maximum and minimum ΔR2 for B and G decrease to 0.07 and 0.10. The σ2 and R2 can further improved by increasing the loop iteration. Specifically, we computed the largest σ2 values for B and G at each iteration and compared them to the previous iteration. As shown in Fig. S3, the initial values for B and G were 16.2 and 16.7, respectively, based on the initial 80 MPEA data. With an increase in the number of iterations, the
value decreased to 3.9 and 4.0 for B and G, respectively, after four iterations. We observed that the difference between the
values for third and fourth iterations was less than 1, indicating that the ML model had attained satisfactory stability on the target training data. Consequently, we conclude that the four-loop iteration works well to train ML models for MPEAs with high predictive precision and small fluctuation.
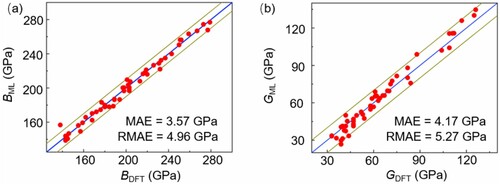
Having constructed the robust AL@MPEA models, we now continue to assess its performance in predicting the B and G values of unknown alloys. To test the prediction ability of a machine learning model, the unlabeled (unknown) data should be randomly distributed in the instance space. Following this basic requirement, based on the AL@MPEA model predicted B and G of 12,698 MPEAs, we randomly selected 50 systems that were not included in the training data to constitute independent datasets for testing the predictive power of our model (see Table S2 for details). As show in Fig. S4, we plotted the predicted B and G values of all the 12,698 MPEAs (the black square), and divided the predicted values into different regions based on their distribution. We then selected 50 systems from different regions to constitute independent datasets (the red circle dot). The selection of these 50 systems covers all regions of the entire sample space, ensuring that the verification results are both accurate and unbiased, and represent the entirety of the dataset. The mean absolute error (MAE) and the root mean squared error (RMSE) are used to evaluate the performance of AL@MPEA models by comparing with DFT results. As shown in Figure , the values determined by AL@MPEA and DFT exhibit a linear relationship, without any large deviations. The MAE and RMSE of AL@MPEA model for B are 3.57 and 4.96 GPa, and the MAE and RMSE of G prediction are 4.17 and 5.27 GPa, respectively; all agree well with the DFT results. Therefore, we conclude that the AL@MPEA framework allows us to develop database of the 12,698 noble metal MPEAs with DFT accuracy.
Figure 3. The performance of AL@MPEA model on predicting (a) bulk modulus and (b) shear modulus of 50 MPEAs, which are not included in the training data (red solid circle).
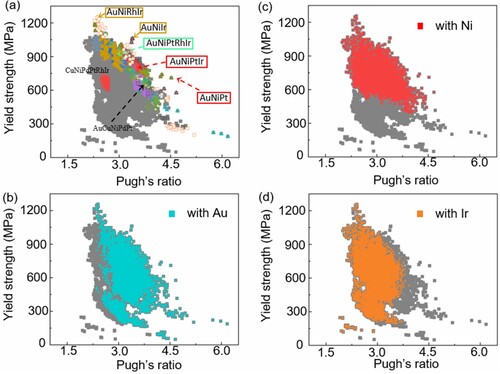
We next use these databases to search noble MPEAs with high toughness and yield strength. Theoretically, the toughness of MPEAs can be evaluated by the Pugh′s ratio (B/G). Alloys with high values of Pugh′s ratio (>1.73) indicate that the material exhibits good toughness, while low values are associated with brittleness [Citation26]. Our calculation shows that the Pugh′s ratio of AuCuNiPdPt larger than that of CuNiPdPtRhIr (3.5 vs. 2.5, respectively), agrees with the experiment proved high compression strain of AuCuNiPdPt than that of CuNiPdPtRhIr (50% vs. 30%, respectively) [Citation27,Citation28]. As shown in Figure (a), the calculated Pugh′s ratio values of all 12,698 MPEAs are larger than 1.73 (the critical value of toughness and brittleness), suggesting that these noble MPEAs tend to exhibit good toughness. Remarkably, Figure (b) shows that alloys containing element Au are distributed on the high Pugh′s ratio area, while other seven elements have no decisive effect on the Pugh′s ratio (see Figure (c)–(d) and Fig. S5). These findings clearly suggest that the toughness of these noble MPEAs would be enhanced by increasing the content of Au in alloys.
Figure 4. (a) Yield strength versus Pugh’s ratio (B/G) of 12,698 MPEAs combined by noble metals (gray square in the figure). The 27 systems (including 9 ternary alloys, 13 quaternary alloys, 4 quinary alloys and 1 senary alloy) in the outer contour possess high yield strength or toughness compared to the CuNiPdPtRhIr systems. (b)–(d) The distribution of alloys with Au, Ni, and Ir in the total 12,698 MPEAs.
As to yield strength, the commonly used model to predict the yield strength of random FCC alloys was derived by Varvenne et al. [Citation29–31]. In this model, the yield strength of random FCC alloys at finite temperature T and finite strain-rate
is evaluated by the yield stress
expressed as:
(1)
(1) where
is a reference strain-rate determined by the dislocation density and other factors, the temperature T is 300 K in theoretical calculations, and
is the zero-stress energy barrier (
). Here, we predicted the yield strength using DFT-calculated bulk modulus (B), shear modulus (G) at 0 K. We note that experiments have shown that the elastic constants Cij of pure metals decrease by less than 10% from 300 K to 0 K. We believe that the yield strength predictions made using the 0 K elastic constants are likely to be less than 10%. The flow stress
, where
is an elastic pressure field associated parameter, and the dislocation Burgers vector b = a0 /
(a0 is the lattice constant of alloys) [Citation32]. θ is a parameter that describes the collective effect of the misfit volumes of all the elements in the alloy, expressed as
, where cn is the concentration of the element in the alloy,
is the misfit volumes of MPEAs. To calculate the
, we used Vegard law combined with the atomic volumes (
) of the fcc pure elements with lattice constants (an). The atomic volume of the random alloy was computed as
, where
is the concentration of the n-th element. The misfit volumes were then calculated as
. This calculation method has been widely used in predicting the misfit volumes of face-centered cubic metals. Moreover, the deviation of Vegard law for many binary solid solution alloys within this family of alloys appear small in a range of experiments and DFT studies.
Figure (a) shows the calculated yield strengths of all the 12,698 MPEAs. Notably, we predicted that the yield strength of 90 PdPtRhIrCuNi series MPEAs are between 602 and 750 MPa, being larger than the experimental value (527 MPa) [Citation27]. The deviation between experimental and predicted results is presumably because: (1) the yield strength model only accounts for the solid solution strengthen, but neglects the grain-boundary strength and grain size strength; and (2) the alloys prepared in experiments are not single phase, but consist of a dendritic phase and an interdendritic phase with similar lattice. Prominently, the predicted yield strength of AuCuNiPdPt MPEA (637 MPa) agrees well with the experimental findings that solid solution strengthen contribute 592 MPa to its yield strength [Citation28].
In all the predicted yield strength of the 12,698 MPEAs, over 86% of the systems show yield strength values higher than 400 MPa, exhibiting better yield strength than that of the Cantor series MPEAs (200 ∼ 400 MPa) [Citation33–35]. Theoretically, many studies have attributed the high yield strength of noble metal MPEAs to the high shear modulus of Rh and Ir (150 and 210 GPa, respectively) [Citation27]. However, this theory cannot explain the experimental observations that AuCuNiPdPt alloy, without Ir or Rh, still exhibit high yield strength [Citation28]. This ‘puzzle’ can be well explained by our calculations. As shown in Figure (c), alloys containing element Ni are distributed on the high yield strength area, while alloys with element Rh and Ir are distributed on both high and low yield strength area. These findings indicate that it is the Ni (but not Rh or Ir) have a decisive effect on the yield strength of the alloys.
To summarize, an active learning guided density functional theory calculation framework, termed as AL@MPEA, was proposed for the fast construction of the elastic property database of 12,698 noble multi-principal element alloys. Compared with standard machine learning models trained by 80 DFT calculated MPEA datasets (ML@MPEA) and 4898 ordered inorganic compounds datasets (ML@IC), our AL@MPEA framework achieves high predictive precision and small fluctuation based on merely 120 DFT calculated data. We further predicted the yield strength and Pugh′s ratio utilizing the established databases of B and G of these alloys. We found that alloys containing Ni have high yield strength, while alloys containing Au have high Pugh′s ratio, which may provide theoretical guidance for the design of MPEAs with high yield strength and toughness.
Supplemental Material
Download Zip (873.1 KB)Disclosure statement
No potential conflict of interest was reported by the author(s).
Additional information
Funding
References
- Miracle DB, Senkov ON. A critical review of high entropy alloys and related concepts. Acta Mater. 2017;122:448–511.
- Li W, Liu P, Liao PK. Microstructures and properties of high-entropy alloy films and coatings: a review. Mater Res Lett. 2018;6:199–229.
- Lai WJ, Vogel F, Zhao XY, et al. Design of BCC refractory multi-principal element alloys with superior mechanical properties. Mater Res Lett. 2022;10:133–140.
- Ding Q, Zhang Y, Chen X, et al. Tuning element distribution, structure and properties by composition in high-entropy alloys. Nature. 2019;574:223–227.
- Huang J, Li WP, He JY, et al. Dual heterogeneous structure facilitating an excellent strength-ductility combination in an additively manufactured multi-principal-element alloy. Mater Res Lett. 2022;10:575–584.
- Yao Y, Dong A, Brozena A, et al. High-entropy nanoparticles: synthesis-structure-property relationships and data-driven discovery. Science. 2022;376:eabn3103.
- Pan Q, Zhang L, Feng R, et al. Gradient cell-structured high-entropy alloy with exceptional strength and ductility. Science. 2021;374:984–989.
- Hart GLW, Mueller T, Toher C, et al. Machine learning for alloys. Nat Rev Mater. 2021;6:730–755.
- Kaufmann K, Vecchio KS. Searching for high entropy alloys: a machine learning approach. Acta Mater. 2020;198:178–222.
- Zhou Q, Lu S, Wu Y, et al. Property-oriented material design based on a data-driven machine learning technique. J Phys Chem Lett. 2020;11:3920–3927.
- Wen C, Zhang Y, Wang C, et al. Machine learning assisted design of high entropy alloys with desired property. Acta Mater. 2019;170:109–117.
- de Jong M, Chen W, Notestine R, et al. Statistical learning framework for materials science: application to elastic moduli of k-nary inorganic polycrystalline compounds. Sci Rep. 2016;6:1–11.
- Kim G, Diao H, Lee C, et al. First-principles and machine learning predictions of elasticity in severely lattice-distorted high-entropy alloys with experimental validation. Acta Mater. 2019;181:124–138.
- Revi V, Kasodariya S, Talapatra A, et al. Machine learning elastic constants of multi-component alloys. Comput Mater Sci. 2021;198:110671.
- Vazquez G, Singh P, Sauceda D, et al. Efficient machine-learning model for fast assessment of elastic properties of high-entropy alloys. Acta Mater. 2022;232:117924.
- Hayashi G, Suzuki K, Terai T, et al. Prediction model of elastic constants of BCC high-entropy alloys based on first-principles calculations and machine learning techniques. Sci Technol Adv Mat Methods. 2022;2:381–391.
- Liu S, Lee K, Balachandran PV. Integrating machine learning with mechanistic models for predicting the yield strength of high entropy alloys. J Appl Phys. 2022;132:105105.
- Gao Y, Bai S, Chong K, et al. Machine learning accelerated design of non-equiatomic refractory high entropy alloys based on first principles calculation. Vacuum. 2023;207:111608.
- Jain A, Ong SP, Hautier G, et al. Commentary: the materials project: a materials genome approach to accelerating materials innovation. APL Mater. 2013;1:011002.
- Wen D, Chang CH, Matsunaga S, et al. Structure and tensile properties of Mx(MnFeCoNi)100-x solid solution strengthened high entropy alloys. Materialia. 2020;9:100539.
- Zunger A, Wei SH, Ferreira LG, et al. Special quasirandom structures. Phys Rev Lett. 1990;65:353–356.
- Kresse G, Furthmüller J. Efficient iterative schemes for ab initio total-energy calculations using a plane-wave basis set. Phys Rev B. 1996;54:11169–11186.
- Friedman JH. Stochastic gradient boosting. Comput Stat Data An. 2002;38:367–378.
- Pedregosa F, Varoquaux G, Gramfort A, et al. Scikit-learn: machine learning in python. J Mach Learn Res. 2011;12:2825–2830.
- Lookman T, Balachandran PV, Xue D, et al. Active learning in materials science with emphasis on adaptive sampling using uncertainties for targeted design. npj Comput Mater. 2019;5:1–17.
- Pugh SF. XCII. Relations between the elastic moduli and the plastic properties of polycrystalline pure metals. Philo Mag. 1954;45:823–843.
- Sohn S, Liu Y, Liu J, et al. Noble metal high entropy alloys. Scripta Mater. 2017;126:29–32.
- Thiel F, Geissler G, Nielsch K, et al. Origins of strength and plasticity in the precious metal based high-entropy alloy AuCuNiPdPt. Acta Mater. 2020;185:400–411.
- Varvenne C, Curtin WA. Predicting yield strengths of noble metal high entropy alloys. Scripta Mater. 2018;142:92–95.
- Varvenne C, Luque A, Curtin WA. Theory of strengthening in fcc high entropy alloys. Acta Mater. 2016;118:164–176.
- Varvenne C, Leyson GPM, Ghazisaeidi M, et al. Solute strengthening in random alloys. Acta Mater. 2017;124:660–683.
- Yin B, Curtin WA. First-principles-based prediction of yield strength in the RhIrPdPtNiCu high-entropy alloy. npj Comput Mater. 2019;5:14.
- Otto F, Dlouhý A, Somsen C, et al. The influences of temperature and microstructure on the tensile properties of a CoCrFeMnNi high-entropy alloy. Acta Mater. 2013;61:5743–5755.
- Gludovatz B, Hohenwarter A, Catoor D, et al. A fracture-resistant high-entropy alloy for cryogenic applications. Science. 2014;345:1153–1158.
- Laplanche G, Kostka A, Horst O, et al. Microstructure evolution and critical stress for twinning in the CrMnFeCoNi high-entropy alloy. Acta Mater. 2016;118:152–163.