?Mathematical formulae have been encoded as MathML and are displayed in this HTML version using MathJax in order to improve their display. Uncheck the box to turn MathJax off. This feature requires Javascript. Click on a formula to zoom.
Abstract
Crystallization processes of glass-glass interfaces in sputtered CuZr thin film nanoglasses were directly studied using in situ heating experiments in a transmission electron microscope (TEM). By combining the in situ technique with a sophisticated symmetry analysis based on nanobeam diffraction patterns (NBDP) and electron correlation microscopy (ECM) to capture the relaxation dynamics in the nanoglass, correlations between excess volume and nucleation kinetics are attained on a microscopic scale. Particularly, glass-glass interfaces with their increased excess volume promote the onset of crystal nucleation.
GRAPHICAL ABSTRACT
IMPACT STATEMENT
In-situ TEM reveals that glass-glass interfaces in CuZr nanoglasses exhibit increased excess volume promoting accelerated crystal nucleation, as shown by motif analysis extracted from nanobeam diffraction and electron correlation microscopy.
1. Introduction
Over the last decades nanoglasses have gained significant interest in the field of metallic glasses [Citation1]. Nanoglasses exhibit a unique structure due to their high amount of glass-glass interfaces [Citation2,Citation3] which separate glassy core regions and offer a high potential for property tuning [Citation4–12]. In the following, the glassy core regions, that are commonly described as having bulk glass properties, are termed ‘glass matrix’ in distinction to the glass-glass interfaces.
It has been shown that glass-glass interfaces have different properties compared with their matrix counterpart [Citation12–14]. Changes in chemical composition and excess volume have been reported [Citation7,Citation15,Citation16] and it may even be speculated that the glass-glass interfaces act as pathways for faster atomic transport in nanoglasses compared to compositionally equivalent homogeneous amorphous materials [Citation12]. Moreover, another matter of particular interest is the thermal stability and the crystallization behavior of nanoglasses. It has been assumed that the crystallization process initially starts at the glass-glass interfaces due to their enhanced atomic mobility [Citation7]. However, arguments based on packing density also arrive at the opposite conclusion, as discussed also for the crystal nucleation in uniform metallic glasses [Citation17]. Generally, until now conclusive experimental evidence for one or the other alternative correlations between local structure, local dynamics and nucleation kinetics is missing [Citation7].
In situ heating experiments are frequently used to examine nucleation in different systems and can provide insight into the underlying mechanisms and theories of nucleation kinetics [Citation18]. Yet, no conclusive assessment could be drawn whether the classical or nonclassical nucleation theory [Citation19,Citation20] can properly describe the process of crystallization.
Here we use the unique nature of nanoglasses to analyze in detail the correlations between excess volume and nucleation kinetics by employing advanced transmission electron microscopy (TEM)-based methods for the analysis of glass-glass interfaces in sputtered CuZr thin film nanoglasses and their crystallization behavior in an in situ approach.
2. Experimental methods
2.1. Sample preparation
Particle-based synthesis approaches of nanoglasses have been a challenge due to reproducibility issues. However, recently magnetron sputtering has been shown as a versatile and readily available method to reproducibly synthesize thin film nanoglasses [Citation12]. In the current work, thin film nanoglasses were produced from an alloy target with nominal composition of CuZr
(in at.%) using Radio Frequency (RF) magnetron sputtering. Sputtering was performed at a power of
, a fixed distance between the substrate and a target diameter of
, a target tilt angle of 20 degrees and a substrate temperature of
. The background pressure prior to deposition was less than
. The working pressure and flow rate of Ar were kept constant at
and
, respectively. Thin films were deposited continuously on Si (100) wafers with a native oxide layer rotating at a velocity of
. Additional films with a thickness of 20 nm were deposited directly on Mo TEM-grids with holey carbon film coated with a 2 nm thin carbon layer. Carefully tuning the synthesis parameters like flow rate or pressure can lead to either the formation of nanoglasses or regular homogeneous amorphous glasses [Citation12]. While a comparably high working pressure was required for the synthesis of the columnar CuZr nanoglass, the parameters required for the synthesis of a homogeneous glass were lower. This may explain the formation of the columnar structure since a higher pressure suppresses the surface diffusion of the sputtered particles which forces them to stay where they initially landed.
An electron transparent TEM lamella of a thin film nanoglass in top view was prepared on a Protochips Fusion Select heating chip using a ZEISS Crossbeam 340 Focued Ion Beam (FIB) device with ion beam energies of and were finally polished at a low ion energy of
to remove preparation artefacts. All samples were investigated in the as-sputtered state.
2.2. TEM measurements
All TEM measurements were performed at 300 kV in an FEI Titan Themis 60–300 (Thermo Fisher Scientific) TEM equipped with an image C corrector and a monochromator using an extraction voltage of 3.45 kV for the X-FEG. Analytical TEM was performed using a quadrupole energy-dispersive X-ray system (Super-X EDX detector), a high-angle annular dark-field (HAADF) detector (Fischione Model 3000), a fast CMOS camera (Ceta, 4k · 4k) and a high-resolution electron energy loss (EEL) spectrometer (Quantum 965 Gatan Imaging Filter).
2.3. In situ heating
High resolution TEM image series with an initial size of 2048 × 2048 pixels and an exposure time of for each frame were acquired over a temperature range between
and
. A heating rate of 20 K/min was chosen to be in line with the calorimetric measurements. A commercial drift correction system Axon (Protochips) was used to keep the drift at a minimum. For more information with respect to the drift correction (Axon) the reader is referred to [Citation21]. Multiple series of HR TEM images were acquired, involving a re-focusing due to the drift in z-direction. Between the series waiting times up to five minutes were required in order to minimize the drift by allowing the system to equilibrate.
2.4. Angular correlation analysis
For the angular correlation analysis a NBDP series containing 6889 individual diffraction pattern was acquired on a thin film as-sputtered on a Mo TEM-grid. The microdiffraction mode was used for the acquisition of the NBDP series using a beam current of and a probe size of
at FWHM with a camera length of
and a stepsize of
. The acquisition time for the individual NBDPs was set to 4 s and a binning of 4 was used to ensure a high signal-to-noise ratio.
To extract the angular correlations the angular correlation function is calculated as:
(1)
(1) where Δ is the correlation angle and
is the diffraction intensity at scattering vector k and azimuthal angle ϕ. Subsequently,
is Fourier transformed, yielding the angular power spectrum
, with n being the Fourier coefficient. The n-fold rotational symmetry of a structure diffracting at a certain k can then be extracted from the Fourier amplitude of the
. For a more detailed description, the reader is referred to [Citation22,Citation23]. For each pixel of the NBDP series, the angular correlations for the four- and five-fold symmetries were calculated for k-values corresponding to the first amorphous ring in the DP using the python package pyxem [Citation24]. These symmetries were chosen, since four-fold rotational symmetries are linked to crystal-like structures in metallic glasses [Citation25], while five-fold rotational symmetries are associated with an icosahedral-like ordering [Citation26]. The spatial distribution of rotational symmetries can then be pixelwise visualized in the form of symmetry maps by plotting the chosen symmetry coefficient for each acquired NBDP.
2.5. Electron correlation microscopy (ECM)
ECM uses intensity changes of tilted dark-field (t-DF) micrographs to extract spatially resolved relaxation dynamics with a nanometer spatial resolution [Citation27]. For the description of dynamics in (metallic) glasses a Kohlrausch-Williams-Watts (KWW)-function [Citation28,Citation29] is often used, where β is the stretching exponent and τ the average relaxation time. From a t-DF micrograph series, a time correlation can be calculated using the autocorrelation function:
. Fitting a KWW-function to each pixel of the time correlation allows mapping the relaxation dynamics in the form of τ- and β-maps. The ECM data-set was acquired over a period of 10,850 s and contained 2170 individual t-DF images, each with 966 × 839 pixels, while every frame had a dwell-time of 4 s with a waiting time of 1 s in-between frames. The ECM measurement was conducted at room temperature on a thin film in as-sputtered condition that was sputtered onto a Mo-TEM grid. It was confirmed that the measurement was done in a quasi-thermodynamic equilibrium through the calculation of momentary relaxation times in the first half and the second half of the measurement and their comparison [Citation30,Citation31]. These relaxation times obtained from the two sub-sets of the measurement deviated by less than 4%, allowing the assumption of quasi-thermodynamic equilibrium [Citation27,Citation30].
3. Results
3.1. In situ heating
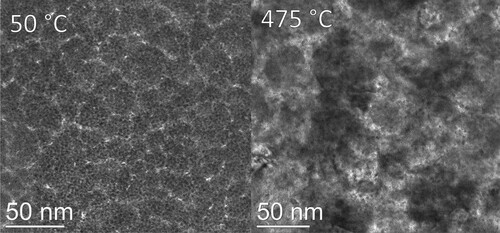
One of the unique nanoglass characteristics is their amorphous microstructure consisting of core regions (or ‘matrix’) which are separated by glass-glass interfaces (also termed ‘channels’ for the case of columnar nanoglasses obtained by sputter deposition). The in situ heating experiment showed that this specific structure did only partially change, even after surpassing the glass transition =
and the crystallization onset temperature
for Cu
Zr
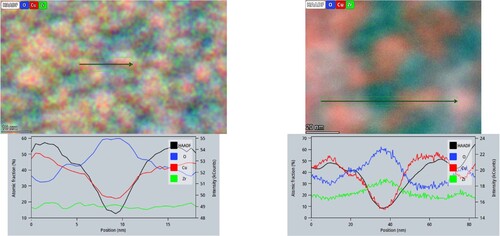
melt spun ribbons [Citation7], as shown in Figure . Larger interfaces prevailed whereas most of the smaller interfaces disappeared. Based on the post-heating elemental analysis by EDX, it occurs that Cu has depleted inside the interfaces during heating and a crystalline ZrO
phase formed, see in the appendix. This is also supported by the NBDP obtained on the interfaces after heating, revealing a monoclinic crystal structure that can be linked to ZrO
. A potential explanation for the formation of ZrO
as the primary crystalline phase may be the temperature dependent process of galvanic corrosion. Assuming CuZr as a galvanic couple, Cu may act as cathode and Zr as anode that actually elevates the capacity to oxidize Zr [Citation32–34].
Figure 1. Two HRTEM images taken at the same sample position, showing the corresponding microstructures at and
, respectively.
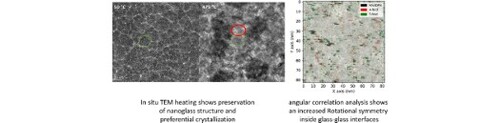
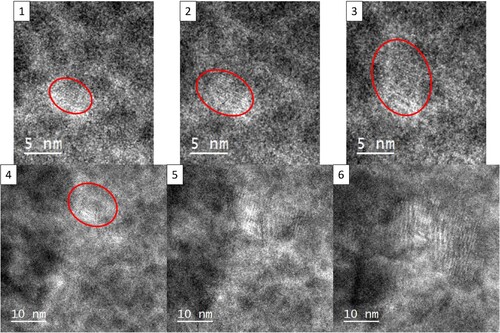
At around crystallization occurred preferentially at the glass-glass interfaces. Figure shows a series of HRTEM images in top view for a columnar thin film nanoglass obtained in the temperature range between 350
and
. The glass-glass interfaces appear in bright contrast, while the matrix occurs darker. Crystallization is clearly starting at the bright regions indicated with a red ring, and subsequently grows to form a larger structurally ordered region, as indicated by the lattice fringes.
Figure 2. Series of HRTEM images of a columnar thin film nanoglass showing the microstructural evolution between and
. The temperature steps between two consecutive images was ≈ 25 K, with (1) acquired at
and (6) at
.
3.2. Angular correlation analysis
The angular correlation analysis yields symmetry maps as shown in Figure (a,b). These symmetry maps are normalized for better comparison. Distinct connected regions with an increased structural order are clearly visible for both symmetry types (four- and five-fold).
Figure 3. Normalized angular correlation maps for four- and five-fold symmetry are shown in (a) and (b), respectively. The inverse, rebinned and normalized HAADF signal of the measurement area is shown in (c). An overlay of the three signals in displayed in (d). The dashed blue ellipse indicates a region where an increased symmetry coincides with a prominent channel whereas the dashed red circle shows a position of a channel without increased 4- and 5-fold symmetry.
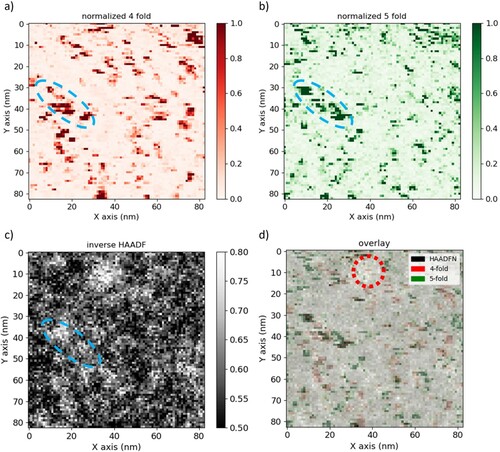
Additionally, the inverse HAADF signal that was acquired prior to the measurement was re-binned and normalized to be comparable to the symmetry maps. It is displayed in Figure (c), where the glass-glass interfaces display bright contrast and dark contrast represents the matrix. In Figure (d) an overlay of both symmetry maps with the inverse HAADF signal is shown. Regions with a glass-glass interface frequently match with either or both symmetry maps, as indicated by a dashed blue ellipse in Figure . However, there are also regions where a clear interface is visible despite the lack of increased symmetry. This is indicated by the dashed red circle in Figure (d).
Since an increase in order most likely promotes nucleation of crystals, these results are in line with the observations of the in situ heating experiment. Thus, it can be concluded that the glass-glass interfaces in a nanoglass are potential nucleation sites for crystallization. Slight local variations in symmetry might dictate at which interfaces nucleation commences first.
3.3. Electron correlation microscopy
The calculated τ-map and the corresponding histogram of the τ values are shown in Figures (a,c) following a lognormal distribution. To gain information on the spatially averaged relaxation dynamics, a KWW function was fitted to the averaged autocorrelation function (g-1)/A. The visualization is shown in Figure (d) yielding a relaxation time of
=
and a stretching exponent of
= 0.63 ± 0.01. A stretching exponent of that magnitude is typically observed, independent of stoichiometry, if long-range diffusive rearrangements control the glassy dynamics as is the case during so-called alpha-relaxation. Observing a similar stretching exponent for the glass-glass interfaces in a nanoglass indicates the glassy nature of this somewhat more ‘exotic’ state of vitreous matter. Additionally, this magnitude of the stretching exponent is in line with the observed crystallization behavior, as long-range diffusive rearrangements are also involved in crystal nucleation. Using the
value, a threshold was introduced to the τ-map, which is displayed in Figure (b), where all pixels with relaxation times exceeding
occur bright and the ones with shorter relaxation times are displayed as dark. Totally about 27% of the pixels show relaxation times above the mean.
Figure 4. ECM performed at RT on the as-sputtered nanoglass showing spatially resolved relaxation times in (a) and relaxation times using a threshold limit of =
in (b), where regions marked with red correspond to matrix and the blue lines indicate channels. The distribution of the τ values fitted with a log-normal function is shown in (c). (d) shows a single KWW-function fitted to the normalized autocorrelation function averaged over 810,474 pixels.
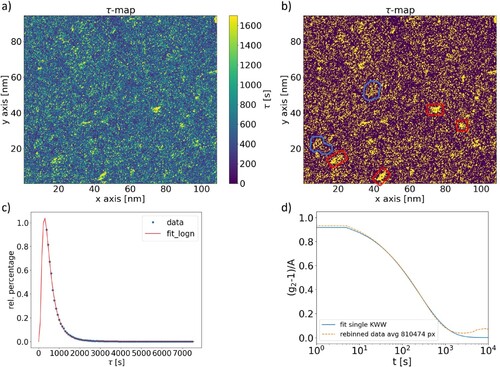
In this visualization some connected regions with slow dynamics are indicated by the red squares. These regions are ‘surrounded’ by regions of faster dynamics indicated by the blue lines, suggesting the presence of the channels-and-matrix structure of the nanoglass.
These results support the analysis based on the in situ heating experiment: faster dynamics, related to an enhanced local excess volume at the glass-glass interfaces favor an early onset of crystal formation. Whether the system is thermodynamically less stable at the glass-glass interfaces or kinetically de-stabilized by enhanced atomic mobility that allows more effective sampling of possible configurations, including crystalline motifs that might act as nucleant or nucleation precursor, presents an interesting but open question that cannot be resolved at this time.
4. Summary and conclusions
This work presents a detailed analysis of the glass-glass interfaces in sputtered CuZr thin film nanoglasses with respect to their local dynamics, their thermal stability and their related crystallization behavior. For this purpose, a systematic analysis based on in situ heating, symmetry analyses of the rotational symmetries or motifs in the amorphous structure and measurements of the spatially resolved relaxation dynamics was employed.
In that, the specific structure of the nanoglass consisting of cores connected by interface regions of nanometer-scale widths was maintained even when heating to temperatures that are above the crystallization onset temperature of melt-spun samples of equal Cu-Zr composition. Remarkably, Cu was found to deplete at the glass-glass interface regions during heating. In addition, preferential crystallization onset at the interfaces was clearly observed.
Deeper insight into the crystallization behavior was achieved by an angular correlation analysis and by electron correlation microscopy that analyzes the local dynamics. The angular correlation analysis revealed that glass-glass interfaces show a propensity for four-fold symmetry, which clearly favors nucleation of crystals at these sites, thereby clarifying a long standing dispute concerning preferential crystal nucleation sites [Citation7]. The impact of five-fold symmetries can not unambiguously be estimated, since such a rotational symmetry is of quasi-crystalline structure. Thus, except cases where stable quasi-crystalline phases might exist in finite ranges of temperature and/or composition, the presence of such motifs would rather impede nucleation of the crystalline equilibrium phases [Citation35].
ECM provided additional insight into the spatial distribution of relaxation dynamics, indicating regions of faster dynamics at glass-glass interfaces and supporting a recent study suggesting that in regions with increased excess volume, such as the glass-glass interfaces, the nucleation of crystalline phases is accelerated [Citation36,Citation37]. Moreover, it is worth mentioning that compositional differences can also have an effect on the crystallization behavior. It was shown that the interfaces in sputtered nanoglasses are somewhat depleted in Cu content [Citation12] which compares nicely with the findings that in binary CuZr metallic glasses a decrease of the Cu content decreases both, and
, leaving the resulting glasses less stable against crystallization [Citation38]. For a phase transition the difference in Gibbs free energy between the two phases is relevant [Citation39]. However, determining the individual contributions, i.e. structural or chemical [Citation40,Citation41], is here not possible without the help of simulations and thus has to be left for future work.
In summary, a detailed investigation of the early stages of the crystallization of a nanoglass has been performed, involving in situ and ex situ analyses at high spatial resolution. The results highlight the crucial role that the glass-glass interfaces play concerning crystal nucleation. Two aspects could either separately or jointly contribute to the local enhancement of the nucleation rate: the preferential presence of motifs with crystal-like symmetry at glass-glass interfaces can provide crystallization ‘templates’ thereby increasing the nucleation rates as described by Turnbull for so-called ‘homophase impurities’ [Citation42]. Additionally, the glass-glass interfaces are also characterized by an increased excess volume in comparison to the glassy core regions, which could give rise to more efficient sampling of possible configurations, including motifs that favor crystal formation. However, why regions with more crystal-like order show faster dynamics at the same time is a fascinating conundrum, which might be related to confinement effects, as might also be involved in the preferential nanocrystallization observed in shear bands, which would allow for advancing our understanding of crystal nucleation in vitreous systems in general.
Acknowledgments
The authors would like to thank Olivia Vaerst for helping with the preparation of the FIB lamella and placing it onto the protochips holder.
Data availability statement
Data will be made available upon reasonable request.
Disclosure statement
No potential conflict of interest was reported by the author(s).
Additional information
Funding
References
- Gleiter H. Our thoughts are ours, their ends none of our own: are there ways to synthesize materials beyond the limitations of today?. Acta Mater. 2008;56(19):5875–5893. doi: 10.1016/j.actamat.2008.08.028
- Ivanisenko Y, Kübel C, Nandam S, et al. Structure and properties of nanoglasses. Adv Eng Mater. 2018;20(12):1–16. doi: 10.1002/adem.v20.12
- Li T, Ma K, Zheng G. The effects of glass–glass interfaces on thermodynamic and mechanical properties of Co–Fe–P metallic nano-glasses. J Mater Res. 2021;36(24):4951–4962. doi: 10.1557/s43578-021-00429-6
- Ritter Y, Şopu D, Gleiter H, et al. Structure, stability and mechanical properties of internal interfaces in cu64zr36 nanoglasses studied by md simulations. Acta Mater. 2011;59(17):6588–6593. doi: 10.1016/j.actamat.2011.07.013
- Albe K, Ritter Y, Şopu D. Enhancing the plasticity of metallic glasses: shear band formation, nanocomposites and nanoglasses investigated by molecular dynamics simulations. Mech Mater. 2013;67:94–103. doi: 10.1016/j.mechmat.2013.06.004
- Stoesser A, Ghafari M, Kilmametov A, et al. Influence of interface on structure and magnetic properties of fe50b50 nanoglass. J Appl Phys. 2014;116(13):Article ID 134305. doi: 10.1063/1.4897153
- Nandam S, Ivanisenko Y, Schwaiger R, et al. Cu-Zr nanoglasses: atomic structure, thermal stability and indentation properties. Acta Mater. 2017;136:181–189. doi: 10.1016/j.actamat.2017.07.001
- Kalcher C, Adjaoud O, Rohrer J, et al. Reinforcement of nanoglasses by interface strengthening. Scr Mater. 2017;141:115–119. doi: 10.1016/j.scriptamat.2017.08.004
- Adjaoud O, Albe K. Microstructure formation of metallic nanoglasses: insights from molecular dynamics simulations. Acta Mater. 2018;145:322–330. doi: 10.1016/j.actamat.2017.12.014
- Adjaoud O, Albe K. Influence of microstructural features on the plastic deformation behavior of metallic nanoglasses. Acta Mater. 2019;168:393–400. doi: 10.1016/j.actamat.2019.02.033
- Arnold W, Birringer R, Braun C, et al. Elastic moduli of nanoglasses and melt-spun metallic glasses by ultrasonic time-of-flight measurements. Trans Indian Inst Met. 2020;73:1363–1371. doi: 10.1007/s12666-020-01969-x
- Voigt H, Rigoni A, Boltynjuk E, et al. Evidence for glass-glass interfaces in a columnar cu-zr nanoglass. Adv Funct Mater. 2023;33(44). Article ID 2302386. doi: 10.1002/adfm.v33.44
- Ramesh N, Davis P, Zielinski J, et al. Application of free-volume theory to self diffusion of solvents in polymers below the glass transition temperature: A review. J Polym Sci B Polym Phys. 2011;49(23):1629–1644. doi: 10.1002/polb.v49.23
- Şopu D, Albe K. Influence of grain size and composition, topology and excess free volume on the deformation behavior of cu–zr nanoglasses. Beilstein J Nanotechnol. 2015;6(1):537–545.
- Franke O, Leisen D, Gleiter H, et al. Thermal and plastic behavior of nanoglasses. J Mater Res. 2014;29(10):1210–1216. doi: 10.1557/jmr.2014.101
- Śniadecki Z, Wang D, Ivanisenko Y, et al. Nanoscale morphology of ni50ti45cu5 nanoglass. Mater Charact. 2016;113:26–33. doi: 10.1016/j.matchar.2015.12.025
- Wang X, Cao Q, Jiang J, et al. Atomic-level structural modifications induced by severe plastic shear deformation in bulk metallic glasses. Scr Mater. 2011;64(1):81–84. doi: 10.1016/j.scriptamat.2010.09.015
- Ye H, Zhang Z, Wang R. Nucleation and growth of nanocrystals investigated by in situ transmission electron microscopy. Small. 2023;Article ID 2303872. doi: 10.1002/smll.202303872
- Kalikmanov V. Classical nucleation theory. In: nucleation theory. Netherlands: Springer; 2012. p.17–41.
- Sleutel M, Lutsko J, Van Driessche A, et al. Observing classical nucleation theory at work by monitoring phase transitions with molecular precision. Nat Commun. 2014;5(1):5598. doi: 10.1038/ncomms6598
- Dukes M, Marusak K, Guo Y, et al. Axon: an in-situ tem software platform streamlines image acquisition, metadata synchronization and data analysis, enabling deeper understanding, and improved reproducibility of in-situ experimental results. Microscopy and Microanalysis. 2022;28(S1):108–109. doi: 10.1017/S1431927622001337
- Huang S, Francis C, Ketkaew J, et al. Correlation symmetry analysis of electron nanodiffraction from amorphous materials. Ultramicroscopy. 2022;232:Article ID 113405. doi: 10.1016/j.ultramic.2021.113405
- Huang S, Francis C, Sunderland J, et al. Large area, high resolution mapping of approximate rotational symmetries in a pd77.5cu6si16.5 metallic glass thin film. Ultramicroscopy. 2022;241:Article ID 113612. doi: 10.1016/j.ultramic.2022.113612
- Duncan J. pyxem/pyxem: pyxem 0.15.1. Online; 2023 May. doi: 10.5281/zenodo.7927374.
- Miracle D. A structural model for metallic glasses. Nat Mater. 2004;3(10):697–702. doi: 10.1038/nmat1219
- Sachdev S, Nelson D. Order in metallic glasses and icosahedral crystals. Phys Rev B. 1985;32(7):4592. doi: 10.1103/PhysRevB.32.4592
- He L, Zhang P, Besser MF, et al. Electron correlation microscopy: a new technique for studying local atom dynamics applied to a supercooled liquid. Microsc Microanal. 2015;21(4):1026–1033. doi: 10.1017/S1431927615000641
- Zhang P, Maldonis J, Liu Z, et al. Spatially heterogeneous dynamics in a metallic glass forming liquid imaged by electron correlation microscopy. Nat Commun. 2018;9(1):1–7. doi: 10.1038/s41467-017-02088-w
- Chung S, Stevens J. Time-dependent correlation and the evaluation of the stretched exponential or Kohlrausch-Williams-Watts function. Am J Phys. 1991;59(11):1024–1030. doi: 10.1119/1.16640
- Das A, Dufresne E, Maaß R. Structural dynamics and rejuvenation during cryogenic cycling in a Zr-based metallic glass. Acta Mater. 2020;196:723–732. doi: 10.1016/j.actamat.2020.06.063
- Das A, Derlet P, Liu C, et al. Stress breaks universal aging behavior in a metallic glass. Nat Commun. 2019;10(1):5006. doi: 10.1038/s41467-019-12892-1
- Hu S, Liu R, Liu L, et al. Influence of temperature and hydrostatic pressure on the galvanic corrosion between 90/10 cuni and aisi 316l stainless steel. J Mater Res Technol. 2021;13:1402–1415. doi: 10.1016/j.jmrt.2021.05.067
- Zhang X. Galvanic corrosion. Uhlig's corrosion handbook. Hoboken, NJ: Wiley; 2011. p. 123.
- Grell D, Wilkin Y, Gostin P, et al. Corrosion fatigue studies on a bulk glassy zr-based alloy under three-point bending. Frontiers in Materials. 2017;3:60. doi: 10.3389/fmats.2016.00060
- Kelton K, Lee G, Gangopadhyay A, et al. First x-ray scattering studies on electrostatically levitated metallic liquids: demonstrated influence of local icosahedral order on the nucleation barrier. Phys Rev Lett. 2003;90(19):Article ID 195504. doi: 10.1103/PhysRevLett.90.195504
- Wilde G, Rösner H. Nanocrystallization in a shear band: an in situ investigation. Appl Phys Lett. 2011;98(25):251904-1–251904-3. doi: 10.1063/1.3602315
- Méar F, Doisneau B, Yavari A, et al. Structural effects of shot-peening in bulk metallic glasses. J Alloys Compd. 2009;483(1–2):256–259.
- Altounian Z, Guo-hua T, Strom-Olsen J. Crystallization characteristics of cu-zr metallic glasses from cu70zr30 to cu25zr75. J Appl Phys. 1982;53(7):4755–4760. doi: 10.1063/1.331304
- Gibbs J. Collected works. ACS Publications; 1928.
- Bohm J. On the driving force in phase transitions: calculation of chemical potential differences. Cryst Res Technol. 1981;16(8):869–877. doi: 10.1002/crat.v16:8
- Mer V. Nucleation in phase transitions. Ind Eng Chem. 1952;44(6):1270–1277. doi: 10.1021/ie50510a027
- Turnbull D. Metastable structures in metallurgy. Metall Mater Trans B. 1981;12:217–230. doi: 10.1007/BF02654454
Appendix. EDX analysis of the nanoglass: prior and after in situ heating
The chemical differences between channel and matrix are displayed in . Two elemental maps obtained by EDX at similar positions and their corresponding elemental profiles prior and after annealing are shown. Note that the depletion of Cu is even more pronounced after annealing.
Figure A1. EDX maps and their corresponding linescan before (left) and after (right) the heating procedure.