
 ?Mathematical formulae have been encoded as MathML and are displayed in this HTML version using MathJax in order to improve their display. Uncheck the box to turn MathJax off. This feature requires Javascript. Click on a formula to zoom.
Abstract
Balancing the hardness and electrical conductivity of copper alloys within complex compositions and processes poses a formidable challenge. This study proposes a strategy combining machine learning with the Pareto front techniques to identify optimal combinations of composition and processing for Cu-xTi (1.5 ≤ x ≤ 5.4, in wt.%) alloys. Through thermodynamic calculations, precipitation simulations, and experimental characterizations, the microstructural evolution of β'-Cu4Ti precipitates in the designed alloys was explored. The interpretability and predictability of the machine learning model played a crucial role in understanding impact of complex alloy compositions and processing on the evolution of properties, thereby guiding the design of Cu-Ti alloys towards improved attributes.
GRAPHICAL ABSTRACT
IMPACT STATEMENT
A novel strategy integrating machine learning with Pareto front is proposed for alloy design, facilitating the rapid screening of Cu-Ti alloys that exhibit superior hardness and electrical conductivity simultaneously.
1. Introduction
High-performance copper alloys have wide applications in diverse fields, including satellite navigation, integrated circuits, and traffic transportation [Citation1,Citation2]. In recent years, Cu-Ti alloys have attracted significant attention due to their pronounced strengthening effect during aging. Extensive research has been conducted on the optimization of alloy composition and processing of Cu-Ti alloys [Citation3–5]. In Cu-Ti alloys, the Ti solute element always exists in the solid solution matrix, leading to increased lattice distortion and hindrance to the movement of dislocations [Citation6]. The primary strengthening phase of Cu-Ti alloys is the metastable β’ phase forming during the aging process [Citation7]. Accordingly, an increase in Ti content may not only lead to a substantial enhancement in alloy hardness but also result in a significant decrease in electrical conductivity. Based on an exhaustive review of literature reports, the hardness of current Cu-Ti alloys can exceed 400 HV, and the electrical conductivity may surpass 60% IACS. However, it is difficult for alloys to have high hardness and high conductivity simultaneously. For instance, when the hardness of Cu-Ti alloy exceeds 300 HV, its electrical conductivity is only approximately 10% IACS [Citation8]. Such a trade-off relation between hardness and electrical conductivity in Cu-Ti alloys poses a big challenge in the development of high-performance Cu alloys. Therefore, there is an urgent need to break the trade-off relation by designing Cu-Ti alloys with excellent comprehensive properties.
Besides alloy composition, the performance of Cu-Ti alloys is significantly influenced by processing parameters, such as solution treatment, aging conditions and cold working conditions. It is challenging to design alloys that meet specific requirements under the complex composition and processing parameters spaces by the conventional trial-and-error approach. However, progressively mature computational methods, including first-principles calculations [Citation9,Citation10], thermodynamic calculations [Citation11], phase-field simulations [Citation12], and machine learning [Citation13,Citation14], can be employed for rapid alloy design. Among these methods, data-driven machine learning methods have been successfully applied in the design of a series of Cu alloys [Citation15–17]. However, very limited reports on Cu-Ti alloys are available. Fang et al. [Citation18] developed an LSSVM model for predicting the hardness of Cu-4.5 wt.%Ti-0.5 wt.%Co alloys. Zhao et al. [Citation19] introduced a Gaussian regression model for predicting the hardness and electrical conductivity of Cu-Ti-(Fe, Co) alloys with Ti content below 0.4 at.%. To date, no research has concurrently predicted hardness and electrical conductivity across various Ti contents and processing parameters, much less the design of Cu-Ti alloys.
Consequently, a property-oriented material design strategy combining the machine learning technique with Parato front was first proposed and then utilized to conduct an efficient alloy design of Cu-Ti alloys, aiming at breaking up the trade-off relation between hardness and electrical conductivity. Subsequently, the designed alloys were prepared and demonstrated to exhibit superior comprehensive performance to the literature data. Furthermore, the interpretability of the model helped to establish connections between processing parameters and the performance of Cu-Ti alloys.
2. Materials and methods
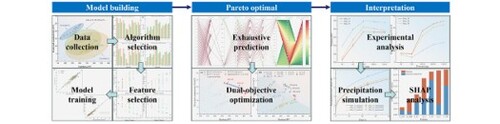
The framework of the machine learning method used in this work includes data collection, data analysis/cleaning, model training and selection, dual-objective optimization, experimental validation, and model interpretability analysis. Initially, a comprehensive dataset comprising 170 experimental sets was collected and analyzed [Citation8,Citation20–24]. According to the experimental experience, the solution temperature (STT/℃), solution time (ST/h), aging temperature (ATT/℃), aging time (AT/h), and cold-rolling deformation (CRD/%) are identified as the most important process parameters. Additionally, the hydrogen pressure (H2/MPa) during aging was also collected as the process parameter. Supplementary Table S1 displays the data space encompassing composition, process, and properties in the dataset.
Eight machine learning algorithms from the scikit-learn package in Python [Citation25] were employed, including Multilayer Perceptron Regression (MLPReg), Random Forest (RF), K-Nearest Neighbors (K-NN), Adaptive Boosting (AdaBoost), Ridge Regression, Gradient Boosting Regression (GBR), and Support Vector Machine (SVM_rbf/poly). Coefficient of Determination (R2) and Mean Absolute Error (MAE) were used as evaluation metrics. Based on the prediction results, the optimal combination of composition and processes for Cu-Ti alloys with high hardness and conductivity was identified by the Pareto front (PF) method [Citation26,Citation27]. The NSGA-II evolutionary algorithm was applied to optimize the established dual-objective optimization model. Additionally, the SHAP (SHapley Additive explanations) [Citation28] method was employed to analyze the contribution of each feature to the predicted properties in machine learning models.
Phase diagram analysis, precipitation simulation, and experimental characterization were employed to assess the influence of characteristic variables on the alloy's structure and performance. Vickers hardness tests (HV 0.3–50) were conducted with an applied load of 300 g and a holding time of 15 s. Electrical conductivity was assessed using an eddy current conductivity meter. TEM analysis was executed using Talos F200X, with High-Angle Annular Dark-Field (HAADF) imaging applied for nano-scale morphology examination, while Energy Dispersive Spectroscopy (EDS) and Fast Fourier Transform (FFT) facilitated phase identification.
3. Results and discussion
3.1. Data analysis
The hardness and electrical conductivity data for Cu-Ti alloys, aggregated from literature, are presented in Supplementary Figure S1. To further investigate the pivotal factors influencing the hardness and conductivity of Cu-Ti alloy, the influence of three main characteristic variables (i.e. cold rolling deformation, aging time, and solution temperature) on the properties of Cu-Ti alloys and three representative Cu-Ti alloys (i.e. Cu-1.5Ti, Cu-2.7Ti, and Cu-3.2Ti) was examined. As depicted in Figure (a,d,g,j), cold rolling plays a pivotal role in enhancing mechanical properties, requiring a considerable increase in cold rolling deformation to achieve elevated hardness in low-titanium Cu-Ti alloys. An increase in both hardness and electrical conductivity was observed with extended aging time. All the high-performance data points are associated with the combination of significant cold rolling deformation and prolonged aging time, suggesting a strong synergistic effect between cold rolling deformation and aging time. Notably, signs of over-aging were observed in Cu-3.2Ti subjected to 60% cold rolling after 48 h of aging, highlighting distinct variations in the optimal processing combinations for different alloys.
Figure 1. Correlation between cold rolling deformation, aging time, solution temperature, and the properties for pure components ((a)–(c)), and Cu-Ti alloys ((d)–(f), (g)–(i), and (j)–(l)).
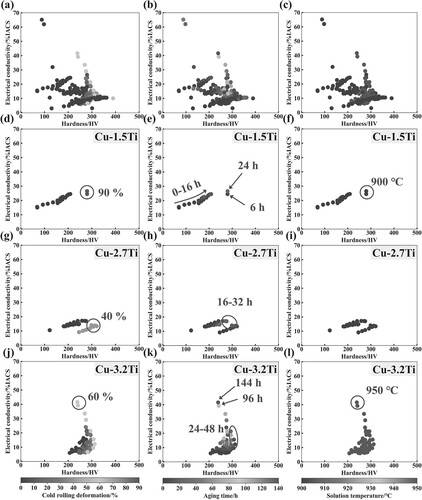
This study also focuses on additional process parameters (aging temperature, H2 atmosphere, and solution time) and their impact on Cu-Ti properties (illustrated in Supplementary Figure S2). As the aging temperature increases, the alloy achieves peak-aged hardness in a shorter time. The use of an H2 atmosphere was observed to improve alloy conductivity, without notable effects on hardness. Existing literature has limited research on solution conditions, with parameters mainly determined based on thermodynamic phase diagrams.
3.2. Alloy design process
Considering the compounded effects of various characteristics on alloy properties, an alloy design framework has been developed based on machine learning combined with Pareto front analysis. This framework aims to facilitate the rapid design of Cu-Ti alloy compositions and processes, with the goal of achieving both high hardness and high electrical conductivity. Comparing R2 and MAE metrics in Supplementary Figure S3 reveals that the MLPReg model demonstrates the highest R2 and the lowest MAE on both training and testing sets. Consequently, the MLPReg algorithm was chosen for subsequent predictions. Evaluation of all possible combinations of the seven features, as depicted in Supplementary Figure S4, demonstrated that optimal results were obtained when all seven features were simultaneously considered. Following model and feature selection, hyperparameter optimization was performed through random search. Subsequently, a comparison between the predictions generated by the trained and optimized MLPReg model and the corresponding experimental properties as shown in Supplementary Figure S5, indicated a good alignment between the predicted hardness and electrical conductivity and the experimental data, both in the training and testing sets. For hardness prediction, the R2 values reached 0.92 and 0.79 for the training and testing sets, respectively. Regarding electrical conductivity prediction, the R2 values achieved 0.97 and 0.91 for the training and testing sets.
The trained model can predict the properties (hardness and electrical conductivity) of Cu-Ti alloys across composition and process parameters space. In this study, the performance of Cu-Ti alloys was predicted using the exhaustive method, considering the distribution of all parameters. Taking into account the distinctive characteristics of various features and their impact on performance, numerical constraints were applied to the composition and process parameter space (shown in Supplementary Table S3), resulting in 150,528 combinations of compositions and processes for Cu-Ti alloys. The predicted properties are presented in the Supplementary Figure S6.
Identifying Pareto optimality serves as a proficient strategy for addressing the conflict between hardness and electrical conductivity in Cu-Ti alloys. To direct the outcomes towards high-performance regions, constraints were set within the Pareto front optimization, mandating a minimum hardness of 250 HV and an electrical conductivity above 15% IACS. The Pareto solution set, illustrated in Figure (a), showcases a wide hardness distribution among candidate alloys, spanning 264–414 HV. While the conductivity distribution span is narrow, with a significant transition and decline noted in the high-hardness segment beyond 380 HV. Notably, low titanium alloys (2.0 wt.%<Ti < 2.5 wt.%) can achieve a greater variety of performance combinations through optimization of composition and process parameters. When prioritizing hardness, it is challenging to achieve conductivity exceeding 20%IACS for high titanium alloys (2.5 wt.%<Ti) within the parameter space.
Figure 2. (a) Three newly expected data (five-pointed stars) designed by the Pareto front technique; (b) a comparison between the experimental properties of the designed alloys and those from the literature reports [Citation8,Citation20–24]; (c) and (d) represent the experimental hardness and electrical conductivity at different stages for the three designed alloys; (e) Cu-Ti Phase diagram (Ti < 10wt.%) [Citation29]; (f) Simulated mean radius of precipitates, compared with the experimental data.
![Figure 2. (a) Three newly expected data (five-pointed stars) designed by the Pareto front technique; (b) a comparison between the experimental properties of the designed alloys and those from the literature reports [Citation8,Citation20–24]; (c) and (d) represent the experimental hardness and electrical conductivity at different stages for the three designed alloys; (e) Cu-Ti Phase diagram (Ti < 10wt.%) [Citation29]; (f) Simulated mean radius of precipitates, compared with the experimental data.](/cms/asset/ca4d30d6-beb7-4c34-b624-37b536de7eba/tmrl_a_2358964_f0002_ob.jpg)
Points within the ‘higher hardness (MH > 380 MPa)’, ‘higher conductivity (EC > 18%IACS)’ and ‘balanced’ regions were chosen from the Pareto front. The nominal compositions of Alloy 1# (2.0 wt.% Ti), Alloy 2# (2.2 wt.% Ti), and Alloy 3# (3.5 wt.% Ti), along with their corresponding process parameters were selected for experimental preparation, as shown in Table . The experimentally determined hardness and electrical conductivity of the designed alloy are depicted in Figure (b). After aging for 24 h, Alloy 3# exhibited the highest hardness at 345.9 HV, whereas Alloy 1# demonstrated the highest electrical conductivity at 21.4%IACS. The experimental results of these three alloys align well with the expected performance characteristics.
Table 1. List of compositions and process parameters of three selected alloys.
3.3. Experimental validation
The effectiveness of the designed alloy formulations was evaluated by measuring their hardness and electrical conductivity, as detailed in Figure (b). After removing discrete hardness values below 100 HV, it becomes evident that the properties of the three alloys aged for 24 h, prepared under the guidance of the Pareto front, surpass the comprehensive properties of all the other Cu-Ti alloys. The model has effectively met its predictive expectations. Comparing the predicted results of the 24-hour aging with experimental data, it is observed that the relative errors in hardness for the three alloys are 3%, 14%, and 15%, while those in electrical conductivity are 15%, 11%, and 23%, respectively. Setting aside the impact of experimental errors, the results indicate a good agreement between the predicted and experimental outcomes for Alloy 1# and Alloy 2#. The relatively larger error observed in Alloy 3# can be attributed to the absence of reference data points within the range of 3.2 wt.% < Ti < 4.3 wt.%. When incorporating the obtained experimental results into the dataset for iterative refinement, the predictions for the alloys with Ti content larger than 2.5 wt.% exhibit greater consistency with actual results, as shown in the red circle points in Figure (a).
3.4. Mechanism analysis
Precipitation simulation and TEM analysis were utilized to explore the mechanisms underlying the changes in alloy properties. The computation of phase diagram [Citation29] and property diagrams (refer to Figure (e) and Supplementary Figure S7) revealed that after undergoing heat treatment at 900°C, all three alloys exhibit a singular supersaturated solid solution. Subsequent aging at a lower temperature of 380°C results in the precipitation of solute atoms within the supersaturated solid solution, forming a second phase in the guise of β'-Cu4Ti. Utilizing the thermodynamic [Citation29] and atomic mobility [Citation30] descriptions in the literature, the precipitation simulations under aging temperatures were conducted for three alloys using the Pandat software [Citation31]. The thermophysical parameters are listed in Supplementary Table S4, and the interfacial energy was calculated using openIEC designed by Yang et al. [Citation32]. The evolution of precipitated phase size over time is depicted in Figure (f). With increasing aging time, the size of the precipitated phases gradually enlarges. Additionally, as Ti content increases, property diagrams indicate an increase in precipitate fraction, while precipitation simulation results show an increase in precipitate size. The simulation results prompted further examination of properties of the three alloys over extended aging periods (48 and 72 h), as shown in Figure (c) and (d), revealing that hardness decreases while electrical conductivity improves over time. Notably, the performance of the three alloys over longer aging periods aligns more closely with the Pareto front compared to the results observed after 24 h of aging.
To validate the computational results, TEM analysis was conducted on the alloys. Figure (a) displays the HAADF image of Alloy 2# after aging for 48 h. After aging, β'-Cu4Ti forms and grows in the alloy. HRTEM and FFT analysis along the [001]Cu zone axis reveal two variants of β'-Cu4Ti. The precipitate adopts a tetragonal D1a structure, maintaining the following orientation relationship with the matrix [Citation33]:
The sizes of β'-Cu4Ti precipitates in the three alloys were also observed at different aging times. For Alloy 2# aged for 24 h, the average size of the precipitates was 10.09 nm, which increased to 13.98 nm upon extending the aging to 48 h. Alloy 1# and Alloy 3#, aged for 48 h, exhibited average participate sizes of 13.2 and 16.89 nm, respectively (shown in Figure (j–m) and Supplementary Figure S8). This fact demonstrates a positive correlation between the size of the precipitated phases and Ti content. From Figure (f), it is evident that the experimental results align closely with the simulated results. Furthermore, analyzing the trends in alloy hardness, electrical conductivity, and precipitate size reveals that the coarsening of the precipitates is detrimental to alloy hardness but beneficial to electrical conductivity.
Figure 3. Measured microstructures of designed alloys: (a) STEM-HAADF image of the precipitates in Alloy 2# aged at 380°C for 48 h. (b) and (c) depict the elemental mappings for Cu and Ti, respectively, from the area shown in (a). Figures (e) and (f) respectively depict the magnified micrograph and FFT image of Area 1 in (d), while (g) and (h) correspond to Area 2;(i) the positions of β’-Cu4Ti tetragonal lattice diffraction spots along the [001]Cu axis [Citation34]; (j) shows the morphologies and average sizes of precipitates in Alloy 2# aged for 24 h; (k) for Alloy 1# aged for 48 h; (l) for Alloy 2# aged for 48 h; (m) for Alloy 3# aged for 48 h.
![Figure 3. Measured microstructures of designed alloys: (a) STEM-HAADF image of the precipitates in Alloy 2# aged at 380°C for 48 h. (b) and (c) depict the elemental mappings for Cu and Ti, respectively, from the area shown in (a). Figures (e) and (f) respectively depict the magnified micrograph and FFT image of Area 1 in (d), while (g) and (h) correspond to Area 2;(i) the positions of β’-Cu4Ti tetragonal lattice diffraction spots along the [001]Cu axis [Citation34]; (j) shows the morphologies and average sizes of precipitates in Alloy 2# aged for 24 h; (k) for Alloy 1# aged for 48 h; (l) for Alloy 2# aged for 48 h; (m) for Alloy 3# aged for 48 h.](/cms/asset/036609e5-57b5-4077-8628-470892fca7d7/tmrl_a_2358964_f0003_ob.jpg)
The mechanisms underlying variations in alloy hardness and electrical conductivity at different process stages can be analyzed by integrating the aforementioned simulation results with microstructural characterization. Cold deformation introduces a significant number of crystal defects, promoting the nucleation of the β’ phase through dislocations [Citation8,Citation20,Citation23]. Coupled with the interaction between deformed twins and the amplitude modulation structure, alloy hardness is significantly enhanced. Consequently, the alloys prepared in this study exhibit a shorter peak aging time than reported in the literature [Citation23]. The decrease in electrical conductivity during deformation can be attributed to the increased dislocation density, which enhances the scattering effect during electron migration [Citation8,Citation20,Citation21]. The increase in electrical conductivity with prolonged aging time can be attributed to two factors, i.e. (i) that the precipitation of solute atoms from the matrix to form a second phase, which weakens the impurity scattering. Moreover, H2 also contributes to reducing the impurity scattering, since hydrogen atoms can react with titanium atoms, forming TiH2 compounds [Citation35,Citation36]; and(ii) that the formation and evolution of twins induce an increase in the content of special grain boundaries, reduce the overall grain boundary energy, and simultaneously disrupt the network connectivity of random grain boundaries, thereby reducing the scattering of grain boundaries [Citation37,Citation38]. The observed reduction in over-aged hardness is attributed to the coarsening of precipitates.
3.5. Model interpretability analysis
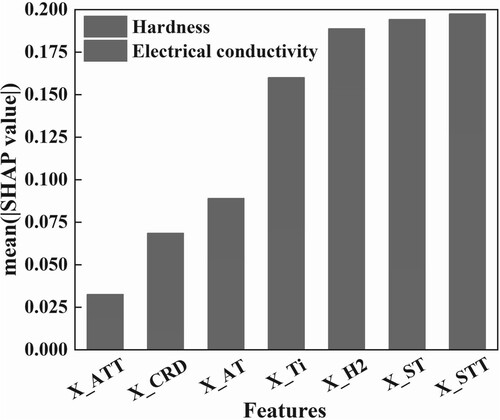
With the extension of aging time, the electrical conductivity of all three alloys has increased by approximately 20%, while the degree of hardness sacrifice varies. This indicates that the performance changes are influenced by a combination of multiple characteristics, which can be analyzed using SHAP (SHapley Additive exPlanations). SHAP quantifies the importance of each input variable in the model by decomposing the prediction into the sum of contributions from individual input variables [Citation39]. As illustrated in Figure , the solution temperature, solution time, and H2 atmosphere are the pivotal factors for the overall output value. Specifically, solution time, solution temperature, Ti content, and cold rolling deformation emerge as the most crucial elements affecting hardness. On the other hand, H2 atmosphere, solution temperature, Ti content, and aging time are identified as the most influential factors impacting conductivity. Notably, the Ti content represents a feature involving the most significant trade-off relationship. Extending the aging time within the peak aging range is a key factor for simultaneously enhancing both hardness and electrical conductivity. Consequently, regulating the aging time emerges as a crucial aspect in breaking the traditional trade-off relationship between hardness and electrical conductivity.
Figure 4. Influence of each input variable on model predictions (SHAP value). The blue signifies contribution to electrical conductivity, while the red indicates contribution to hardness. The length of the bar corresponds to the strength of the effect.
4. Conclusion
In summary, the machine learning techniques combined with the Pareto front were employed to excavate the alloy design scheme, breaking the trade-off relation between hardness and conductivity of Cu-xTi (1.5 ≤ x ≤ 5.4, in wt.%) alloys under the complex composition and processes parameters space with a small sample dataset (<200). Furthermore, thermodynamic calculations and precipitation simulations were conducted to investigate the microstructural evolution (fraction and grain size) of the β'-Cu4Ti precipitate phase, which was validated by the experimental characterizations. The designed Cu-Ti alloy demonstrates optimal performance with hardness reaching 303.1 HV, accompanied by a corresponding electrical conductivity of 20.2%IACS. The interpretability and predictability of the machine learning model were employed to understand the impact of the complex alloy composition and processes on performance evolution. Crucial determinants of the model's output were identified as solution conditions, hydrogen atmosphere, and Ti content. Importantly, aging time was identified as a pivotal factor disrupting the traditional trade-off relation between hardness and electrical conductivity, providing valuable direction for the design of Cu-Ti alloys to simultaneously enhance hardness and electrical conductivity.
Supplemental Material
Download MS Word (10.3 MB)Data and materials availability
The data supporting the findings of this work is available in the main text. Raw data are available from the corresponding authors upon reasonable request.
Disclosure statement
No potential conflict of interest was reported by the author(s).
Additional information
Funding
References
- Lu L, Shen Y, Chen X, et al. Ultrahigh strength and high electrical conductivity in copper. Science. 2004;304(5669):422–426. doi:10.1126/science.1092905
- Gorsse S, Ouvrard B, Gouné M, et al. Microstructural design of new high conductivity – high strength Cu-based alloy. J Alloys Compd. 2015;633:42–47. doi:10.1016/j.jallcom.2015.01.234
- Semboshi S, Kaneno Y, Takasugi T, et al. Effect of composition on the strength and electrical conductivity of Cu-Ti binary alloy wires fabricated by aging and intense drawing. Metall Mater Trans A. 2019;50(3):1389–1396. doi:10.1007/s11661-018-5088-z
- Meng X, Cui Z, Huang L, et al. Effects of loads and speeds on friction and wear properties of Cu–Ti alloys processed by combination aging treatments. J Mater Res Technol. 2023;26:948–960. doi:10.1016/j.jmrt.2023.07.239
- Soffa WA, Laughlin DE. High-strength age hardening copper–titanium alloys: redivivus. Prog Mater Sci. 2004;49(3):347–366. doi:10.1016/S0079-6425(03)00029-X
- Eze AA, Jamiru T, Sadiku ER, et al. Effect of titanium addition on the microstructure, electrical conductivity and mechanical properties of copper by using SPS for the preparation of Cu-Ti alloys. J Alloys Compd. 2018;736:163–171. doi:10.1016/j.jallcom.2017.11.129
- Nagarjuna S, Balasubramanian K, Sarma DS. Effect of Ti additions on the electrical resistivity of copper. Mater Sci Eng, A. 1997;225(1):118–124. doi:10.1016/S0921-5093(96)10578-5
- Nagarjuna S, Balasubramanian K, Sarma DS. Effect of prior cold work on mechanical properties, electrical conductivity and microstructure of aged Cu-Ti alloys. J Mater Sci. 1999;34(12):2929–2942. doi:10.1023/A:1004603906359
- Yang S, Liu G, Zhong Y. Revisit the VEC criterion in high entropy alloys (HEAs) with high-throughput ab initio calculations: A case study with Al-Co-Cr-Fe-Ni system. J Alloys Compd. 2022;916:165477. doi:10.1016/j.jallcom.2022.165477
- Huo W, Wang S, Dominguez-Gutierrez FJ, et al. High-entropy materials for electrocatalytic applications: a review of first principles modeling and simulations. Mater Res Lett. 2023;11(9):713–732. doi:10.1080/21663831.2023.2224397
- Lu Z, Zhang L. Thermodynamic description of the quaternary Al-Si-Mg-Sc system and its application to the design of novel Sc-additional A356 alloys. Mater Des. 2017;116:427–437. doi:10.1016/j.matdes.2016.12.034
- Gao J, Malchère A, Yang S, et al. Dewetting of Ni silicide thin film on Si substrate: In-situ experimental study and phase-field modeling. Acta Mater. 2022;223:117491. doi:10.1016/j.actamat.2021.117491
- Tianchuang G, Jianbao G, Jinliang Z, et al. Development of an accurate “composition-process-properties” dataset for SLMed Al-Si-(Mg) alloys and its application in alloy design. J Mater Inf. 2023;3(1):6–20. doi:10.20517/jmi.2023.03.
- Ding Z, Zhou J, Yang P, et al. Accelerated exploration of high-performance multi-principal element alloys: data-driven high-throughput calculations and active learning method. Mater Res Lett. 2023;11(8):670–677. doi:10.1080/21663831.2023.2215826
- Sprueill HW, Bilbrey JA, Pang Q, et al. Active sampling for neural network potentials: Accelerated simulations of shear-induced deformation in Cu–Ni multilayers. J Chem Phys. 2023;158(11):114103. doi:10.1063/5.0133023
- Jin H, Wang H, Wang X, et al. Alloying element distributions of precipitates in Cu–Cr alloys aided by machine learning. Mater Today Commun. 2023;36:106612. doi:10.1016/j.mtcomm.2023.106612
- Torabi A, Babaheydari RM, Akbari GH, et al. Optimizing of micro-hardness of nanostructured Cu–Cr solid solution produced by mechanical alloying using ANN and genetic algorithm. SN Appl Sci. 2020;2(11):1919. doi:10.1007/s42452-020-03722-x
- Fang SF. Prediction of the hardness of Cu-Ti-Co alloy using machine learning techniques. Key Eng Mater. 2018;777:372–376. doi:10.4028/www.scientific.net/KEM.777.372
- Zhao Q, Yang H, Liu J, et al. Machine learning-assisted discovery of strong and conductive Cu alloys: Data mining from discarded experiments and physical features. Mater Des. 2021;197:109248. doi:10.1016/j.matdes.2020.109248
- Nagarjuna S, Balasubramanian K, Sarma DS. Effect of prior cold work on mechanical properties and structure of an age-hardened Cu–1.5 wt% Ti alloy. J Mater Sci. 1997;32(13):3375–3385. doi:10.1023/A:1018608430443
- Nagarjuna S, Balasubramanian K, Sarma D. Effects of cold work on precipitation hardening of Cu-4.5 mass%Ti Alloy. Mater Trans, JIM. 1995;36:1058–1066. doi:10.2320/matertrans1989.36.1058.
- Semboshi S, Shin-ichi O, Suda H, et al. Aging of copper-titanium dilute alloys in hydrogen atmosphere: influence of prior-deformation on strength and electrical conductivity. Mater Trans. 2011;52:2137–2142. doi:10.2320/matertrans.M2011173
- Semboshi S, Numakura H, Gao WL, et al. Effect of prior cold-working on strength and electrical conductivity of Cu-Ti dilute alloy aged in a hydrogen atmosphere. Mater Sci Forum. 2010;654–656:1315–1318. www.scientific.net/MSF.654-656.1315.
- Semboshi S, Nishida T, Numakura H. Microstructure and mechanical properties of Cu–3at.% Ti alloy aged in a hydrogen atmosphere. Mater Sci Eng, A. 2009;517(1):105–113. doi:10.1016/j.msea.2009.03.047
- Pedregosa F, Varoquaux GL, Gramfort A, et al. Scikit-learn: machine learning in python. J Mach Learn Res. 2012;12:2825–2830.
- He K, Tang R, Jin M. Pareto fronts of machining parameters for trade-off among energy consumption, cutting force and processing time. Int J Prod Econ. 2017;185:113–127. doi:10.1016/j.ijpe.2016.12.012
- Witman MD, Ling S, Wadge M, et al. Towards Pareto optimal high entropy hydrides via data-driven materials discovery. J Mater Chem A. 2023;11(29):15878–15888. doi:10.1039/D3TA02323K
- Lundberg SM, Lee S-I. A unified approach to interpreting model predictions. In: Luxburg UV, Guyon I, Bengio S, et al, editors. Proceedings of the 31st International conference on neural information processing systems. Long Beach (CA): Curran Associates Inc.; 2017. p. 4768–4777.
- Yang H, Zeng B, Wang H, et al. Phase equilibria and thermodynamic re-assessment of the Cu–Ti system. Calphad. 2023;82:102594. doi:10.1016/j.calphad.2023.102594
- Wang J, Leinenbach C, Liu LB, et al. Assessment of the atomic mobilities in fcc Cu-Fe and Cu-Ti Alloys. J Phase Equilib Diffus. 2011;32(1):30–38. doi:10.1007/s11669-010-9819-0
- Cao W, Chen SL, Zhang F, et al. PANDAT software with PanEngine, PanOptimizer and PanPrecipitation for multi-component phase diagram calculation and materials property simulation. Calphad. 2009;33(2):328–342. doi:10.1016/j.calphad.2008.08.004
- Yang S, Zhong J, Wang J, et al. OpenIEC: an open-source code for interfacial energy calculation in alloys. J Mater Sci. 2019;54(14):10297–10311. doi:10.1007/s10853-019-03639-w
- Ecob RC, Bee JV, Ralph B. The cellular reaction in dilute copper-titanium alloys. Metall Trans A. 1980;11(8):1407–1414. doi:10.1007/BF02653496
- Rouxel B, Cayron C, Bornand J, et al. Micro-addition of Fe in highly alloyed Cu-Ti alloys to improve both formability and strength. Mater Des. 2022;213:110340. doi:10.1016/j.matdes.2021.110340
- Semboshi S, Al-Kassab T, Gemma R, et al. Microstructural evolution of Cu-1at% Ti alloy aged in a hydrogen atmosphere and its relation with the electrical conductivity. Ultramicroscopy. 2009;109(5):593–598. doi:10.1016/j.ultramic.2008.10.015
- Semboshi S, Takasugi T. Fabrication of high-strength and high-conductivity Cu–Ti alloy wire by aging in a hydrogen atmosphere. J Alloys Compd. 2013;580:S397–S400. doi:10.1016/j.jallcom.2013.03.216
- Tu Y, Liu X, Wang W, et al. Grain boundary evolution and effect on electrical conductivity of CuTi alloys prepared by accumulative roll bonding-diffusion alloying process. Mater Charact. 2023;201:112958. doi:10.1016/j.matchar.2023.112958
- Zhang Y, Li YS, Tao NR, et al. High strength and high electrical conductivity in bulk nanograined Cu embedded with nanoscale twins. Appl Phys Lett. 2007;91(21):211901. doi:10.1063/1.2816126
- Lundberg SM, Erion GG, Lee SI. Consistent individualized feature attribution for tree ensembles. In: Kim B, Malioutov DM, Varshney KR, et al, editors. 2017 ICML workshop on human interpretability in machine learning. Sydney: Australia; 2018. p. 31–38.