
 ?Mathematical formulae have been encoded as MathML and are displayed in this HTML version using MathJax in order to improve their display. Uncheck the box to turn MathJax off. This feature requires Javascript. Click on a formula to zoom.
Abstract
Herein, we explore the effect of dynamic strain aging (DSA) on dislocation evolution using nanoindentation and transmission electron microscopy (TEM). DSA is primarily manifested as serrations on the load-displacement curves at lower strain rates (10−2 and 10−3 s−1), whereas these serrations are substantially less at higher strain rate (10−1 and 100 s−1). Interestingly, despite variations in strain rates and DSA occurrence, detailed TEM observations beneath the indentations reveal no discernible differences in dislocation density and substructure. The present study indicates that although DSA can increase the gliding resistance of dislocations, it does not affect the evolution of dislocation.
GRAPHICAL ABSTRACT

1. Introduction
Dynamic strain aging (DSA) is a phenomenon in which the solute atoms diffuse to dislocations that are temporarily arrested at pre-existing strong obstacles, e.g. forest dislocations, thereby hindering dislocation motion [Citation1,Citation2]. DSA can occur in a wide range of engineering metallic materials including alloys of Al [Citation3], Mg [Citation4], Cu [Citation5], and Ti [Citation6], steels [Citation7,Citation8] and complex concentrated alloys [Citation9,Citation10]. Generally, DSA leads to negative strain rate sensitivity (nSRS) [Citation11–13] and plastic instabilities detrimental to formability [Citation14–16]. Therefore, it is crucial to ascertain the mechanism of DSA and its influence on mechanical performance. DSA is typically manifested macroscopically through serrations in stress–strain curves during uniaxial tension, which are attributed to the pinning effect of solute atoms on dislocation motion. It has been shown by experiments and analytical modeling that the DSA induced slip resistance is generally a few tens of MPa depending on strain rate [Citation17–19]. Besides, as the waiting time of temporarily arrested dislocations increases with strain, more solute atoms can segregate into dislocations, leading to the increase of DSA induced slip resistance with strain and thereby strain hardening [Citation20,Citation21]. Considering the additional slip resistance, it has been proposed that the presence of DSA can reduce dislocation mean free path and thus promote dislocation multiplication [Citation22]. In a recent investigation, the increasing rate of dislocation density per strain in a Fe-Mn-C twinning-induced plasticity (TWIP) steel with DSA is generally higher than some face-centered cubic (FCC) alloys without DSA [Citation23]. In addition, a higher dislocation density is obtained in a ferritic stainless steel after deformation at 673 K, which has been attributed to the restraining effect of DSA on dislocation cross-slip [Citation24]. Although previous studies have offered preliminary insights into the DSA effect on dislocation evolution, it remains unclear how and to what extent the DSA affects the dislocation evolution and thereby contributes to strain hardening.
Existing investigations correlated to DSA are mainly based on typical uniaxial tensile tests, which involve the use of bulk polycrystal specimens. However, the DSA effect is susceptible to some microstructural factors, such as grain boundary [Citation25,Citation26], phase boundary [Citation27,Citation28], and crystal orientation [Citation29,Citation30]. Therefore, conducting mechanical tests within a single grain could be an ideal approach to exclude these factors and allow for a more accurate evaluation of DSA effect on dislocation evolution. Instrumented nanoindentation, which enables the investigation of mechanical behavior within a single grain [Citation31,Citation32], can be an effective method to achieve this objective. Additionally, the occurrence of DSA can be controlled via the strain rate used for nanoindentation tests, analogous to uniaxial tension tests [Citation30,Citation33–36]. Therefore, in this study, rate-controlled nanoindentation tests were systematically performed within single grains of a TWIP steel. Microstructures beneath the indents were comprehensively characterized to explore the impacts of DSA on the evolution of dislocations in terms of density and substructure. Interestingly, despite variations in strain rates and DSA occurrence, detailed transmission electron microscopy (TEM) observations beneath the indentations reveal no discernible differences in dislocation density and substructure. DSA can affect mechanical properties without influencing dislocation multiplication and evolution of substructure.
2. Materials and methods
Herein, we intend to clarify the effects of DSA on the evolution of dislocations, utilizing TWIP steel as our model material due to its known susceptibility to DSA [Citation22]. In our previous investigation, this TWIP steel exhibited DSA-induced plastic instabilities during indentation over a certain range of strain rates [Citation33]. The chemical composition of the TWIP steel is Fe-12Mn-1.2C (in wt.%). A 20 kg cast was produced in a vacuum furnace, forged into a billet ingot, and subsequently hot rolled into a 4 mm thick strip at 900°C. Then, the strips were subjected to cold rolling with 50% reduction. A specimen with dimensions of 10 × 10 × 2 mm3 was cut from the cold-rolled sheet by electrical discharge machining and subjected to annealing at 1373 K for 1 h to obtain sufficiently large austenite grains for the nanoindentation tests. Specimen surface was mechanically ground with sandpapers, followed by polishing with diamond suspensions. Final polishing was conducted in a Buehler VibroMet 2 vibratory polisher using a colloidal silica suspension. X-ray diffraction (XRD) was performed using a Rigaku SmartLab diffractometer to achieve the lattice parameter for dislocation density calculation. Crystallographic orientation normal to the sample surface was determined by electron backscatter diffraction (EBSD) using a ZEISS Gemini 300 scanning electron microscope (SEM) operating at 30 kV. Several grains with the normal directions close to [001] crystal orientation were chosen to conduct nanoindentation tests by a Bruker TI980 nanoindentation system using the constant strain rate (CSR) method. The indentation strain rate is defined as: , where
is the displacement,
is the displacement rate,
is the load, and
is the load rate [Citation30,Citation37]. The load is increased at a constant value of
, thus maintaining a constant strain rate. For the TI980 system, the resolutions of displacement and load are below 0.01 nm and 1.4 µN, respectively. The frequency of data acquisition was 200 points per second. A Berkovich indenter with a half angle of 65.3o was selected for the nanoindentation tests. Thermal drift was monitored before loading and after unloading, and the measured drift rate was used to correct the displacement [Citation38]. All tests were initially performed at a strain rate of 10−1 s−1 until 20 mN and then at the strain rates of 10−3, 10−2, 10−1 and 100 s−1 till 60 mN. Microstructures beneath the indents were characterized using TEM in a Talos F200X G2 operating at 200 kV. TEM samples were fabricated using a FEI Helios 600i focused ion beam (FIB). To evaluate the dislocation densities beneath the indents at different strain rates, the TEM samples were also characterized by transmission EBSD (t-EBSD) using an Apreo2 S Lovac SEM operating at 25 kV.
3. Results and discussion
The present steel sample exhibits a single austenitic phase with a fully recrystallized microstructure (Figure (a)). The average austenite grain size is estimated to be 49.5 ± 26.1 µm according to the linear intercept method. The grain marked with a dashed circle (Figure (a)), where three indents had developed at different strain rates, was chosen for nanoindentation tests (Figure (b)). Spacings between indents are sufficiently large to avoid possible interference among them (Figure (b)). Notable serrations can be observed in the P–h curves (>20 mN) at the strain rates of 10−3 and 10−2 s−1, whereas they are substantially less at the strain rate of 10−1 s−1 (Figure (c)). The occurrence of serrations in the P-h curves indicates plastic instability which is due to DSA [Citation33,Citation34]. To further evaluate the plastic instability, a normalized displacement fluctuation factor (Δh/h) was acquired from the P–h curve (Figure (d)). The step-like serrations on the P-h curves at the strain rates of 10−3 and 10−2 s−1 can be identified by the spikes with values of Δh/h larger than 0.003. In comparison, no step-like serration was observed on the P-h curve at the strain rate of 10−1 s−1, and the values of Δh/h are below 0.003 during loading. The abovementioned observation in Figure was verified in the nanoindentation tests in other grains (Figure S1 and S2).
Figure 1. (a) EBSD inverse pole figure (IPF) of the present TWIP steel sample; lower right inset shows the XRD profile, confirming a single FCC structure. (b) SEM image of the three indents in the [001]-oriented grain; inset depicts the position for the preparation of TEM samples using FIB lift-out. (c) Load–displacement (P–h) curves of the nanoindentation tests at different strain rates; (d) plot of normalized displacement fluctuation (Δh/h) versus h; Δh represents the displacement residual between the experimental and smoothed displacement–time (h–t) curve (Figure S3).
![Figure 1. (a) EBSD inverse pole figure (IPF) of the present TWIP steel sample; lower right inset shows the XRD profile, confirming a single FCC structure. (b) SEM image of the three indents in the [001]-oriented grain; inset depicts the position for the preparation of TEM samples using FIB lift-out. (c) Load–displacement (P–h) curves of the nanoindentation tests at different strain rates; (d) plot of normalized displacement fluctuation (Δh/h) versus h; Δh represents the displacement residual between the experimental and smoothed displacement–time (h–t) curve (Figure S3).](/cms/asset/008fc34d-4d00-40da-8129-cc9f58698dcd/tmrl_a_2380101_f0001_oc.jpg)
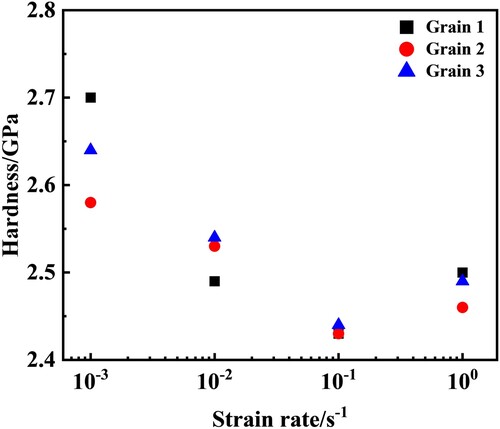
To exam the correlation between microstructural evolution and mechanical properties, three additional [001]-oriented grains were selected in the same specimen to conduct nanoindentation tests at the strain rates of 10−3, 10−2, 10−1 and 100 s−1. Notable serrations can be observed in the P–h curves of the nanoindentation tests at strain rates of 10−3 and 10−2 s−1, whereas they are substantially less pronounced at strain rates of 10−1 and 100 s−1 (Supplementary Figure S4a), consistent with our previous observations (Figure 1, S1 and S2). The relation between the hardness and strain rate is shown in Figure , with the corresponding Young’s modulus vs. strain rate plot provided in Supplementary Figure S4b. The crystal orientations of all grains used for nanoindentation tests and the measured hardness & modulus are summarized in Supplementary Table S1 and S2, respectively. The average Young’s modulus of all tests is 189.52 ± 2.89 GPa. The variation of Young’s modulus is within 5% of the average value, demonstrating the validity of nanoindentation tests. Hardness decreases with the increase of strain rate within the range of 10−3–10−1 s−1 (Figure ), showing nSRS. The rate-dependent serrated behavior and nSRS demonstrate the presence of DSA at strain rates of 10−3 and 10−2 s−1 and the absence of DSA at strain rates of 10−1 and 100 s−1.
Figure 2. The relation between the hardness and indentation strain rate.
To investigate the effects of DSA on the evolution of dislocations, the cross-sections of indents at strain rates of 10−1 and 10−3 s−1 (sampling positions in Figure (b)) were examined by TEM. Both dislocations and deformation twins are observed beneath the indents at the strain rate of 10−1 s−1 (Figure (a)). Dislocations propagate throughout the TEM sample, extending to a depth of over 9 µm (Figure (a)) and the dislocation density decreases progressively with increasing distance. Profuse dislocations and slip traces are noticed beneath the indent. Magnified views reveal entangled dislocations between slip traces (Figure (b)). Additionally, super-jogs are observed (Figure (c)), indicating the occurrence of dislocation cross-slip. Curved deformation twins are discovered on the right side of the TEM lamella (Figure (a,d,e)), which are inclined at an angle of approximately 24 degrees to the loading direction (Figure (e)). It is proposed that the interaction between twin boundaries and dislocations may have considerable influence on dislocation evolution [Citation39]. Therefore, the amounts and thicknesses of deformation twins are determined from the dark-field TEM image (Figure (e)) and summarized in Table .
Figure 3. (a) Scanning transmission electron microscopy (STEM) dark-field image of the microstructure beneath the indent at the strain rate of 10−1 s−1; lower right inset shows the selected area diffraction pattern (SADP) of the area represented by the dashed red circle. The zone axis is [0 1 1]. Twin spots and streaking lines in SADP indicate the existence of deformation twins and stacking faults. (b), (c) and (d) are the magnified images of the regions denoted by dashed rectangles in (a), revealing the presence of dislocations and deformation twins beneath the indent. (e) TEM dark-field image of the region denoted by a dashed blue rectangle in (a), demonstrating the morphologies of deformation twins.
![Figure 3. (a) Scanning transmission electron microscopy (STEM) dark-field image of the microstructure beneath the indent at the strain rate of 10−1 s−1; lower right inset shows the selected area diffraction pattern (SADP) of the area represented by the dashed red circle. The zone axis is [0 1 1]. Twin spots and streaking lines in SADP indicate the existence of deformation twins and stacking faults. (b), (c) and (d) are the magnified images of the regions denoted by dashed rectangles in (a), revealing the presence of dislocations and deformation twins beneath the indent. (e) TEM dark-field image of the region denoted by a dashed blue rectangle in (a), demonstrating the morphologies of deformation twins.](/cms/asset/ef48cf1e-4853-479f-9eb7-dcd3e52b8fcc/tmrl_a_2380101_f0003_oc.jpg)
Table 1. Characteristics of the deformation twins beneath the indents at different strain rates; Tt is the total twin thickness. Tm denotes the mean value of the thickness of each twin bundle and N is the number of twin bundles.
Figure shows the microstructure beneath the indent at a strain rate of 10−3 s−1. Dislocations can travel distances exceeding 8.5 µm (Figure (a)), analogous to the case at the strain rate of 10−1 s−1 (Figure (a)). Magnified images of the corresponding dashed areas in Figure (a) confirm the generation of dislocation tangles (Figure (b)) and the occurrence of cross-slip activities (Figure (c)), resembling the situation observed at the strain rate of 10−1 s−1 (Figure (b,c)). Deformation twins are also noticed on the right side of the TEM lamella of indent at the strain rate of 10−3 s−1 (Figure (a,d,e)), with average thickness and number of twins comparable to those at 10−1 s−1 (Table ). It is also worth noting that the alignments of deformation twins relative to the loading direction exhibit minor differences (22° and 24°) for indents made at different strain rates (Figure (e) and Figure (e)). Therefore, the alignments, quantities, and total thicknesses of deformation twins for the indents at different strain rates are rather similar (Figures 3–4 and Table ), suggesting that the influence of deformation twins on dislocation evolution can be dismissed. However, despite the similarity of deformation twins at both strain rates, their P–h curves are quite different. A higher number of serrations are evident at a slow strain rate compared to a high strain rate (Figure (c)). Therefore, it can be concluded that the formation of deformation twins is not the primary reason for the occurrence of serrations.
Figure 4. (a) STEM dark-field image of the microstructure beneath the indent at the strain rate of 10−3 s−1; lower right inset depicts the SADP of the area represented by the dashed red circle. The zone axis is [0 1 1]. Twin spots and streaking lines in SADP indicate the existence of deformation twins and stacking faults. (b), (c) and (d) are the magnified images of the region denoted by dashed rectangles in (a), revealing the presence of dislocations and deformation twins beneath the indent. (e) TEM dark-field image of the region represented by a dashed blue rectangle in (a) showing the morphologies of deformation twins.
![Figure 4. (a) STEM dark-field image of the microstructure beneath the indent at the strain rate of 10−3 s−1; lower right inset depicts the SADP of the area represented by the dashed red circle. The zone axis is [0 1 1]. Twin spots and streaking lines in SADP indicate the existence of deformation twins and stacking faults. (b), (c) and (d) are the magnified images of the region denoted by dashed rectangles in (a), revealing the presence of dislocations and deformation twins beneath the indent. (e) TEM dark-field image of the region represented by a dashed blue rectangle in (a) showing the morphologies of deformation twins.](/cms/asset/6294cc59-87a6-461e-b0d9-75f78fbeebe4/tmrl_a_2380101_f0004_oc.jpg)
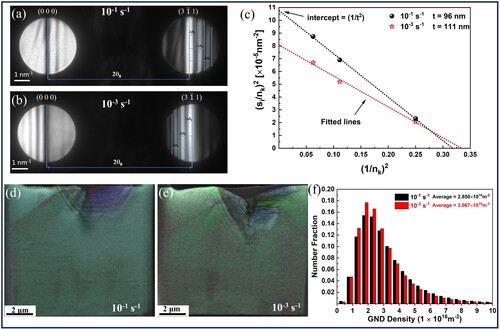
Since there are no significant differences in dislocation substructures and activities of the indents at different strain rates (Figures and ), quantitative evaluation of dislocation density becomes crucial. However, accurately measuring dislocation density is challenging due to the difficulty in resolving individual dislocation lines, especially when the dislocation density is very high beneath the indent. Additionally, the quantification of dislocation density is related to the sample thickness, which can be measured by convergent beam electron diffraction (CBED) using the Kossel–Möllenstedt (KM) fringes (Figure (a,b)) [Citation40]. The thickness of the TEM foil is extrapolated to be 96 and 111 nm for the indents at the strain rates of 10−1 and 10−3 s−1, respectively (Figure (c)). Then, t-EBSD was performed on the TEM lamellae (Figure (d,e)), densities of geometrically necessary dislocations (GNDs) were evaluated based on the kernel average misorientation (KAM). Average GND densities are estimated to be 2.85 × 10¹⁶ and 3.07 × 10¹⁶ m−2 for the indents at the strain rates of 10−1 and 10−3 s−1, respectively (Figure (f)). Therefore, the dislocation density at the strain rate of 10−3 s−1 is approximately 7.6% higher than that at the strain rate of 10−1 s−1. However, after normalizing the GND density over the sample thicknesses of TEM lamellae (Figure (c)), the dislocation density at the strain rate of 10−3 s−1 is found to be approximately 6.7% lower than that at the strain rate of 10−1 s−1. Thus, concluding that the dislocation density beneath the indent at a low strain rate (10−3 s−1) is higher than that beneath the indent at a high strain rate (10−1 s−1) is difficult. Considering the significantly higher number of serrations (DSA) in the P–h curves at 10−3 s−1 as compared to the case of 10−1 s−1 (Figure , S1 and S2), the influence of DSA on dislocation multiplication is deduced to be negligible.
Figure 5. KM fringes in CBED patterns under a two-beam condition with strongly excited for TEM lamellae of the indents at the strain rates of (a) 10−1 and (b) 10−3 s−1; (c) plot of (si/nk)2 against (1/nk)2, TEM foil thicknesses for (a) and (b) are extrapolated to be 96 and 111 nm from the intercepts of (1/t)2, respectively (Details can be found in Section 3 of Supplementary Materials). t-EBSD IPF overlapped with image quality maps of the TEM lamellae of the indents at the strain rates of (d) 10−1 and (e) 10−3 s−1; (f) corresponding statistical histograms of the GND densities of (d) and (e).
This study investigates the effects of DSA on dislocation evolution in a single austenite grain. Typically, the evolution of dislocation density during deformation is determined by the competition between dislocation generation and annihilation. Dislocation generation is inversely dependent on the dislocation mean free path [Citation41], which is the average distance between strong obstacles including forest dislocations, precipitates, grain boundaries and twin boundaries [Citation42]. Solute atoms are comparatively weaker obstacles, which enhances slip resistance without blocking dislocation motion [Citation42]. DSA induce additional slip resistance via solute segregation at dislocations [Citation43]. Here, the DSA induced slip resistance was estimated based on the measured hardness. The average hardness of the current TWIP steel increases from 2.43 to 2.64 GPa with strain rate decreases from 10−1 to 10−3 s−1 due to DSA (Figure ). According to the Tabor relation [Citation44], hardness () can be linked to flow stress (
) as:
. Besides, flow stress holds a relation with the slip resistance (
) as:
, where
is the Taylor factor equal to 3.06 [Citation45]. Using the above equations, the DSA induced hardness difference can be converted to the DSA induced slip resistance to be 23 MPa. This value is consistent with the literature that the slip resistance increment due to DSA is generally a few tens of MPa [Citation17–19,Citation22]. In this investigation, the densities of GNDs beneath the indents made at strain rates of 10−1 and 10−3 s−1 were measured to be 2.85 × 10¹⁶ and 3.07 × 10¹⁶ m−2, respectively. According to the Taylor hardening law, the slip resistance due to forest dislocations (
) can be related to dislocation density (
) as follows:
, where
represents the dislocation interaction strength,
is the shear modulus, and
is the Burgers vector. The magnitude of
for the TWIP steel in this study is determined from the XRD pattern as 0.2559 nm. Using parameters from another TWIP steel sample with a similar composition [Citation46], i.e.
= 0.136,
= 62.8 GPa, the dislocation-induced slip resistance is estimated to be 369 and 383 MPa for the abovementioned indents. Hence, the additional slip resistance owing to DSA (23 MPa) is an order of magnitude lower than that induced by forest hardening. Therefore, the effect of DSA on dislocation generation should be insignificant. According to the Kocks–Mecking model [Citation41], dislocation annihilation at room temperature is accomplished by dynamic recovery via cross-slip. DSA has been proposed to induce considerable pinning effect on dislocations and thus suppress dislocation cross-slip [Citation22,Citation24,Citation47,Citation48]. Nevertheless, this suppression effect should be minor as the additional pinning effect due to DSA is typically a few tens of MPa. Herein, the dislocation substructures beneath both indents (Figures and ) are similar, demonstrating no significant influences of DSA on dislocation cross-slip and thus dislocation annihilation. However, it should be noted that nanoindentation typically involves a more complex stress state compared to uniaxial tensile or compressive tests. Additionally, we minimize the influence of grain boundaries and crystal orientations by conducting nanoindentation experiments within single grains. Therefore, the negligible effect of DSA on dislocation evolution may be limited to the context of nanoindentation.
In brief, although DSA restrains the mobilities of dislocations, it does not considerably impact dislocation generation and annihilation during nanoindentation, leading to similar dislocation densities and substructures in the current TWIP steel sample.
4. Conclusions
In summary, this study investigates the effects of DSA on the evolution of dislocation density and substructure within single austenite grains by nanoindentation. DSA is primarily manifested as serrations in the load-displacement curves at lower strain rates (10−2 and 10−3 s−1), whereas these serrations are substantially less at a higher strain rate (10−1 and 100 s−1). The presence of DSA (serrations in P–h curves) leads to nSRS on hardness. Comprehensive characterization of the microstructures beneath the indentations was performed using both TEM and t-EBSD. Interestingly, despite variations in strain rates and DSA occurrence, no discernible differences were observed in terms of dislocation density and substructure. This observation can be explained by the fact that although DSA restrains the mobility of dislocations, it does not substantially impact dislocation generation and annihilation during nanoindentation.
Supplementary materials.docx
Download MS Word (14 MB)Acknowledgements
The authors would like to acknowledge the technical support from SUSTech Core Research Facilities.
Disclosure statement
No potential conflict of interest was reported by the author(s).
Additional information
Funding
References
- McCormick PG. The Portevin-Le Chatelier effect in an Al-Mg-Si alloy. Acta Metall. 1971;19(5):463–471. doi:10.1016/0001-6160(71)90170-2
- Yilmaz A. The Portevin-Le Chatelier effect: a review of experimental findings. Sci Technol Adv Mate. 2011;12(6):063001. doi:10.1088/1468-6996/12/6/063001
- Benallal A, Berstad T, Børvik T, et al. An experimental and numerical investigation of the behaviour of AA5083 aluminium alloy in presence of the Portevin–Le Chatelier effect. Int J Plast. 2008;24(10):1916–1945. doi:10.1016/j.ijplas.2008.03.008
- Corby C, Cáceres CH, Lukáč P. Serrated flow in magnesium alloy AZ91. Mater Sci Eng A. 2004;387-389:22–24.
- Onodera R, Ishibashi T, Era H, et al. The Portevin-Le Chatelier effects in Cu-Ti, Cu-P and Cu-Si alloys. Acta Metall. 1984;32(5):817–822. doi:10.1016/0001-6160(84)90155-X
- Banerjee S, Naik UM. Plastic instability in an omega forming Ti-15% Mo alloy. Acta Mater. 1996;44(9):3667–3677. doi:10.1016/1359-6454(96)00012-2
- Zavattieri PD, Savic V, Hector LG, et al. Spatio-temporal characteristics of the Portevin–Le Châtelier effect in austenitic steel with twinning induced plasticity. Int J Plast. 2009;25(12):2298–2330. doi:10.1016/j.ijplas.2009.02.008
- Huang C, Hu C, Liu Y, et al. Recent developments and perspectives of advanced high-strength medium Mn steel: from material design to failure mechanisms. Mater Futures. 2022;1(3):032001. doi:10.1088/2752-5724/ac7fae
- Tsai C-W, Lee C, Lin P-T, et al. Portevin-Le Chatelier mechanism in face-centered-cubic metallic alloys from low to high entropy. Int J Plast. 2019;122:212–224. doi:10.1016/j.ijplas.2019.07.003
- Brechtl J, Chen SY, Xie X, et al. Towards a greater understanding of serrated flows in an Al-containing high-entropy-based alloy. Int J Plast. 2019;115:71–92. doi:10.1016/j.ijplas.2018.11.011
- Curtin WA, Olmsted DL, Hector LG. A predictive mechanism for dynamic strain ageing in aluminium–magnesium alloys. Nat Mater. 2006;5(11):875–880. doi:10.1038/nmat1765
- Lee S-J, Kim J, Kane SN, et al. On the origin of dynamic strain aging in twinning-induced plasticity steels. Acta Mater. 2011;59(17):6809–6819. doi:10.1016/j.actamat.2011.07.040
- Picu RC. A mechanism for the negative strain-rate sensitivity of dilute solid solutions. Acta Mater. 2004;52(12):3447–3458. doi:10.1016/j.actamat.2004.03.042
- Halim H, Wilkinson DS, Niewczas M. The Portevin–Le Chatelier (PLC) effect and shear band formation in an AA5754 alloy. Acta Mater. 2007;55(12):4151–4160. doi:10.1016/j.actamat.2007.03.007
- Yu H-Y, Lee S-M, Nam J-H, et al. Post-uniform elongation and tensile fracture mechanisms of Fe-18Mn-0.6C-xAl twinning-induced plasticity steels. Acta Mater. 2017;131:435–444. doi:10.1016/j.actamat.2017.04.011
- Koyama M, Shimomura Y, Chiba A, et al. Room-temperature blue brittleness of Fe-Mn-C austenitic steels. Scr Mater. 2017;141:20–23. doi:10.1016/j.scriptamat.2017.07.017
- Canadinc D, Efstathiou C, Sehitoglu H. On the negative strain rate sensitivity of Hadfield steel. Scr Mater. 2008;59(10):1103–1106. doi:10.1016/j.scriptamat.2008.07.027
- Kim J, Estrin Y, De Cooman BC. Application of a dislocation density-based constitutive model to Al-alloyed TWIP steel. Metall Mater Trans A. 2013;44(9):4168–4182. doi:10.1007/s11661-013-1771-2
- Kim J, Estrin Y, Beladi H, et al. Constitutive modeling of the tensile behavior of Al-TWIP steel. Metall Mater Trans A. 2012;43(2):479–490. doi:10.1007/s11661-011-0898-2
- van den Beukel A. Theory of the effect of dynamic strain aging on mechanical properties. Phys Status Solidi A. 1975;30(1):197–206. doi:10.1002/pssa.2210300120
- Chen H, Chen Z, Liu J, et al. Constitutive modeling of flow stress and work hardening behavior while considering dynamic strain aging. Materialia. 2021;18:101137. doi:10.1016/j.mtla.2021.101137
- Koyama M, Sawaguchi T, Tsuzaki K. Overview of dynamic strain aging and associated phenomena in Fe–Mn–C austenitic steels. ISIJ Int. 2018;58(8):1383–1395. doi:10.2355/isijinternational.ISIJINT-2018-237
- Hutchinson B, Ridley N. On dislocation accumulation and work hardening in Hadfield steel. Scr Mater. 2006;55(4):299–302. doi:10.1016/j.scriptamat.2006.05.002
- Soares GC, Queiroz RRU, Santos LA. Effects of dynamic strain aging on strain hardening behavior, dislocation substructure, and fracture morphology in a ferritic stainless steel. Metall Mater Trans A. 2020;51(2):725–739. doi:10.1007/s11661-019-05574-6
- Koyama M, Sawaguchi T, Tsuzaki K. Inverse grain size dependence of critical strain for serrated flow in a Fe–Mn–C twinning-induced plasticity steel. Philos Mag Lett. 2012;92(3):145–152. doi:10.1080/09500839.2011.640645
- Robinson JM, Shaw MP. Microstructural and mechanical influences on dynamic strain aging phenomena. Int Mater Rev. 1994;39(3):113–122. doi:10.1179/imr.1994.39.3.113
- Mola J, Luan G, Huang Q, et al. Dynamic strain aging mechanisms in a metastable austenitic stainless steel. Acta Mater. 2021;212:116888. doi:10.1016/j.actamat.2021.116888
- Hooshmand MS, Ghazisaeidi M. Solute/twin boundary interaction as a new atomic-scale mechanism for dynamic strain aging. Acta Mater. 2020;188:711–719. doi:10.1016/j.actamat.2020.01.066
- Cheng X-M, Morris JG. The anisotropy of the Portevin-Le Chatelier effect in aluminum alloys. Scr Mater. 2000;43(7):651–658. doi:10.1016/S1359-6462(00)00474-7
- Peng XX, Wang LY, Xu W, et al. Crystal orientation dependence of the Portevin–Le Chatelier effect in instrumented indentation: a case study in twinning-induced plasticity steels. Metals (Basel). 2022;12(3):439. doi:10.3390/met12030439
- Seo EJ, Kim JK, Cho L, et al. Micro-plasticity of medium Mn austenitic steel: perfect dislocation plasticity and deformation twinning. Acta Mater. 2017;135:112–123. doi:10.1016/j.actamat.2017.06.014
- Durst K, Maier V. Dynamic nanoindentation testing for studying thermally activated processes from single to nanocrystalline metals. Curr Opin Solid State Mater Sci. 2015;19(6):340–353. doi:10.1016/j.cossms.2015.02.001
- Peng XX, Wang LY, Xu W, et al. Correlations between the plastic instabilities occurring in indentation and the Portevin Le-Chatelier effect in uniaxial tension. Mater Sci Eng A. 2022;854:143799. doi:10.1016/j.msea.2022.143799
- Chinh NQ, Gubicza J, Kovács Z, et al. Depth-sensing indentation tests in studying plastic instabilities. J Mater Res. 2004;19(1):31–45. doi:10.1557/jmr.2004.19.1.31
- Chinh NQ, Horváth G, Kovács Z, et al. Kinematic and dynamic characterization of plastic instabilities occurring in nano- and microindentation tests. Mater Sci Eng A. 2005;409(1):100–107. doi:10.1016/j.msea.2005.04.057
- Bérces G, Chinh NQ, Juhász A, et al. Kinematic analysis of plastic instabilities occurring in microhardness tests. Acta Mater. 1998;46(6):2029–2037. doi:10.1016/S1359-6454(97)00428-X
- Lucas BN, Oliver WC. Indentation power-law creep of high-purity indium. Metall Mater Trans A. 1999;30(3):601–610. doi:10.1007/s11661-999-0051-7
- Verma S, Sarkar P, Pant P. Thermal drift in room temperature nanoindentation experiments: Measurement and correction. J Mater Res. 2021;36(17):3436–3444. doi:10.1557/s43578-021-00386-0
- Shang XK, Guan QW, He BB. Enhanced strain hardening induced by twin boundary-dislocation interaction in micro-pillar compression of CoCrNi medium-entropy alloy. Materialia. 2022;24:101491. doi:10.1016/j.mtla.2022.101491
- Williams DB, Carter CB. Transmission electron microscopy. New York: Springer; 2009.
- Kocks UF, Mecking H. Physics and phenomenology of strain hardening: the FCC case. Prog Mater Sci. 2003;48(3):171–273. doi:10.1016/S0079-6425(02)00003-8
- Messerschmidt U. Dislocation kinetics, work-hardening, and recovery. In: Hull R, Jagadish C, Kawazoe Y, et al., editors. Dislocation dynamics during plastic deformation. Berlin: Springer; 2010. p. 155-201.
- Mulford RA, Kocks UF. New observations on the mechanisms of dynamic strain aging and of jerky flow. Acta Metall. 1979;27(7):1125–1134. doi:10.1016/0001-6160(79)90130-5
- Pharr GM, Herbert EG, Gao Y. The indentation size effect: a critical examination of experimental observations and mechanistic interpretations. Annu Rev Mater Res. 2010;40:271–292. doi:10.1146/annurev-matsci-070909-104456
- Liang ZY, Wang X, Huang W, et al. Strain rate sensitivity and evolution of dislocations and twins in a twinning-induced plasticity steel. Acta Mater. 2015;88:170–179. doi:10.1016/j.actamat.2015.01.013
- Liang ZY, Li YZ, Huang MX. The respective hardening contributions of dislocations and twins to the flow stress of a twinning-induced plasticity steel. Scr Mater. 2016;112:28–31. doi:10.1016/j.scriptamat.2015.09.003
- Luo ZC, Huang MX. Revisit the role of deformation twins on the work-hardening behaviour of twinning-induced plasticity steels. Scr Mater. 2018;142:28–31. doi:10.1016/j.scriptamat.2017.08.017
- Luo ZC, Huang MX. The role of interstitial carbon atoms on the strain-hardening rate of twinning-induced plasticity steels. Scr Mater. 2020;178:264–268. doi:10.1016/j.scriptamat.2019.11.047