
 ?Mathematical formulae have been encoded as MathML and are displayed in this HTML version using MathJax in order to improve their display. Uncheck the box to turn MathJax off. This feature requires Javascript. Click on a formula to zoom.
ABSTRACT
In this study, dynamical pseudo-global-warming downscaling (d-PGWD) was performed with a high-resolution typhoon model for 49 typhoons that made landfall in Japan between 2000 and 2017. It was revealed that the averaged typhoon intensity under future climatic conditions tends to increase at both the peak and landfall times as a result of global warming (averaged central pressures of −45.7 and −5.5 hPa at peak and landfall, respectively). Furthermore, detailed analyses of the time of landfall revealed significant differences in the degree of future changes in typhoon intensity based on both the elapsed time from the genesis to landfall (Tl) and the radius of maximum wind speed (Rml) at the time of landfall. Considering the relationships of Tl and Rml between present and future climates, statistical formulas for future changes in the central pressure and Rml were derived as an empirical PGWD (e-PGWD) method. The validity of this method was confirmed via comparison with d-PGWD results. It is expected that disaster prevention and mitigation measures for future typhoons and coastal disasters in individual regions and ports can be developed by revising storm surge hazard maps using the proposed e-PGWD approach.
1. Introduction
According to the Intergovernmental Panel on Climate Change (IPCC) Fifth Assessment Report (IPCC Citation2013a), the characteristics (e.g. intensity and frequency) of tropical cyclones (i.e. typhoons, hurricanes, and cyclones) under future climatic conditions are likely to change from those observed in the present climate, and global warming will likely reduce the frequency of tropical cyclones throughout the world. Furthermore, the frequency and intensity of extreme tropical cyclones is likely to increase as a result of increasing air temperature (AT), sea surface temperature (SST), and ocean heat storage (Murakami et al. Citation2012; Knutson et al. Citation2015). Based on the numerical simulation performed using the Meteorological Research Institute Atmospheric General Circulation Model (MRI-AGCM), (Murakami et al. Citation2012) conducted a future-climate experiment for the period of 2075–2099 assuming the Special Report on Emission Scenarios (SRES) A1B scenario in Coupled Model Intercomparison Project, Phase 3 (CMIP3). The MRI-AGCM indicated that the frequency of tropical cyclones will decrease by 13%–25% globally, whereas the intensity will increase by 1%–7%. Knutson et al. (Citation2015) performed dynamical downscaling for tropical cyclones that occurred globally between 1980 and 2008 using the Geophysical Fluid Dynamics Laboratory (GFDL) hurricane model with 13 general circulation models (GCMs) under the Representative Concentration Pathway 4.5 (RCP4.5) scenario in Coupled Model Intercomparison Project, Phase 5 (CMIP5). The GFDL hurricane model predicted that, at the end of the 21st century, the tropical-cyclone frequency will decrease by 16% whereas the intensity will increase, thereby leading to a 24% increase in tropical cyclones reaching category 4 or 5. However, it has been pointed out that the tendency differs depending on ocean basins, and therefore, the impact of global warming on typhoons, hurricanes, or cyclones cannot be discussed together.
The ongoing global warming is already affecting typhoon characteristics (Webster et al. Citation2005). One of the most prominent examples of recent typhoons affected by global warming is Typhoon Haiyan (2013), which struck Central Philippines in November 2013. Haiyan caused a storm surge exceeding 6 m in Tacloban located behind the Bay of San Pedro, and there was an unprecedented catastrophe that resulted in total damages of approximately 571.1 billion pesos (US $12.9 billion), 6201 deaths, and 1785 missing persons (NDRRMC Citation2014). Takayabu et al. (Citation2015) employed the Weather Research and Forecasting (WRF) model as a regional climate model (RCM) to evaluate the future change of Haiyan based on dynamical pseudo-global-warming downscaling (d-PGWD) experiments. d-PGWD is well known simplified method for assessing the effects of global warming using monthly mean differences between the future and present climates derived from CO2-warmed GCMs (Sato, Kimura, and Kitoh Citation2007). As the SST around the Philippines increased by 0.2–0.8 K because of global warming, Haiyan would be more intense under future climatic conditions, and the associated storm surge increased by approximately 20%. The storm surge disaster caused by Haiyan is now considered one of the worst typhoon disasters affected by global warming. For other typhoon cases, Yoshino et al. (Citation2015) performed d-PGWD experiments for all typhoons that landed in 2004 targeting the end of the 21st century under the SRES A2/A1B/B1 scenarios, and they evaluated the differences in global warming effects on typhoon intensity among different scenarios. They clarified that typhoon intensities at peak times tend to increase on average in proportion to the degree of global warming. For the SRES A2 scenario, in which there is significant warming, “weak” and “strong” typhoons in the present climate are expected to strengthen considerably in the future. In contrast, the intensification of “furious” typhoons in the present climate, which develop to reach the potential intensity (Emanuel Citation1988), will be suppressed by stratification stabilization in the troposphere. Tsuboki et al. (Citation2015) conducted dynamical direct downscaling (d-DD) experiments on 30 strong typhoons that landed in the period of 1979–1993 assuming the SRES A1B scenario using an RCM. According to those simulations, the lowest central pressure at the end of the 21st century was obtained as 857 hPa. Kanada et al. (Citation2017) also performed d-PGWD experiments on Typhoon Vera (Citation1959), which caused the worst damage (over 5000 deaths and missing persons in total) by a storm surge around Ise Bay, Japan, considering future global warming at the end of the 21st century under the RCP8.5 scenario. They found that future global warming alters the inner-core structure (e.g. eye-wall heights and upward flows) as well as the intensity of the typhoon. The mid-latitude SST near the Japan Islands is expected to rise in the future climate, and typhoons stronger than the present climate will make landfall while maintaining their intensity.
Based on statistics reported by the Japan Meteorological Agency (JMA), Japan is the third-most typhoon-prone country in Asia, with 11.5 typhoons approaching and 2.9 directly impacting the main Island each year (JMA Citation2018). Therefore, accurate assessments of the impact of global warming on landfalling typhoons and their associated coastal disasters are necessary when establishing disaster prevention and mitigation measures for mid- to long-term expected storm surges. Recently, various studies have been conducted to assess future changes in the typhoon-associated storm surges in Japan under the future climate (Yasuda et al. Citation2014; Mori and Takemi Citation2016). Yasuda et al. (Citation2014) investigated future typhoon intensity at the landfall time to Japan using a CO2-warmed GCM at the end of the 21st century under the SRES A1B scenario. They reported that the possibility of intense typhoons with central atmospheric pressure lower than 930 hPa will increase by a few percentages in the future climate, and the maximum storm surge will increase by 0.5–1.0 m in Ise Bay. Mori and Takemi (Citation2016) evaluated future changes in the typhoon intensity of Typhoon Vera (Takemi, Ito, and Arakawa Citation2016) using d-PGWD assuming the RCP8.5 scenario at the end of 21st century. In their work, calculations were performed for five cases, with the calculation start time being altered by 12 h intervals. They reported that the averaged central pressure of typhoons in the future climate projections tended to decrease by −14.1 hPa at the peak time, and the resulting storm surge tended to increase by 1.0–1.3 m. Thus, they concluded that strengthened typhoons under the future climate may cause more severe wind-related and coastal disasters such as high waves and storm surges along the Pacific coast in Japan.
In storm surge inundation estimations performed by local governments in Japan, an empirical typhoon model (e.g. Mitsuta and Fujii Citation1987) is used for calculations of the typhoon meteorological fields because of its low calculation costs (Aichi Prefecture Citation2014; Tokyo Metropolitan Government Citation2018). The empirical typhoon model can estimate the internal structure of a typhoon using a small number of typhoon attribute values. Most typhoon attribute values (e.g. center position, central pressure, movement speed, and maximum wind speed radius) required for the empirical typhoon model can be obtained from observations, such as JMA Best Track, or simulations, such as low-resolution GCMs. The accuracy of the meteorological fields in a typhoon can be improved by using observations as input parameters. However, the problem is that the effects of global warming in the future climate never be considered. Although the effects of global warming can be considered using GCMs as input parameters, the intensity and structure of typhoons cannot be well represented because of their low resolution. Therefore, local governments are forced to estimate potential storm surges using observations of the central pressure at landfall (e.g. 911.6 hPa for Typhoon Muroto (1961)) and the maximum wind speed radius at landfall (e.g. 75 km for Typhoon Vera (1959)) of prominent typhoons that have occurred in the past. Although the use of such a historical record incurs a considerably low computational cost, there is a concern that it is unlikely to reflect the effects of global warming in the future climate adequately, thereby leading to the unexpected errors.
In this study, d-PGWD experiments were conducted using a high-resolution typhoon model (HTM) for a total of 49 typhoons that made landfall in Japan between 2000 and 2017. The target typhoons have various characteristics. The HTM is an RCM modified for typhoon intensity predictions (Yoshino et al. Citation2015). The d-PGWD method employed in this study assumes a future climate at the end of the 21st century (2080–2099) under the RCP 8.5 scenario. This study aims to construct a high-resolution typhoon database under the present and future climates, and to understand the characteristics of future changes in the intensities (central pressures) of typhoons that will make landfall at the Pacific coast in Japan. In addition, another aim of this study was to develop an empirical PGWD (e-PGWD) method for port managers and practitioners, based on a high-resolution typhoon database. e-PGWD is an effective method that enables future climate experiments (at the end of 21st century, under the RCP8.5 scenario) without the need to use items affected by climate change (e.g. AT and SST). Therefore, we aimed to develop a low-cost method that can be used even by non-experts. Many studies relating to climate change impact assessments typically focus on “the end of the 21st century in RCP8.5,” which is of most interest to policy makers discussing future global warming adaptation. Therefore, this study also focuses on the end of the 21st century in RCP8.5. It is inferred that the results would differ for different emission scenarios and different ages. There are two main approaches for calculating future typhoon intensity. The first approach, d-PGWD, is a dynamical method of inputting future parameters affected by climate change, such as SST and AT, and performing calculations with a numerical model. The second approach, e-PGWD, is an empirical method of estimating the future typhoon intensity from the information of values under the present climate.
The remainder of this paper is organized as follows. Section 2 describes the computational method along with the details of the HTM and d-PGWD method used in this study. The characteristics of typhoons under the present and future climates obtained from the high-resolution typhoon database during the period 2000–2017 are discussed in Section 3. In Section 4, e-PGWD on storm surge under the future climate considering future changes in the typhoon intensity at landfall in Japan estimated by the high-resolution typhoon database is proposed. By applying the e-PGWD method to the three typhoons that made landfall in 2018, future storm surges that can occur at Ise Bay and Osaka Bay under the future climate are evaluated and verified via d-PGWD experiments. Finally, in Section 5, we conclude the paper by summarizing the findings obtained through this study.
2. Computational method
2.1. High-resolution typhoon model
The HTM is a type of RCM used in this study for reproducing intensity changes from the genesis to the dissipation stages for target typhoons (Yoshino, Strachan, and Vidale Citation2012; Yoshino et al. Citation2015). The HTM is based on the Pennsylvania State University (PSU)/National Center for Atmospheric Research (NCAR) The Fifth-Generation Mesoscale Model (MM5) (Dudhia Citation1993), and it is a three-dimensional, nonhydrostatic, fully compressible, cloud-resolving atmospheric model used to capture mesoscale and local-scale meteorological phenomena.
The automatic movable nesting technique is introduced to MM5 to reproduce the inner-core structure near the center of a powerful typhoon, from the genesis to dissipation stages, efficiently. In addition, several types of physical parameterizations are incorporated into the original MM5. In particular, the ocean mixed layer (Shade Citation1999; Emanuel et al. Citation2004), dissipative heating (Bister et al. Citation1998; Zhang et al. Citation1999), and sea-spray processes (Fairall, Kepert, and Holland Citation1994; Wang, Kepert, and Holland Citation2001) are implemented to express realistic typhoon intensity and structural characteristics accurately. The ocean mixed layer process is introduced to express the vertical turbulent mixing that occurs in the ocean mixed layer just below the strong winds in typhoons, which can lead to a large SST drop for a slow-moving typhoon. The climatological mean (monthly average) of the ocean mixed layer thickness provided by the National Oceanographic Data Center of the National Oceanic and Atmospheric Administration (NOAA; Monterey et al. 1997) is used as an initial condition of the ocean mixed layer process. Next, the dissipative heating process, which typically occurs in the typhoon boundary layer, is introduced to reflect the effect of diabatic heating caused by viscous dissipation under the strong winds in typhoons. Finally, the sea-spray process that performs the lower atmosphere cooling and wetting because of sea-spray evaporations is introduced in addition to evaporation from the flat ocean surface just below the typhoon.
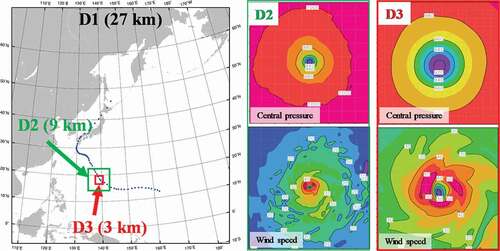
Previous studies (Yoshino et al. Citation2015; Toyoda, Yoshino, and Kobayashi Citation2015, Citation2016, Citation2017) have confirmed the high accuracy of HTM ranging from a weak typhoon to a powerful typhoon. Yoshino et al. (Citation2015) performed reproduction experiments for all typhoons in 2004 with a 3 km grid spacing for automatic movable nesting. In their study, the root mean square error of the minimum typhoon pressure was 15.1 hPa, and the correlation coefficient was as high as 0.78. Toyoda, Yoshino, and Kobayashi (Citation2015) conducted a reproduction experiment for Typhoon Haiyan (2013) and its storm surge. The observed minimum central pressure was 895 hPa, whereas the calculation result was 897.1 hPa; they succeeded in reproducing a furious intensity below 900 hPa by adding a 3 km grid spacing in addition to the 9 km grid spacing for automatic movable nesting. In this study, triply nested computational domains D1, D2, and D3 are also employed, and they have horizontal grid spacings of 27, 9, and 3 km, respectively. The movable nesting technique is applied to D2 and D3 to represent the inner-core structure and its intensity from the genesis to the dissipation stage with high accuracy (). A four-dimensional data assimilation technique (so-called “analysis nudging”) is utilized for only D1, to assimilate the gridded analyses into the typhoon environmental fields gradually. Typhoon tracks are reproduced with high accuracy by applying analysis nudging; however, analysis nudging is not applied to D2 and D3 because the internal structure and intensity of the typhoon can be expressed only by dynamical and physical processes in the HTM. The analysis nudging, which relaxes the model state toward gridded analysis data, is applied to D1 in the high-resolution typhoon model used in this study. Therefore, the chaotic evolution of initial perturbations seen in ordinary forecasting experiments should be suppressed. Rankine’s vortex, with a wind speed 17.2 m/s, was installed as a TC bogus at the initial position of each typhoon. The other calculation settings are summarized in .
Table 1. Computational settings of high-resolution typhoon model (HTM)
Figure 1. Computational domain for the high-resolution typhoon model (HTM) with the sample track of Typhoon CHABA (2004). Black, blue, and green squares are D1, D2, and D3 domains, respectively. The figures on the top right show the horizontal distributions of Pc calculated in D2 and D3 (contoured at every 20 hPa). The figures on the bottom right show the horizontal distributions of wind speed at a 10 m height calculated in D2 and D3 (contoured at every 10 m/s).
2.2. Present-climate and future-climate experiments
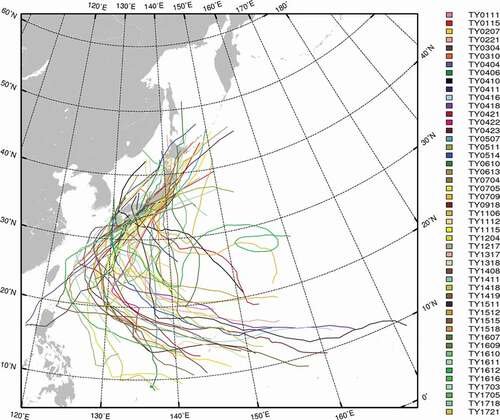
In this study, numerical experiments for typhoons under the present and future climates are performed using the above HTM according to the calculation flow shown in . First, as present-climate experiments, reproduction experiments are performed to confirm the reproducibility of landfalling typhoons in the present climate. The parameters used for the initial and boundary conditions are temperature, geopotential height, east-west wind velocity, north-south wind velocity, relative humidity, sea-level pressure, and skin temperature obtained from the National Centers for Environmental Prediction (NCEP) Final Analyses (FNL). According to the JMA’s record (JMA Citation2018), 53 typhoons during the period 2000–2017 that made landfall in Japan are selected as the typhoon cases targeted in this study. However, three typhoons – Typhoons Megi (2004), Dianmu (2010), and Malou (2010) – are eliminated because they show irregular tracks making landfall on the Tohoku region from the Sea of Japan. In addition, Typhoon Chataan (2002) is also removed from the discussion because it is difficult to calculate its entire lifetime using the HTM. Note that Typhoon Chataan is a case where the typhoon structure at the time of genesis could not be properly captured in the NCEP FNL, used as the initial conditions. Therefore, a total of 49 cases are considered in the present-climate experiments (). Further, the initial time for all experiments was set at a time when the maximum wind speed exceeded approximately 17.2 m/s, which is defined as “typhoon” in the JMA Best Track data (). The end time for the all experiments is set at a time when the “typhoon” changed to a “tropical depression” or “extratropical cyclone” in the JMA Best Track data.
Figure 2. Computational flow for the pseudo-global warming downscaling experiment (PGWD) method. The left, middle, and right columns show the flows of the present-climate experiment, future-climate experiment, and horizontal resolution at each calculation step, respectively.
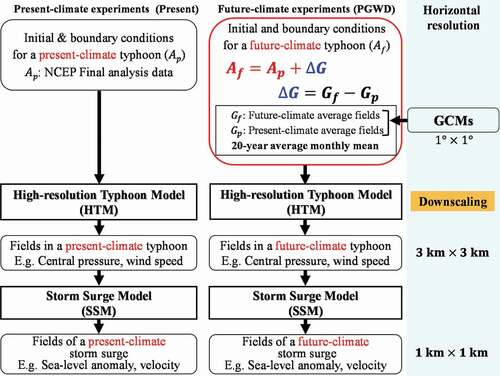
Figure 3. Observed tracks of target typhoons from genesis to decay, according to the JMA best track.
Furthermore, future-climate experiments for these 49 cases are performed by applying the d-PGWD method, and future changes are estimated by comparing the results with those of the present-climate experiments. The d-PGWD method is a type of dynamical downscaling technique that considers the expected climate change (Kimura and Kitoh 2007; Sato, Kimura, and Kitoh Citation2007; Hara et al. 2008; Kawase et al. 2009; Yoshino et al. Citation2015). The d-PGWD method was first used in Japan, and similar methods have been used in other countries (Knutson et al. 2008). This approach is different from the d-DD method, which uses the data obtained from GCMs directly; instead, the d-PGWD method uses the differences in monthly mean fields between the present and future climates, averaged from GCMs. Hence, the main advantage is that it avoids serious bias errors in GCMs, which are caused by biases in the initial and boundary conditions (Kimura and Kitoh 2007). Biases in GCMs, used to drive an RCM, are one of the largest uncertainties in dynamical downscaling (Sato, Kimura, and Kitoh Citation2007). As the d-PGWD method is based on specific weather events that occurred in the past, one-to-one relationships between the present and future climate experiments can be drawn easily. Furthermore, as data handling is easier for the d-PGWD method than for the d-DD method, the ensemble average fields obtained from multiple GCMs can be inputted as the monthly mean differences and the variability of the monthly mean differences in each GCM can be reduced (Sato Citation2010). Hara et al. (2008) verified the d-PGWD approach using historical data, and the precipitation, snow depth, and surface air temperature of the hindcast experiments agreed well with the observation data. Kawase et al. (2009) applied the d-PGWD approach to estimate the change in the Baiu rain band caused by global warming. The results demonstrated that the d-PGWD run has a good similarity to the average of the d-DD runs by seven GCMs. Their results indicated that the d-PGWD can calculate consistent results with d-DD, using the multi selected GCM ensemble mean, thereby reducing the significant computational cost. Next, the limits of d-PGWD are described.
Although the effect of a future change in the mean fields can be assessed by d-PGWD, the effect of a future change in the anomalous fields cannot be assessed because of the limitations of d-PGWD. In this method, an effect of global warming is considered only in a 20-year time-averaged change component, and its anomalous component is assumed to be the same as the present climate. Essentially, it is assumed that the anomalous fields in the future climate will be fixed to the state under the present climate. Therefore, the typhoon tracks in the future-climate experiments, which might be affected by the anomalous fields, are assumed to be the same as those of the present-climate experiments. The calculation end time of the future climate experiments is also set to the same time as the present climate experiments.
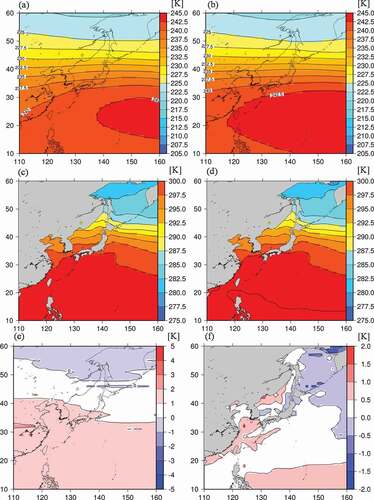
The initial, boundary, and assimilation conditions for the future-climate experiments are established by adding the differences of monthly mean fields (∆G) obtained by GCMs to those for the present-climate experiments obtained by NCEP FNL (Af in ). The differences of monthly mean fields ∆G are defined as the differences of the 20-year average fields in the 2-D surface (i.e. sea surface temperature and sea level pressure) and the 3-D atmospheric variables (i.e. SST, sea level pressure, temperature, geopotential height, east-west wind speed, north-south wind speed, and relative humidity from 1000 to 70 hPa) between the future climate (2080–2099) and the present climate (2000–2019). The ocean mixing layer depth is fixed at the same conditions as the present climate without considering future changes, because many models lack public access to the data of the mixed layer depth in both climates. Here, the maximum value of relative humidity is fixed at 100%. When the relative humidity exceeds 100% as a result of adding a global warming difference, the specific humidity field is computed by the Clausius–Clapeyron equation in which the “saturated” specific humidity depends on temperature and pressure. In this study, the future climate fields are assumed as the ensemble monthly mean fields averaged during the period of 2080–2099 by eight GCMs for the RCP8.5 scenario in CMIP5. There are systematic errors across the eight GCMs used in this study. Therefore, ensemble-averaged data is used for the reduction of these errors. RCP8.5 is a high-level reference scenario that assumes there is no mitigation policy (Moss et al. Citation2010). The present climate fields are defined as the ensemble monthly mean fields averaged during the period of 2000–2019 by 15 GCMs for the historical scenario (2000–2005) and eight GCMs for the RCP8.5 (2006–2019), as listed in . The GCMs are selected because they contain all necessary variables at the necessary altitude during the necessary period. In order to estimate the global warming differences for PGWDs, the future-climate fields are calculated from the monthly mean fields of “8 future-climate (RCP8.5) GCMs for the period 2080–2099.” Then, the present-climate fields are also derived from the monthly mean fields of “8 future-climate (RCP8.5) GCMs for the period 2006–2019.” This means that even the future-climate GCMs cover a major part of the “present-climate” period 2000–2019, which is defined by this study. Unfortunately, the 8 future-climate GCMs in CMIP5 do not include any data for the period 2000–2005. To adjust to the 2000–2019 period for the typhoons targeted in this study, it is reasonable to use the present-climate fields modified by the 15 historical GCMs in CMIP5 for the period 2000–2005 (). As the modification is performed by weighted averaging according to the length of the data periods (6 years for historical GCMs and 14 years for RCP8.5 GCMs), the procedure should not significantly change the monthly mean fields obtained by the 8 future-climate GCMs and should not pose major problems. Here, we check the continuity between ensemble mean fields obtained from GCMs under different scenarios. and c show the monthly mean fields of the air temperature at 300 hPa and sea surface temperature for the period 2000–2005, whilst and d show the same information for the period 2006–2019. and f show the differences of the monthly means fields, both of which are not significantly different. Therefore, we did not determine any serious problems in the continuity between the two different data sets. Using the initial, boundary and assimilation conditions added by ∆G, the future-climate experiments are conducted for a total of 49 cases, where the other computational settings are identical to the present climate experiments.
Table 2. List of general circulation models (GCMs) used for pseudo-global warming downscaling experiments (PGWDs). The (a) historical and (b) RCP8.5 data were obtained from 15 and 8 GCMs, respectively, in the Coupled Model Intercomparison Project 5 (CMIP5) (IPCC, Citation2013). These GCMs shown in table (a) are used for creating that data period of 2000–2005 from the historical of CMIP5, the GCMs in table (b) are used for creating that data period of 2006–2019 and 2080–2099. Global warming difference in present-climate is created by weighted averaging according to the length of the data periods (6 years for historical GCMs and 14 years for future GCMs)
Figure 4. Differences in the time periods covered by GCMs in CMIP5 and PGWDs in this study, and their respective definitions of “present climate” and “future climate” (modified from Figure SPM. 7 in IPCC AR5 WG1 (Intergovernmental Panel on Climate Change, Fifth Assessment Report, Working Group I. 2013. “Summary for policymakers.” in Climate Change 2013: The Physical Science Basis, edited by the Intergovernmental Panel on Climate Change. https://www.ipcc.ch/report/ar5/wg1/summary-for-policymakers/). This study defines 2000–2019 as the present climate and 2080–2099 as the future climate. As the defined period of this study is different from that of CMIP5 GCMs, it is adjusted when calculating the global warming difference (IPCC, Citation2013b).
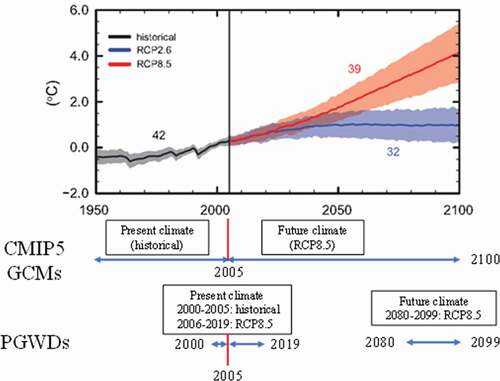
Figure 5. Distribution for continuity among GCM data used in this study. Ensemble mean distribution of temperature at 300 hPa for (a) 2000–2005 and (b) 2006–2019. The contours are drawn every 2.5 K. Ensemble mean distribution of SST for (c) 2000–2005 and (d) 2006–2019. The contours are drawn every 2.5 K. Differences in ensemble mean of (e) air temperature at 300 hPa and (f) SST from 15 GCMs in 2000–2005 and 8 GCMs in 2006–2019. The contours are drawn every 1.0 K (air temperature) and 0.5 K (SST).
2.3. Analysis method for present- and future-climate experiments
Future changes in the intensities of typhoons making landfall in Japan are analyzed using a high-resolution typhoon database (D3 in HTM recorded every 15 min) constructed using the results of the present-climate and future-climate experiments described in the previous section. In particular, the central pressure and maximum wind speed radius are the focus of this analysis. Central pressure is widely used as an index of typhoon intensity. However, the radius of maximum wind speed is a meteorological parameter required for storm surge estimation and is an important parameter for evaluating future changes in typhoon characteristics. The minimum value point of the sea level pressure is defined as the center of a typhoon. The central sea level pressure at the center of the typhoon is determined as Pc, and the distance from the center of typhoon to the point at which the maximum wind speed is at a 10-m altitude is regarded as Rm. However, the output values of Pc and Rm considerably fluctuate over time, and therefore, we analyze the values averaged over a 6-h period, which is the same as the time interval of the JMA Best Track.
To confirm the reproducibility of typhoons in the present climate experiments, the accuracies of Pc and Rm for all 49 typhoons were verified using the available observations. For the verification of Pc, the values obtained from JMA Best Track data are used. In contrast, Rm is not officially recorded in the JMA Best Track data, and therefore, this parameter is indirectly estimated using the Myers equation (Myers Citation1954)
where P (r) is the atmospheric pressure (hPa) at a point r km from the typhoon center, Pc is the typhoon central pressure (hPa), ∆P is the pressure drop at the typhoon center from the standard atmospheric pressure (here, this value was calculated as 1013 − Pc), and r is the distance (km) between the typhoon center and the observation points. EquationEquation (1)(1)
(1) is rearranged as follows to obtain Rm.
Thus, Rm can be estimated from the observed Pc and values at the time of typhoon landfall. In EquationEq. (2
(2)
(2) ),
is the sea-level pressure measured at the JMA observatories located at a distance of r from the typhoon center. As Rm is noted to have relatively large errors (Takagi et al. Citation2015), the Rm values averaged by the three meteorological stations closest to the center of the typhoon were adopted for validation. The Rm is only evaluated for land because Rm cannot be calculated over the ocean as there are no meteorological stations. In this manuscript, Pc and Rm of the typhoons are also simulated by the meteorological model. However, as the main focus of this manuscript is on the future changes in typhoon intensity, a detailed discussion of the future changes in Rm is omitted.
3. Results and discussion
3.1. Present-climate experiments
First, to confirm the validity of the HTM, the accuracy of the Pc and Rm values reproduced by the present-climate experiments are verified. The lifetime of a “typhoon” differs according to the individual case. For the observations, the Pc values averaged for all cases were 945.1 and 969.6 hPa at peak and landfall times, respectively. For the estimations, the averaged Pc values at the peak and landfall were 946.2 and 965.8 hPa, respectively. Thus, HTM can reproduce the overall intensity changes throughout the lifetimes of typhoons, regardless of their intensity. For example, Typhoon Vongfong (2014), which had the strongest intensity at peak time among the 49 cases, had an observed value of 900 hPa in good agreement with an estimated value of 902.7 hPa. The strongest values at landfall time were observed for Typhoons Songda (2004) and Man-Yi (2007); the observed Pc values were 945 hPa for both cases, and the estimated values were 936.5 and 947.9 hPa, respectively. Thus, the HTM employed in this study has sufficient resolution and performance to reproduce the intensities of the typhoons at their peak and landfall times adequately.
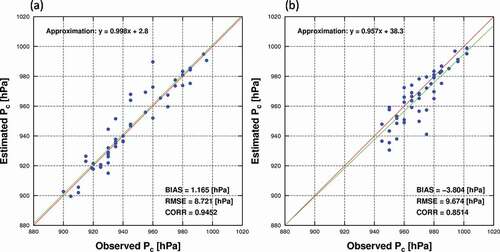
are scatter diagrams of Pc between the JMA Best Track data (observations) and HTM (estimations) at the peak and landfall times, respectively. At the peak times of the typhoons, the bias error is 1.17 hPa, the root mean square error (RMSE) is 8.72 hPa, and the correlation coefficient is 0.945; thus, the typhoon intensity at the peak times can be reproduced by HTM with high accuracy. At the landfall times, the bias error is −3.80 hPa, the RMSE is 9.67 hPa, and the correlation coefficient is 0.851, which is inferior to the peak value; however, there is no significant bias error in the HTM that should be considered in the analysis in the following sections, and it can be considered that the mean properties of Pc at the landfall times can be accurately reproduced overall. The variance between the estimations and observations is likely to be greater at the landfall times than at the peak times because the typhoon intensity changes drastically at the landfall times.
Figure 6. Scatter diagrams of central pressure (Pc) at (a) peak and (b) landfall times for observed (JMA best track) and estimated (HTM) typhoons.
As Rm can only be estimated at the landfall times for which observations for the sea level pressure are available, we discuss only the results at the landfall times. The mean values of the observed Rm and estimated Rm at the landfall times in all cases were found to be 89.5 and 101.4 km, respectively. The general trend is that Rm decreases from the genesis to the peak and then increases again during the dissipation (extratropical transition); there is a positive (negative) correlation between the change in Pc (Vm) and the change in Rm, indicating that Rm tends to decrease as the typhoon strength increases. This trend is consistent with that observed in the earlier studies (Colon Citation1963; Shea and Gray Citation1973). Consequently, one can say that the HTM used in this study can reproduce not only the intensity of a typhoon but also its structure with high accuracy.
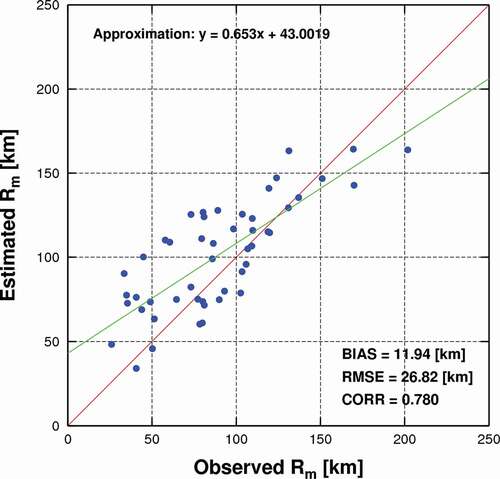
is a scatter diagram of Rm between the observations obtained using the Myers equation EquationEq. (2)(2)
(2) and the estimations obtained using the HTM. The estimated Rm at the landfall times has an accuracy with a bias error of 11.9 km, an RMSE of 26.8 km, and a correlation coefficient of 0.780; the RMSE is not negligible. As a previous study confirmed that Rm has a very large temporal variability (Takagi et al. Citation2015), this can account for the large dispersion (RMSE) between the estimations and observations. However, the systematic bias error is relatively small, which implies that the overall structure in typhoons at the landfall times can be reasonably captured. The abovementioned verification shows that the HTM can accurately representing both the strength and structure of typhoons simulated in the present-climate experiments. Therefore, the results obtained in the future-climate experiments based on the d-PGWD method in the next section can be regarded as reliable to some extent at the peak and landfall times.
Figure 7. Scatter diagram of the radius of the maximum wind speed (Rm) at landfall time for observed (Myers Citation1954) and estimated (HTM) typhoons.
3.2. Future-climate experiments
As explained in Section 2.2, we assume that the tracks of typhoons in the future climate will not differ from the present climate, because of the limitations of the d-PGWD method.
According to the results of simulations, Typhoon Namtheun (2004) in the future climate is particularly strong, with Pc values of 850.4 and 905.1 hPa at the peak and landfall times, respectively. The differences in the estimated Pc between the present and future climates are −101.1 and −59.9 hPa at the peak and landfall times, respectively. This future change is the largest among all cases, both at the peak and landfall times. The average Pc for all 49 cases at the peak times is 900.5 hPa in the future climate, which is significantly lower than 946.2 hPa obtained from the present climate. For the average Pc at the peak times, there is a significant difference between the present and future climates at a significance level of 5% (one-sided test). With respect to the landfall times, the average Pc for the future climate is 960.3 hPa, which is lower than the average Pc, 965.8 hPa, for the present climate. For the average Pc at the landfall times, there is no significant difference between the present and future climates at a significance level of 5% (one-sided test). The future changes in Pc are reduced by −45.7 hPa at the peak times and by −5.50 hPa at the landfall times, thereby summarizing that the future-climate typhoons tend to be intensified on average.
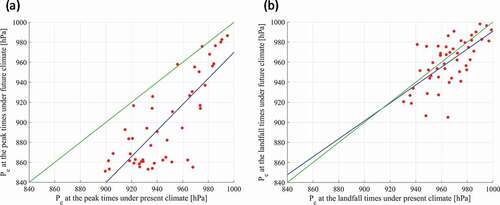
show the relative frequency distributions of the central pressure Pc for the observations (dark blue) and for the estimations in the present (blue) and future climates (orange), at peak and landfall, respectively. The frequency distribution of Pc for the peak typhoons in reveals that the majority of the typhoons in the present climate (33%) are concentrated in the 920–940 hPa range, whereas a number of the typhoons in the future climate (27%) corresponds to the 840–860 hPa range. Therefore, the typhoon intensity at the peak times will be intensified by global warming as indicated by the frequency distribution that shifts to the left. Meanwhile, the frequency distribution of Pc at the landfall times in indicates that typhoons (22%) in the present climate are mostly centered in the 960–970 hPa range, although a large number of typhoons (18%) in the future climate have a peak in the 950–960 hPa range. Further, the number of typhoons with a Pc of less than 930 hPa, which never occurs under the present climate, increases to 7 in the future climate. Although there is no clear future change in typhoon intensity, as with the peak times (), the number of future-climate typhoons that make landfall while maintaining their strong intensity is likely to increase because of global warming. shows the scatter plot of Pc between present and future climates. In the future climate, the intensity of the typhoon at the peak time will increase in all 49 cases (), and the intensity at the landfall times will increase in 30 cases ().
Figure 8. Relative frequency distributions of central pressure (Pc) at peak times for target typhoons in observations (JMA best track: dark blue bars), present-climate experiments (HTM: blue bars), and future-climate experiments (HTM: Orange bars). Average indicates the average value for each distribution.
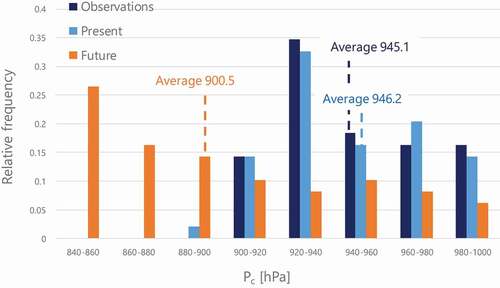
Figure 9. Relative frequency distributions of central pressure (Pc) at landfall times for target typhoons in observations (JMA best track: dark blue), present-climate experiments (HTM: blue bars), and future-climate experiments (HTM: Orange bars). Average indicates the average value for each distribution.
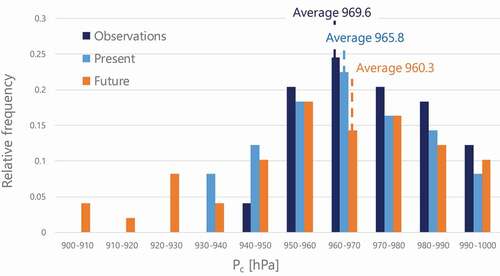
Figure 10. Scatter plot of Pc between present and future climates: (a) Pc at the peak times and (b) Pc at the landfall times – the horizontal axis represents the Pc in the present climate, and the vertical axis represents the Pc in the future climate. The blue line shows the regression line and the green line shows y = x.
3.3. Physical factors causing future changes in typhoon intensity at landfall
First, the typhoon intensity at landfall times in each month is discussed. The future changes in Pc in the months from May through August are −1.5, −5.3, −14.9, and −9.7 hPa, respectively, and the future changes in September and October are 0.72 and 1.1 hPa, respectively. Typhoon intensity increased from May through August, but it tended to be almost the same as the present climate in September and October. Typhoons in September and October under the present climate have an average Pc of 961.8 and 953.8 hPa, respectively, and make landfall in a stronger state than in other months. Therefore, the degree of increase in intensity caused by global warming is thought to be smaller than for the period from May to August. In the future climate, even for typhoons in July and August, the Pc at the landfall times intensifies to approximately 960 hPa on average, and the typhoon intensity at the landfall times tends to increase overall.
The Maximum Potential Intensity (MPI) theory (Emanuel Citation1988; Bister and Emanuel Citation2002) is widely used as an index of the maximum potential intensity of a typhoon. Here, the distribution of the minimum central pressure calculated by MPI theory is compared between the meteorological fields of the present and future climates. However, the number of typhoons generated monthly should be considered when estimating the average MPI, as this figure is highly variable (e.g. 1 typhoon in May, 15 typhoons in Sep.). -upper shows the distribution of minimum central pressure by MPI obtained by the GCMs, weighted by the typhoon number in each month (from May to October) in the Northwestern Pacific Ocean. The MPI value shown here is the minimum central pressure of the typhoon calculated by MPI theory. Compared to the present climate results (-upper left), future climate results (-upper middle) show that the minimum central pressure value is lower and that global warming tends to increase the maximum potential intensity of typhoons (-upper right). Therefore, it can be said that the typhoon intensity is likely to increase in the future climate. The future-climate simulations include super typhoons reaching up to 850–860 hPa, especially in late August and September. The monthly mean MPI for September is also lower than the average for the whole period, as shown in -upper middle. In practice, the future-climate simulations are conducted by the initial and boundary conditions such that an anomalous MPI in the present climate is added to the monthly mean MPI in the future climate. Therefore, some typhoons may develop even stronger intensities. In addition, other previous numerical studies (Tsuboki et al. Citation2015; Mori et al. Citation2021) relating to future-climate typhoons also reproduced super typhoons with a central pressure of 850–860 hPa, which is consistent with the results in this study. Further research on the fundamental processes in the development of typhoons is needed to determine whether such typhoons may occur in reality. In addition, future changes in MPI near Japan tend to be greater in the western Japan region. SST is one of the reasons for this trend. Similar changes can be seen in SST, which has a high correlation with MPI. -middle shows the SST distributions in the present and future climates, averaged by monthly mean SST, obtained by the GCMs which are weighted by the typhoon number in each month (from May to October) in the Northwestern Pacific Ocean. The typhoon genesis points of all 49 cases, where the maximum sustained wind speed exceeds 17.2 m/s, are also shown (blue dots). Notably differing from the distribution in the present climate (-middle left), the SST in the future climate exceeds 30°C in the southern part of the Japan Islands (-middle), thereby providing a suitable environment to develop a very strong typhoon. Heat and water vapor supply from the warm sea surface is essential for the development of tropical cyclones (Holland Citation1997), and tropical cyclones are more likely to develop when the sea surface temperature exceeds 26.5°C (Gray Citation1968). In addition, a tropical cyclone of Category 4 or higher can develop when the SST exceeds 28°C and the temperature below the sea surface is also high (Mainelli et al. Citation2008; Lin et al. Citation2008). Therefore, if a tropical cyclone takes time to move over a higher-SST region from the genesis to the landfall, it is expected to be sufficiently developed into a stronger typhoon. According to the future change of the SST distribution (-middle right), the SST near the Japan Islands in the future climate will increase by +3–3.5°C, and is a level identical to that of the present-climate level over the eastern Philippine Sea (Mizuta et al. Citation2014).
Figure 11. Horizontal distribution of (Upper) minimum central pressure by MPI theory (Bister and Emanuel Citation2002), (Middle) sea surface temperature (SST), and (Lower) absolute degree of vertical wind shear at 300–850 hPa. (a) is the distribution under the present climate (2000–2019), (b) is the distribution under the future climate (2080–2099), and (c) is the distribution of future changes [(b) future − (a) present]. Each value used the frequency-weighted averaged value obtained using the number of typhoons in each month, derived from CMIP5 GCMs.
![Figure 11. Horizontal distribution of (Upper) minimum central pressure by MPI theory (Bister and Emanuel Citation2002), (Middle) sea surface temperature (SST), and (Lower) absolute degree of vertical wind shear at 300–850 hPa. (a) is the distribution under the present climate (2000–2019), (b) is the distribution under the future climate (2080–2099), and (c) is the distribution of future changes [(b) future − (a) present]. Each value used the frequency-weighted averaged value obtained using the number of typhoons in each month, derived from CMIP5 GCMs.](/cms/asset/e51dc77b-c155-4d12-85d2-b5ccdac2ee20/tcej_a_2002060_f0011_oc.jpg)
-lower shows the future change in the vertical wind shear defined as the wind speed difference between 300 and 850 hPa, which is known to be involved in typhoon decay, especially in the mid-latitude baroclinic environment (Yamada, Moteki, and Yoshizaki Citation2010). In the subtropical high-pressure zone of 20°–30°N latitude, the vertical wind shear is small in both present (-lower left) and future climates ( lower middle), which makes it a suitable environment for the development of typhoons. The future changes in the vertical wind shear (-lower right) are within the range of −0.5 to +0.5 m/s near the Japan Islands, which suggests little change in the future. Therefore, the influence of the future change in mean vertical wind shear on the typhoon intensity is also identified to be small.
These findings suggest that the increase in SST has a considerable effect on the future change in typhoon intensity. The high SST area above 29°C is currently confined to the lower latitudes in the eastern part of the Philippines Sea; however, in the future climate, the high SST region is expected to spread to the vicinity of the Japan Islands. It is speculated that many typhoons will be able to develop to a “super-typhoon” level (reaching the maximum sustained 1 min surface wind speeds of at least 67 m/s) even near the Japan Islands. Some of the typhoons are expected to make landfall while maintaining their strong intensity. Although the present-climate typhoons that develop at relatively high latitudes cannot be fully developed throughout their life cycle, they can rapidly develop even at high latitudes in the future climate owing to the high SST exceeding 30°C.
The numerical experiments of the 49 cases in this study show that the future change in typhoon intensity at the landfall times is larger in some cases and smaller in others. Thus, it appears to be a difference in the effects of global warming in different typhoon cases. Therefore, there is a possibility that not only sea surface temperature but also other factors may affect future changes in typhoon intensity.
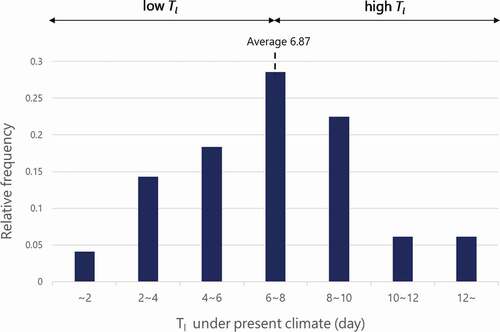
First, based on the criteria of the JMA Best Track data at the landfall times (), 24 typhoons in the present climate make landfall with “strong” or “very strong” intensities (Vm of 33 m/s or more), and their mean elapsed time from genesis to landfall is 7.58 days. In addition, their mean Rm for the 24 typhoons is 87.5 km at the landfall times when the average Pc is 953.8 hPa. In contrast, there are 25 out of 49 cases of typhoons in the present climate, which make landfall with a Vm of less than 33 m/s, with a mean elapsed time from genesis to landfall of 6.18 days and with a mean Rm of 114.7 km at the landfall times when the average Pc is 977.3 hPa. In other words, the present-climate strong typhoons at the landfall times tend to have a longer elapsed time from genesis to landfall (1.4 days longer) and a smaller Rm (30 km smaller) than weak typhoons. Thus, the future change in typhoon intensity at the landfall times is greatly influenced by the elapsed time from genesis to landfall (Tl) and the Rm at the landfall times (Rml) under the present climate. Note that the definition of Rm (all lifetime) and Rml (only landfall times) are different. Therefore, we further analyze the effect of these two parameters on the future changes in typhoon intensity.
Table 3. Summary of 49 typhoons for Vm, time from genesis to landfall, and Rm by JMA: 24 typhoons make landfall with “strong” or “very strong” intensities (Vm of 33 m/s or more) and 25 typhoons make landfall with a Vm of less than 33 m/s
shows the frequency distribution of Tl for all 49 cases under the present climate. The average Tl value is 6.87 days, which indicates a profile close to a normal distribution. In this study, typhoon cases with Tl below the average are defined as “low Tl” (23 cases), and those with average Tl values or higher are defined as “high Tl” (26 cases). summarizes the average Pc and future changes in the present and future climates for the low Tl and high Tl cases. The average future change for the low Tl cases (−13.3 hPa) is larger than that for all cases (−5.50 hPa). In contrast, the average future change for the high Tl cases (+1.40 hPa) is smaller than that for all cases (−5.50 hPa). Furthermore, the difference between the low- and high Tl cases is found to be significant (a significance level of 5%, one-sided test). Therefore, future-climate typhoons will be reinforced in low Tl cases occurring near the Japan Islands because of global warming. Under the present climate, the intensities of the high Tl cases at the landfall times (956.9 hPa) are stronger than those of the low Tl cases at the landfall times (975.8 hPa), and there is a significant difference (a significance level of 5%, one-sided test). However, under future climates, the low Tl cases at landfall times become significantly stronger (962.5 hPa), which obscures the difference in typhoon intensity with the high Tl cases (958.4 hPa). The degree of achievement of the MPI was confirmed for the cases where the strength increased above the average (−5.5 hPa) at the time of landfall (23 cases). As a result, the ratio of the intensity reached to the MPI is 62.0% in the present climate. However, this value is 86.3% in the future climate, and it can be seen that typhoons make landfall after reaching an intensity closer to the MPI. Thus, there is concern that many typhoons in the future climate are likely to mature into a steady-state structure independent of Tl, and they will make landfall on the Japan Islands while maintaining their intensity.
Table 4. Central pressure values (Pc) averaged for all (49 cases), low Tl (23 cases), and high Tl (26 cases) in PGWDs. Typhoons with Tl of less than 6.87 days are referred to as “low Tl” (23 cases), whereas those with Tl of 6.87 days or more as “high Tl” (26 cases). The left, middle, and right columns show the average values for the present-climate experiments, future-climate experiments, and future changes, respectively. The values in parentheses indicate the standard deviation
Figure 12. Relative frequency distribution of the time period from genesis to landfall (Tl) according to JMA best track. The average values of Tl for all cases is 6.87 days. Cases with values of less than 6.87 days are referred to as low Tl, whereas cases with values equal to or higher than 6.87 days as high Tl.
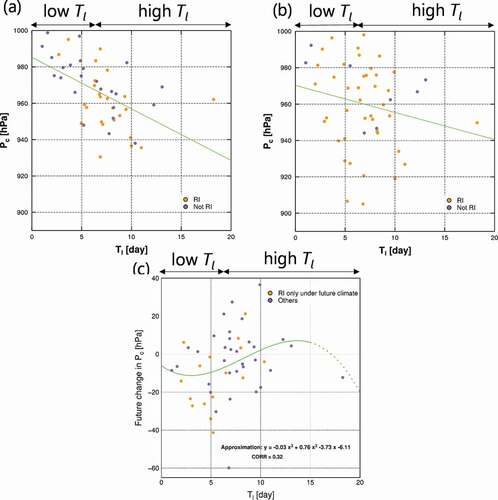
shows the relationship between Tl and Pc of the landfalling typhoons under the present and future climates. In the present climate (), typhoons with higher Tl tend to yield a lower Pc at the landfall times. In the future climate (), there will be more typhoon cases that can develop to a Pc of less than 940 hPa despite the small Tl. In the future change in Pc (), there is a nonlinear trend, and the regression equation excluding outliers (Tl = 6.79, Pc = −59.9; Tl = 18.25, Pc = −3.8) is shown in the figure. The various combinations of Tl were considered, from linear to quartic, with the cubic form considered to be the best option. Typhoons with shorter Tl make landfall before they are fully developed, under the present climate. Although typhoons will be able to develop even in a short period of time, due to the increase in SST under the future climate, the future change of Pc (∆Pc) will be significant and negative. The extreme minimum value of ∆Pc is around Tl = 3. However, as Tl increases, typhoons can fully develop even under the present climate. Therefore, the difference between the present and future typhoon intensities becomes smaller and, in some cases, positive. Typhoon cases with lifetimes of 7–12 days vary widely. Some typhoons increase significantly in intensity due to increased SST under the future climate, whereas others are suppressed by increased AT in the upper atmosphere (200–300 hPa) or being exposed vertical wind shear for a long time (Frank and Ritchie Citation2001; Wong and Chan Citation2004; Takemi, Ito, and Arakawa Citation2016). Thus, the predominance of SST or other factors depends on the environmental field (season, area etc.) of the typhoon. In contrast, with an approximate border of Tl = 13, ∆Pc again increases in the negative direction. For Tl larger than the second extreme (i.e. Tl > 13), the data are shown as a dotted line. This is because such cases are rare, and we cannot discuss quantitatively which physical factors, either SST or other factors, are dominant. In contrast, it is not important whether these cases are included or not in determining the functional form of ΔPc.The relationship between the future change in Pc and Tl can be expressed as a cubic equation. The relationships between Tl and Pc in the present (), Tl and Pc in the future (), and Tl, and the future change in Pc () were tested using the Mann–Kendall test (significance level of 5%, two-sided test), and it was confirmed that these parameters have a clear trend.
Figure 13. Scatter diagrams of the time period from genesis to landfall (Tl) derived from JMA best track and the central pressure (Pc) for target typhoons calculated from: (a) present-climate experiments and (b) future-climate experiments. (c) A scatter diagram of Tl and future changes in Pc between (b) future and (a) present climates. In (a) and (b), the Orange and purple points represent cases where rapid intensification (RI) did and did not occur, respectively. In (c), the Orange and purple points represent cases where RI occurs under only the future climate and all other cases, respectively. Green lines in the diagrams represent regression lines.
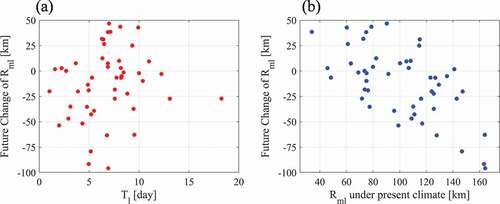
shows the frequency distribution of Rml for all 49 cases under the present climate. The mean value of Rml is 101.4 km, which shows a normal distribution. Therefore, we set the mean value as the threshold value in the present climate, defining the small Rml cases (23 typhoons) as those with Rml below the mean value and the large Rml cases (26 typhoons) as those with Rml above the mean value.
Figure 14. Relative frequency distribution of the radius of maximum wind speed at landfall times (Rml) for target typhoons in the present-climate experiments. The average values of Rml for all cases is 101.4 km. Cases with values of less than 101.4 km are referred to as small Rml, whereas cases with values equal to or larger than 101.4 km as large Rml.
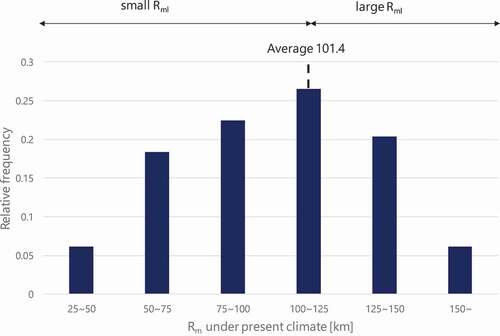
summarizes the average Pc and future changes in the present and future climates for the small Rml and large Rml cases. The average future change in Pc at the landfall times is negatively larger for the large Rml case (−11.7 hPa) than for all cases (−5.50 hPa). In contrast, the average future change at the landfall time is larger (change of typhoon intensity to weaken) for the small Rml cases (+1.60 hPa) than for all cases. In addition, the difference in the average future changes between the large- and small Rml cases reveal a significant difference (a significance level of 5%, one-sided test). As noted in previous studies (Smith, Montgomery, and Sang Citation2009), when the typhoon Vm increases, Rm contracts as it satisfies the law of conservation of angular momentum. Therefore, well-developed typhoons tend to have large Vm with small Rm (Colon Citation1963; Shea and Gray Citation1973). Therefore, it can be interpreted that typhoons with a large Rml in the present climate can intensify further because of the future global warming. In contrast, typhoons with small Rml in the present climate leave little room for their reinforcement at the landfall times.
Table 5. Central pressure values (Pc) averaged for all (49 cases), small Rml (23 cases), and large Rml (26 cases) in PGWDs. Typhoons with Rml of less than 101.4 km are referred to as “small Rml” (23 cases), whereas those with Rml of 101.4 km or more as “large Rml” (26 cases). The left, middle, and right columns show the average values for the present-climate experiments, future-climate experiments, and future changes, respectively. The values in parentheses indicate the standard deviation
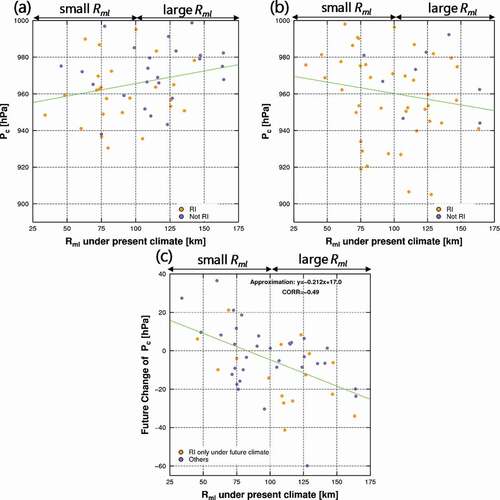
shows the relationship between Rml and Pc of the landfalling typhoons under the present () and future climates (). Generally, the typhoon intensity and Rml obey the law of conservation of angular momentum. The stronger the typhoon, the smaller the radius tends to be, mainly due to the conservation of angular momentum. However, this may not always be the case, depending on the properties of each individual typhoon. According to the Mann–Kendall test (a significance level of 5%, two-sided test), there is no significant trend between Rml and Pc in both the present climate () and the future climate (). In contrast, the large Rml cases in the present climate have a large and negative future change of Pc, which indicates a moderate negative correlation in (correlation coefficient of −0.49). Typhoons with large Rml under the present climate tend to increase their intensity due to global warming (∆Pc is large and negative), a clear trend can be found between ∆Pc and Rml (). This is because the present-climate typhoons with low Tl and large Rml are often relatively weak at the landfall times, which suggests that there is room for them to develop further with future global warming. The larger the Rml under the present climate, the larger the negative value of ∆Pc. Therefore, the relationship between the future change in Pc and Rml under the present climate can be expressed as a linear equation.
Figure 15. Scatter diagrams of the radius of maximum wind speed (Rml) under present climate and central pressure (Pc) for target typhoons calculated from: (a) present-climate experiments and (b) future-climate experiments. (c) A scatter diagram of Rml and the future changes in Pc. The points correspond to those provided in .
Accordingly, we found that the future change in typhoon intensity at landfall times is strongly constrained by Tl and Rml in the present climate. In addition, we expect that typhoons in the future climate will develop rapidly and make landfall on the Japan Islands in a short period after their genesis. Hence, we examine the frequency and magnitude of the rapid intensification (RI) of typhoons under present and future climates. In this study, RI is defined as the development of a typhoon exceeding 15.4 m/s (30 kt) in 24 h (Kaplan et al. Citation2015; Wang et al. Citation2015; Bhatia et al. Citation2019).
The scatter plots in are separated by the presence or absence of RI of the typhoons. The RI is identified for 25 cases under the present climate, i.e. 51.0% of the total (the orange points in ), and for 41 cases under the future climate, i.e. 83.7% of the total. In addition, 16 out of 41 cases, where RI is observed only in future climates, are also detected. In addition, 11 out of 16 cases are detected as low Tl and large Rml cases. Hence, the low Tl or large Rml cases are more likely to exhibit RI in the future climate than the high Tl or small Rml cases.
It is concluded from the results obtained from the high-resolution typhoon database that RI is more likely to occur in more cases under the future climate mainly because of the rise in SST caused by the progressing global warming. In addition, this impact is remarkable in the low Tl and large Rml typhoons under the present climate.
4. Proposal of an e-PGWD method for storm surges along the Pacific Coast in Japan
In this section, we exploit the statistical and empirical analysis between the present- and future-climate experiments using the d-PGWD method for all 49 typhoon cases described in the previous section, and we propose a simplified method “e-PGWD” for application to the Pacific coast of the Japan Islands. The d-PGWD based on dynamical meteorological models (such as HTM) are extremely computationally demanding, and it is very difficult for policy makers and harbor/port managers to estimate the meteorological fields in a typhoon for storm surge simulations at each port in practice, using it. Therefore, we develop a method for efficiently performing global warming experiments for storm surges. In this approach, the future changes ∆Pc and ∆Rml are calculated based on empirical equations for the input of the observed Tl and Rml. The results are fed into a two-dimensional empirical typhoon model that operates with a low computational cost to obtain the meteorological field under the future climate. In this study, Typhoons Jongdari (2018), Jebi (2018), and Trami (2018), all of which made landfall to Japan in 2018, are selected as case studies (none of these cases were included in the 49 cases considered in the previous section). The storm surge estimations given by both d-PGWD and e-PGWD are compared to validate the proposed method.
4.1. 4.1. e-PGWD methodology
4.1.1. A calculation flow for e-PGWD
The proposed e-PGWD method is implemented according to the flowchart shown in . First, attribute values of a target typhoon, i.e. typhoon position (TYpos), and Pc and Rm1 (Pcp and Rmlp, respectively) are obtained from the JMA best track as a present-climate typhoon. As Rmlp cannot be observed directly, the value is indirectly assessed using the estimation formula given in EquationEq. (2)(2)
(2) . An empirical typhoon model (ETM) (Mitsuta and Fujii Citation1987) is used to express typhoon meteorological fields under the present climate. The obtained typhoon meteorological field, including wind vectors and sea surface pressure, is fed into a storm surge model (SSM) to evaluate the storm surge associated with the target typhoon in the present climate.
Figure 16. Computational flow of the e-PGWD method. The left, middle, and right columns show the flows of the present-climate experiment, future-climate experiment (e-PGWD), and horizontal resolution at each calculation step, respectively.
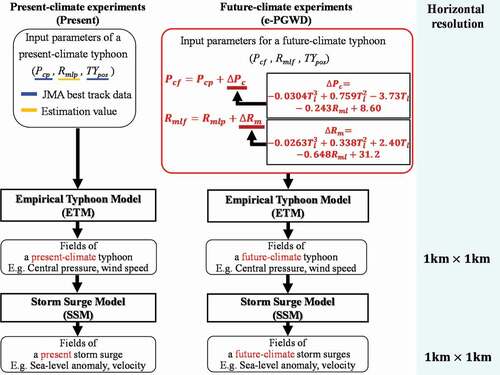
The e-PGWD method we propose has three constraints. The first is that future changes can be calculated using easily available data, the second is that the data to be input are values for the present climate and, lastly, the data to be input have to correlate with future changes in typhoon intensity. To achieve the goal that propose future-climate experiment method that can be conducted by practitioners considering these constraints, we devised an equation to estimate future changes in typhoon intensity from present-climate information without using future-climate parameters. In Section 3.3, the correlation between many parameters available in the present climate – peak intensity, the intensity at landfall times, typhoon location, season (including temperature and SST), the region of landfall, radius, and time – and ∆Pc and ∆Rml were used to select the explanatory variables for the estimation formula. As a result, it was revealed that Tl and Rml are correlated most strongly with ∆Pc and ∆Rml. In addition, the relationship between ∆Pc and Tl is expressed in cubic form (), and the relationship between ∆Pc and Rml is expressed linearly (). Therefore, an estimation formula was devised for ∆Pc and ∆Rml with nonlinear regression analysis, using the generalized additive model and the results from Section 3.3. The future changes, ∆Pc and ∆Rml, calculated by the estimation formula, can be added to the attribute values, Pcp and Rmlp, of a present-climate typhoon to express the intensity and structure, Pcf and Rmlf, of a future-climate typhoon.
Compared to the flowchart of the d-PGWD method shown in , it is not necessary for the e-PGWD method to use a three-dimensional dynamical meteorological model with high computational cost, and therefore, this approach is characterized by high computational efficiency. However, it should be noted that, like the d-PGWD, the e-PGWD is calculated under the assumption that the typhoon track and its translation speed in the future climate will not differ from those in the present climate. Typhoon intensity is determined by the influence of many parameters (e.g. SST) that vary as a result of climate change. However, the method of inputting the physical quantities of the future climate and evaluating the future change of the typhoon must use a meteorological model that requires specialized knowledge. This deviates from the purpose of this research that propose method that can be conducted by practitioners. Therefore, the e-PGWD proposed in this paper uses only data that are readily available in the present climate. By using the nine combinations of Pce and Rmle considering the uncertainties of the empirical formula of ∆Pc and ∆Rml, typhoon meteorological fields under the future climate are calculated using the ETM in the same way as for the present climate. In addition, e-PGWD calculations for storm surges associated with a future-climate typhoon can be conducted by the SSM based on the created typhoon meteorological fields. It should be emphasized that the proposed e-PGWD is a method for people who are not experts in climate change, such as port managers, to carry out pseudo-global warming experiments easily.
4.1.2. Regression equations for typhoon future changes
According to the discussion in the Section 3.3, the future changes in the intensity and structure of landfalling typhoons will be significantly affected by Tl and Rml at landfall times in the Japan Islands, and there are significant differences between low Tl cases (small Rml cases) and high Tl cases (large Rml cases). Therefore, the following estimated equation is obtained using a nonlinear regression analysis with future change in Pc (∆Pc) as the objective variable and Tl and Rml as explanatory variables, based on the high-resolution typhoon database. The form of estimation formula is based on the discussion in Section 3.3, and the best combination is cubic for Tl and linear for Rml. We construct the formula by nonlinear regression analysis using the results of Section 3.3 and the generalized additive model. The magnitude of estimation errors (bias, root mean square), the correlation coefficient (CORR), the degree of freedom-adjusted coefficient of determination (CD), and Akaike’s Information Criterion (AIC) are used to determine whether the estimated equation is the best combination of Tl and Rml. The estimation formula EquationEq. (3)(3)
(3) has the highest CORR (0.64), CD (0.42), and lowest AIC in all combinations we considered.
This formula (regression coefficients) is constructed using robust estimation to remove outliers or noise in the data and bound the calibration signal within narrow limits. In addition, a constant indicates residuals. This equation consists of an additive model of a cubic equation for Tl and a linear equation for Rml. Both Tl and Rml are parameters under the present climate. Tl obtained from the JMA best track data and Rml estimated using EquationEq. (2)(2)
(2) are input into EquationEq. (3)
(3)
(3) . Pc in the future climate is calculated as the sum of the observed Pc in the present climate and the future change ∆Pc obtained by EquationEq. (3)
(3)
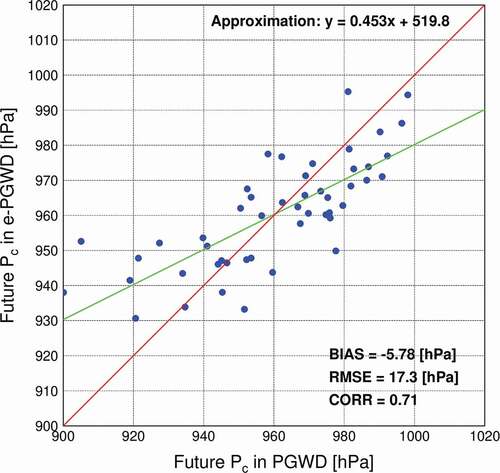
(3) . provides a comparison of the estimated Pc for e-PGWDs performed using EquationEq. (3)
(3)
(3) with d-PGWDs performed using HTM. The obtained correlation coefficient is as high as 0.71, and thus, it is possible to capture the overall trend with a simple method. However, there are bias errors in describing typhoons weaker than 980 hPa as stronger, and typhoons stronger than 940 hPa as weaker; further, there must exist non-negligible uncertainty with a root mean square error (RMSE) of 17.3 hPa. Overall, although it is necessary to consider the uncertainty of the estimation formula, the simple formula expressed in EquationEq. (3)
(3)
(3) is expected to estimate Pc under the future climate with a certain degree of accuracy. The standard errors of EquationEq. (3)
(3)
(3) is 9.87 hPa. The correlation coefficient between Tl and Rml is −0.1, which suggests that multicollinearity in the equation is not a problem.
Figure 17. Scatter diagram of future-climate central pressure (Pc) in PGWDs (horizontal axis) and e-PGWDs (vertical axis).
In addition to the typhoon intensity Pc, the typhoon structure Rml may change under the future climate conditions as a result of global warming. Therefore, it is necessary to consider future changes in both Pc and Rml in the storm surge estimation for the future climate. As Rml is a required input condition for the ETM, the following estimation formula is also obtained using a nonlinear regression analysis with the future change in the typhoon structure ∆Rml as the objective variable, and Tl and Rml as explanatory variables, in the same process to ∆Pc.
where ∆Rml is the future change in the radius of the maximum wind speed (km), and both Tl and Rml are taken as explanatory variables under the present climate. In addition, the constant means residuals. For ∆Pc, the regression equation is constructed by performing a robust estimation. This equation also consists of an additive model of a cubic equation for Tl and a linear equation for Rml. The relationship between ∆Rml and Tl (), and between ∆Rml and Rml under the present climate () show that the data are fitted using cubic and linear functions, respectively. The obtained correlation coefficient is 0.49, and the RMSE is 25.4 km. Although the correlation of the Rml formula is inferior to that of the Pc formula, it is considered that the tendency of future changes is captured. EquationEquations (4)(4)
(4) has a standard error of 23.1 km.
Figure 18. (a) The scatter plot between Tl and future change of Rml (ΔRml.). The scatter plot between Rml under present climate and future change of Rml (ΔRml). The correlation coefficient is 0.24 for Tl and ΔRml and −0.61 for Rml under the present climate and ΔRml.
In this study, we estimate the typhoon meteorological field under the future climate using Pc + ∆Pc and Rml + ∆Rml as input parameters for the empirical typhoon model, as evaluated by EquationEq. (3)(3)
(3) and (Equation4
(4)
(4) ). To account for the uncertainties in EquationEq. (3)
(3)
(3) and (Equation4
(4)
(4) ), in addition to the case where the estimates of ∆Pc and ∆Rml are used directly, we compute the cases of adding and subtracting the standard errors (Pce = 9.87 hPa and Rmle = 23.1 km) to them (Pc + ∆Pc and Rml + ∆Rml). (The above results are presented as ±Pce and ±Rmle in the tables). In other words, we perform computations for a total of nine cases combining three patterns of Pce (−9.87, 0.0, and +9.87 hPa) and three patterns of Rmle (−23.1, 0.0, and +23.1 km). Thus, we conduct the future-climate experiments for storm surges using the ETM and SSM, while considering the uncertainties of the e-PGWD method.
4.1.3. Two-dimensional empirical typhoon model
In the e-PGWD approach, an ETM is used to construct meteorological fields for storm surge calculations (Mitsuta and Fujii Citation1987) because of its low computational costs. The ETM is composed of the Myers equation (Myers Citation1954) for the atmospheric surface pressure field given as
and the gradient wind equation for the wind velocity vector field, which is expressed as
where is the wind velocity based on the atmospheric pressure gradient;
is the radius of curvature of the air-particle trajectory, which coincides with the distance
from the typhoon center;
is the Coriolis parameter; and
is the air density. In addition to the above two equations, Blaton’s equation is adopted to incorporate the effect of the typhoon movement on the wind velocity vector field.
where is time and
is the particle movement direction. Through the introduction of EquationEq. (7
(7)
(7) ), stronger winds blow in the dangerous semicircle on the right side of the typhoon’s traveling direction and weaker winds exist in the navigable semicircle on the left side of the traveling direction. Furthermore, the ground surface friction effect is assumed using Goldberg–Mohn friction, and the blowing angle of the wind velocity vector is set to 10°, which is typical on the sea.
4.1.4. Storm surge model
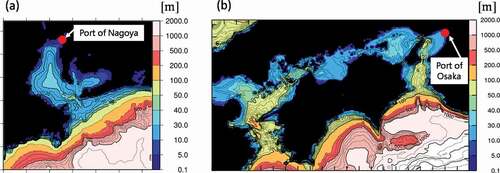
An SSM is employed in this study to estimate the storm surge height (sea-level anomaly) at the target bay. The SSM is composed of a one-layer nonlinear long-wave equation, and the ocean tide level and ocean current vector are used as the prognostic variables. The typhoon meteorological fields obtained by the ETM are input into the SSM every 15 min as the sea-surface boundary condition. The horizontal grid spacing of the SSM is 1 km. For the sea bathymetric data, 1 min mesh global ground relief data (ETOPO1) provided by NOAA is used (Amante and Eakins Citation2009). For the coastline data, 30 s mesh global land-use data provided by the United States Geological Survey is utilized (Danielson and Gesch Citation2011). The target bays for the storm surge calculations are Ise Bay and Mikawa Bay () for Typhoons Jongdari and Trami, and Osaka Bay for Typhoon Jebi ().
Figure 19. Horizontal distributions of the ocean topography around (a) Ise Bay and Mikawa Bay, and around (b) Osaka Bay are used in the storm surge model (SSM). The red points indicate the target ports for validating and discussing the SSM results: (a) Port of Nagoya and (b) Port of Osaka.
4.2. Verification and assessment of e-PGWD
We considered the three cases of Typhoons Jongdari (2018), Jebi (2018), and Trami (2018) to verify the e-PGWD validity and calculated their future changes (). The Tl and Rml values for those typhoons are obtained from the JMA best track as input parameters described in . Then, future changes ∆Pc and ∆Rml are estimated by EquationEq. (3)(3)
(3) and (Equation4
(4)
(4) ) for each case. Typhoon Jongdari with small Tl and large Rml tends to have a large negative future change in Pc. In the case of Typhoon Jebi, where Tl is large and Rml is small, the future change in typhoon intensity is not considerably large. When calculating ETM, the standard errors of the estimation formula for ∆Pc and ∆Rml are also added and subtracted to consider uncertainties for the future change. A total of nine calculations for each typhoon cases are performed considering the combination of three patterns of ∆Pce (−9.87, 0.0, and +9.87 hPa) and three patterns of ∆Rmle (−23.1, 0.0, and +23.1 km). For the storm surge calculation, the d-PGWDs and e-PGWDs obtained from the SSM are evaluated and validated at the Port of Nagoya for Typhoons Jongdari and Trami, and the Port of Osaka for Typhoon Jebi (the red points in and b). The total calculation period is 24 h from before to after the landfalls of the typhoons. Our ensemble calculations for the validation of e-PGWD assume that the typhoon track is not changed from the present climate, and 9 types of input values are prepared for the typhoon intensity and typhoon radius. In addition, 9 types of storm surge results can be obtained in each typhoon case.
Table 6. Attribute variables for three target typhoons in 2018 (Typhoons Jongdari, Jebi, and Trami) used for e-PGWD: input typhoon parameters (Pc,Tl, and Rml), estimated future typhoon changes (∆Pc and ∆Rml), and estimated future typhoon parameters (Pcf and Rmlf) with standard errors of estimation (Pce and Rmle)
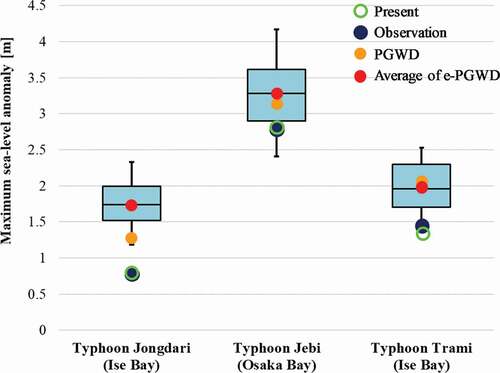
First, we confirm the reproducibility of the present-climate experiments for Typhoons Jongdari, Jebi, and Trami (). The maximum sea-level anomalies reproduced by HTM are 0.75, 2.85, and 1.33 m for Typhoons Jongdari, Jebi, and Trami, respectively. The maximum sea level anomalies observed by JMA are 0.73, 2.77, and 1.44 m, respectively, which indicate that the comparison between the HTM and observations accurately reproduces the sea level anomalies that occurred. Next, the results obtained using the e-PGWD method are validated by comparing them with the results obtained using the d-PGWD approach. The maximum sea-level anomalies given by the d-PGWD are 1.22, 3.08, and 2.05 m for Typhoons Jongdari, Jebi, and Trami, respectively. Considering the uncertainties in the ∆Pc and ∆Rml estimates by the e-PGWD, the ensemble means (standard deviations) of the maximum sea level anomalies are found to be 1.74 m (0.52 m), 3.26 m (0.74 m), and 1.98 m (0.54 m) for Typhoons Jongdari, Jebi, and Trami, respectively. The maximum sea-level anomalies estimated using d-PGWD are distributed within the standard deviation of using e-PGWD in all cases (the whiskers in the boxplot). Therefore, the e-PGWD method based on the constructed estimation formula yields reasonable results. Thus, although this is not a sufficient verification because there were only three cases, it was confirmed that it is possible to estimate the future changes of storm surges of different scales using e-PGWD.
Figure 20. Box-and-whisker plot of the maximum sea-level anomalies at the target port simulated by e-PGWDs for nine cases. The blue, dark-blue, Orange, and red points indicate the maximum sea-level anomalies at the target port simulated by the observations (black points), present-climate experiments (green points), PGWD results by HTM (Orange points), and average values for all e-PGWDs. The box height includes the half of all the ensemble sizes in e-PGWDs, and the black line in the box represents the median value.
5. Concluding remarks
In this study, the d-PGWD experiments were performed using a three-dimensional HTM for 49 typhoons that made landfall in Japan from 2000 to 2017. Under the future climate, typhoon intensity was found to show a tendency to increase at both peak and landfall (average values of −45.7 and −5.5 hPa at the peak and landfall times). The tendency of future changes in typhoon intensity obtained in this study are consistent with the tendency of increasing typhoon intensity identified in previous studies. Detailed analyses of the characteristics of typhoons making landfall in the Pacific coast in Japan showed that there is a significant difference in the future changes in the typhoon intensity based on Tl and Rml. In particular, a typhoon that has a lower Tl than the average (6.87 day) and a larger Rml than the average (101.4 km) in the present climate has the potential to exhibit greater future changes in terms of typhoon intensity, which indicates that the future-climate typhoons will become more intense. Therefore, weak typhoons characterized by low Tl and large Rml under the present climate are likely to develop into the maximum intensity characterized by high Tl and small Rml under the future climate. To the best of our knowledge, there is currently no published literature that has used a RCM to explore the characteristics of a number of typhoons similar to the 49 events used in this study. Therefore, the scale of this investigation presents a significant contribution to the existing knowledge-base on future changes in typhoon intensity.
Furthermore, regression equations underlying the e-PGWD approach were constructed based on the trend of future changes in the typhoon intensity derived using the high-resolution typhoon database with d-PGWD. The typhoon intensity under the future climate was determined by the sum of the present-climate value Pc with the future change (∆Pc), and the typhoon meteorological fields were calculated by an ETM with a low computational cost. The storm surge heights at the target bays were estimated using an SSM. e-PGWD experiments were conducted for three typhoons that made landfall in Japan in 2018 (Typhoon Jongdari, Typhoon Jebi, and Typhoon Trami), and the results were compared with those of the d-PGWD experiments for validation. The storm surge heights obtained by d-PGWD fell within the error range of those obtained using e-PGWD, and thus, the validity of the e-PGWD method proposed in this study had a certain level of accuracy. The e-PGWD differs from the original d-PGWD method in that it uses a low-cost model that allows policymakers and port managers to implement it easily. Thus, the proposed e-PGWD method can contribute to disaster prevention and mitigation measures for coastal disasters caused by the future climate (in 2080–2099, and under the RCP8.5 scenario), such as storm surges caused by typhoons, for major ports along the Pacific coast in Japan. However, compared to the d-PGWD method, the e-PGWD method has a tendency to underestimate typhoon intensities with a central pressure of less than 920 hPa at landfall under the present climate, thus, it requires further development. In addition, the future changes in typhoon intensity evaluated by the e-PGWD capture the average characteristics of typhoons that have landed on the Japanese archipelago, meaning that it is not possible to discuss regional differences in future changes. Therefore, it is necessary to accumulate more cases after reducing the uncertainty to discuss regional differences with this method. A challenge for future research is to construct an advanced e-PGWD method that has a higher accuracy by assessing more typhoon cases with the d-PGWD method. Once a sufficient number of cases are available, it is expected that more robust estimation equations can be devised by classifying the data into training and test data, and validating each with independent numbers (Tl,Rml,∆Pc). In addition, though harbor or port managers do not need to calculate additional d-PGWD, it is necessary to update the e-PGWD provided by us when the new calculation results are obtained. The present form of the e-PGWD approach has the limitations of restricted applicability and high uncertainty. Our future work will concentrate on refining e-PGWD to reduce uncertainty in the scenarios, time periods, and models because there are social demands to evaluate different time periods (e.g. 2030s and 2050s) and different scenarios (e.g. RCP4.5 and RCP2.6).
Acknowledgments
This research was supported by a JSPS Research Fellow Grant (No. 17J04771) and a JSPS KAKENHI Grant (No. 18H01542). This manuscript incorporates material from the first authors’ PhD dissertation, Graduate School of Engineering, Gifu University.
Disclosure statement
No potential conflict of interest was reported by the author(s).
Additional information
Funding
References
- Aichi Prefecture. 2014. “Expected Flood of Storm Surge”. Japan, Aichi Prefecture, kaisetsusyo1.pdf, 12p. (Accessed 20 December 2019). https://www.pref.aichi.jp/soshiki/kowan/0000077972.html
- Amante, C., and B. W. Eakins. 2009. “ETOPO1 1 Arc-Minute Global Relief Model: Procedures, Data Sources and Analysis.” NOAA Technical Memorandum NESDIS NGDC-24, 19p
- Bhatia, K. T., G. A. Vecchi, T. R. Knutson, H. Murakami, J. Kossin, K. W. Dixon, and C. E. Whitlock. 2019. “Recent Increase in Tropical Cyclone Intensification Rates.” Nature Communications 10, article number 635. doi:https://doi.org/10.1038/s41467-019-08471-z.
- Bister, M., and K. A. Emanuel. 1998. “Dissipative Heating and Hurricane Intensity.” Meteorology and Atmospheric Physics 65 (3–4): 233–240. doi:https://doi.org/10.1007/BF01030791.
- Bister, M., and K. A. Emanuel. 2002. “Low Frequency Variability of Tropical Cyclone Potential Intensity: 1. Interannual to Interdecadal Variability.” Journal of Geophysical Research: Atmospheres 107 (D24): 4801. doi:https://doi.org/10.1029/2001JD000776.
- Colon, J. A. 1963. “On the Evolution of the Wind Field during the Life Cycle of Tropical Cyclones.” National Hurricane Research Project Report Archive, Report No. 65, 36 pp.
- Danielson, J.J., and D.B. Gesch 2011. “Global Multi-resolution Terrain Elevation Data 2010 (GMTED2010)”: U.S. Geological Survey Open-File Report 2011–1073, 26 p., doi: https://doi.org/10.3133/ofr20111073.
- Dudhia, J. 1993. “A Nonhydrostatic Version of the Penn State-NCAR Mesoscale Model: Validation Test and Simulation of an Atlantic Cyclone and Cold Front.” Monthly Weather Review 121 (5): 1493–1513. doi:https://doi.org/10.1175/1520-0493(1993)121<1493:ANVOTP>2.0.CO;2.
- Emanuel, K. A., C. DesAutels, C. Holloway, and R. Korty. 2004. “Environmental Control of Tropical Cyclone Intensity.” Journal of Atmospheric Science 61 (7): 843–858. doi:https://doi.org/10.1175/1520-0469(2004)061<0843:ECOTCI>2.0.CO;2.
- Emanuel, K. A. 1988. “The Maximum Intensity of Hurricanes.” Journal of Atmospheric Science 45 (7): 1143–1155. doi:https://doi.org/10.1175/1520-0469(1988)045<1143:TMIOH>2.0.CO;2.
- Fairall, C. W., J. D. Kepert, and G. J. Holland. 1994. “The Effect of Sea Spray on Surface Energy Transports over the Ocean.” The Global Atmosphere and Ocean System 2: 121–142.
- Frank, W., M., and E., A. Ritchie. 2001. “Effects of Vertical Wind Shear on the Intensity and Structure of Numerically Simulated Hurricanes.” Monthly Weather Review 129 (9): 2249–2269. doi:https://doi.org/10.1175/1520-0493(2001)129<2249:EOVWSO>2.0.CO;2.
- Gray, W. M. 1968. “Global View of the Origin of Tropical Disturbances and Storms.” Monthly Weather Review 96 (10): 669–700. doi:https://doi.org/10.1175/1520-0493(1968)096<0669:GVOTOO>2.0.CO;2.
- Holland, G. J. 1997. “The Maximum Potential Intensity of Tropical Cyclones.” Journal of the Atmospheric Sciences 54 (21): 2519–2541. doi:https://doi.org/10.1175/1520-0469(1997)054<2519:TMPIOT>2.0.CO;2.
- Intergovernmental Panel on Climate Change, Fifth Assessment Report, Working Group I. 2013a. “Climate Phenomena and Their Relevance for Future Regional Climate Change.” Chap. 14 in Climate Change 2013: The Physical Science Basis, edited by the Intergovernmental Panel on Climate Change Accessed 10 November 2021. https://www.ipcc.ch/report/ar5/wg1/climate-phenomena-and-their-relevance-for-future-regional-climate-change/
- Intergovernmental Panel on Climate Change, Fifth Assessment Report, Working Group I. 2013b. “Summary for Policymakers.” in Climate Change 2013: The Physical Science Basis, edited by the Intergovernmental Panel on Climate Change Accessed 10 November 2021. https://www.ipcc.ch/report/ar5/wg1/summary-for-policymakers/
- Intergovernmental Panel on Climate Change. 2013. Climate Change 2013: The Physical Science Basis, 1535. Cambridge, United Kingdom and New York, NY, USA: Cambridge University Press.
- Japan Meteorological Agency. 2018. “Statistical Data of Typhoons”. (Accessed 10 December 2019). http://www.data.jma.go.jp/fcd/yoho/typhoon/statistics/index.html
- Kaplan, J., C. M. Rozoff, M. Demaria, C. R. Sampson, J. P. Kossin, C. S. Velden, J. J. Cione, et al. 2015. “Evaluating Environmental Impacts on Tropical Cyclone Rapid Intensification Predictability Utilizing Statistical Models.” Weather and Forecasting 30 (5): 1374–1396. doi:https://doi.org/10.1175/WAF-D-15-0032.1.
- Knutson, T. R., J. Sirutis, M. Zhao, R. Tuleya, M. Bender, G. Vecchi, G. Villarini, and D. Chavas. 2015. “Global Projections of Intense Tropical Cyclone Activity for the Late Twenty-First Century from Dynamical Downscaling of CMIP5/RCP4.5 Scenarios.” Journal of Climate 28 (18): 7203–7224. doi:https://doi.org/10.1175/JCLI-D-15-0129.1.
- Lin, I. I., C. C. Wu, I. F. Pun, and D. S. Ko. 2008. “Upper-Ocean Thermal Structure and the Western North Pacific Category 5 Typhoons: Part I: Ocean Feature and the Category 5 Typhoons’ Intensification.” Monthly Weather Review 136 (9): 3288–3306. doi:https://doi.org/10.1175/2008MWR2277.1.
- Mainelli, M., M. Demaria, L. K. Shay, and G. Goni. 2008. “Application of Oceanic Heat Content Estimation to Operational Forecasting of Recent Atlantic Category 5 Hurricanes.” Weather and Forecasting 23 (1): 3–16. doi:https://doi.org/10.1175/2007WAF2006111.1.
- Metro, Tokyo. 2018. Area of Expected Flood of Storm Surge. Japan: Tokyo Metro. material3.pdf, 22. http://www.metro.tokyo.jp/tosei/hodohappyo/press/2018/03/30/03.html Accessed 20 December 2019.
- Mitsuta, Y., and T. Fulii. 1987. “Analysis and Synthesis of Typhoon Wind Pattern over Japan.” Bulletin of the Disaster Prevention Research Institute, Kyoto University 37 (4): 169–185.
- Mizuta, R., O. Arakawa, T. Ose, S. Kusunoki, H. Endo, and A. Kitoh. 2014. “Classification of CMIP5 Future Climate Responses by the Tropical Sea Surface Temperature Changes.” Scientific Online Letters on the Atmosphere 10: 167–171. doi:https://doi.org/10.2151/sola.2014-035.
- Mori, N., N. Ariyoshi, T. Shimura, T. Miyashita, and J. Ninomiya. 2021. “Future Projection of Maximum Potential Storm Surge Height at Three Major Bays in Japan Using the Maximum Potential Intensity of a Tropical Cyclone.” Climate Change 164 (3–4): 25. doi:https://doi.org/10.1007/s10584-021-02980-x.
- Mori, N., and T. Takemi. 2016. “Impact Assessment of Coastal Hazards Due to Future Changes of Tropical Cyclones in the North Pacific Ocean.” Weather and Climate Extremes 11: 53–69. doi:https://doi.org/10.1016/j.wace.2015.09.002.
- Moss, R. H., J. A. Edmonds, K. A. Hibbard, M. R. Manning, S. K. Rose, D. P. van Vuuren, T. R. Carter, et al. 2010. “The Next Generation of Scenarios for Climate Change Research and Assessment.” Nature 463 (7282): 747–756. doi:https://doi.org/10.1038/nature08823.
- Murakami, H., R. Mizuta, and E. Shindo. 2012. “Future Changes in Tropical Cyclone Activity Projected by Multi-Physics and Multi-SST Ensemble Experiments Using the 60-km-mesh MRI-AGCM.” Climate Dynamics 39 (9–10): 2569–2584. doi:https://doi.org/10.1007/s00382-011-1223-x.
- Myers, V.A. 1954. “Characteristics of United States Hurricanes Pertinent to Levee Design for Lake Okeechobee, Florida.” Hydro-Meteorological Report 32. U.S. Weather Bureau, U.S. Government Printing Office, 1–106.
- National Disaster Risk Reduction and Management Council (NDRRMC). 2014. “SitRep No. 108 Effects of Typhoon “YOLANDA” (HAIYAN)”. Technical report. National Disaster Risk Reduction and Management Council, NDRRMC Building, Camp General Emilio Aguinaldo, Quezon City, Philippine.
- Sato, T., F. Kimura, and A. Kitoh. 2007. “Projection of Global Warming onto Regional Precipitation over Mongolia Using a Regional Climate Model.” Journal of Hydrology 333 (1): 144–154. doi:https://doi.org/10.1016/j.jhydrol.2006.07.023.
- Sato, T. 2010. “Pseudo Global Warming Experiments.” Tenki 57: 37–38.
- Shade, L. R., and K. A. Emanuel. 1999. “The Ocean’s Effect on the Intensity of Tropical Cyclones: Results from a Simple Coupled Atmosphere-Ocean Model.” Journal of Atmospheric Sciences 56 (4): 642–651. doi:https://doi.org/10.1175/1520-0469(1999)056<0642:TOSEOT>2.0.CO;2.
- Shea, J. D., and M. W. Gray. 1973. “The Hurricane’s Inner Core Region. I. Symmetric and Asymmetric Structure.” Journal of Atmospheric Sciences 30 (8): 1544–1564. doi:https://doi.org/10.1175/1520-0469(1973)030<1544:THICRI>2.0.CO;2.
- Smith, K. R., M. T. Montgomery, and N. V. Sang. 2009. “Tropical Cyclone Spin-Up Revisited.” Quarterly Journal of the Royal Meteorological Society 135 (642): 1321–1335. doi:https://doi.org/10.1002/qj.428.
- Takagi, H., and W. Wu. 2015. “Maximum Wind Radius Estimated by the 50 Kt Radius: Improvement of Storm Surge Forecasting over the Western North Pacific.” National Hazards and Earth System Sciences 16 (3): 705–717. doi:https://doi.org/10.5194/nhess-16-705-2016.
- Takayabu, I., K. Hibino, H. Sasaki, H. Shiogama, N. Mori, Y. Shibutani, and T. Takemi. 2015. “Climate Change Effects on the Worst-Case Storm Surge: A Case Study of Typhoon Haiyan.” Environmental Research Letters 10 (6): 064011. doi:https://doi.org/10.1088/1748-9326/10/8/089502.
- Takemi, T., R. Ito, and O. Arakawa. 2016. “Robustness and Uncertainty of Projected Changes in the Impacts of Typhoon Vera (1959) under Global Warming.” Hydrological Research Letters 10 (3): 88–94. doi:https://doi.org/10.3178/hrl.10.88.
- Toyoda, M., J. Yoshino, and T. Kobayashi. 2015. “Numerical Experiments of Typhoon Haiyan (2013) and Its Storm Surge Using a High-Resolution Coupled Typhoon-Ocean Model.” Journal of Japan Society of Civil Engineers, Series B2 (Coastal Engineering) 71 (2): 463–468. in Japanese. doi:https://doi.org/10.2208/kaigan.71.I_463.
- Toyoda, M., J. Yoshino, and T. Kobayashi. 2016. “Ensemble Future Projections of Storm Surge in the Leyte Gulf, Philippines, by Pseudo-Global Warming Experiments.” Journal of Japan Society of Civil Engineers, Series B2 (Coastal Engineering) 72 (2): 1483–1488. in Japanese. doi:https://doi.org/10.2208/kaigan.72.I_1483.
- Toyoda, M., J. Yoshino, and T. Kobayashi. 2017. “Comparison of Future Change and Its Uncertainty on Typhoon Intensity between Typhoon Haiyan (2013) and Typhoon Melor (2009).” Journal of Japan Society of Civil Engineers, Series B2 (Coastal Engineering) 73 (2): 217–222. in Japanese. doi:https://doi.org/10.2208/kaigan.73.I_217.
- Tsuboki, K., M. K. Yoshioka, T. Shinoda, M. Kato, S. Kanada, and A. Kitoh. 2015. “Future Increase of Supertyphoon Intensity Associated with Climate Change.” Geophysical Research Letters 42 (2): 646–652. doi:https://doi.org/10.1002/2014GL061793.
- Wang, X., C. Wang, L. Zhang, and X. Wang. 2015. “Multidecadal Variability of Tropical Cyclone Rapid Intensification in the Western North Pacific.” Journal of Climate 28: 3806–3820. doi:https://doi.org/10.1175/JCLI-D-14-00400.1.
- Wang, Y., J. D. Kepert, and G. J. Holland. 2001. “The Effect of Sea Spray Evaporation on Tropical Cyclone Boundary Layer Structure and Intensity.” Monthly Weather Review 129 (10): 2481–2500. doi:https://doi.org/10.1175/1520-0493(2001)129<2481:TEOSSE>2.0.CO;2.
- Webster, P. J., G. J. Holland, J. A. Curry, and H. R. Chang. 2005. “Changes in Tropical Cyclone Number, Duration, and Intensity in a Warming Environment.” Science 309 (5742): 1844–1846. doi:https://doi.org/10.1126/science.1116448.
- Wong, M., L., M., and J., C., L. Chan. 2004. “Tropical Cyclone Intensity in Vertical Wind Shear.” Journal of the Atmospheric Sciences 61 (15): 1859–1876. doi:https://doi.org/10.1175/1520-0469(2004)061<1859:TCIIVW>2.0.CO;2.
- Yamada, H., Q. Moteki, and M. Yoshizaki. 2010. “The Unusual Track and Rapid Intensification of Cyclone Nargis in 2008 under a Characteristic Environmental Flow over the Bay of Bengal.” Journal of the Meteorological Society of Japan 88 (3): 437–453. doi:https://doi.org/10.2151/jmsj.2010-311.
- Yasuda, T., S. Nakajo, S. Y. Kim, H. Mase, N. Mori, and K. Horsburgh. 2014. “Evaluation of Future Storm Surge Risk in East Asia Based on State-of-the-Art Climate Change Projection.” Coastal Engineering 83: 65–71. doi:https://doi.org/10.1016/j.coastaleng.2013.10.003.
- Yoshino, J., J. Strachan, and P. L. Vidale. 2012. “Numerical Simulations of the Life Cycle of Super Typhoon with High-Resolution and High-Efficiency.” Journal of Japan Society of Civil Engineers, Series B2 (Coastal Engineering) 68 (2): 1211–1215. doi:https://doi.org/10.2208/kaigan.68.I_1211.
- Yoshino, J., S. Arakawa, M. Toyoda, and T. Kobayashi. 2015. “Inter-comparison of Global Warming Scenarios for Typhoon Intensity Change Using a High-Resolution Typhoon Model.” Journal of Japan Society of Civil Engineers, Series B2 (Coastal Engineering) 71 (2): 1519–1524. in Japanese. doi:https://doi.org/10.2208/kaigan.71.I_1519.
- Zhang, D. L., and E. Altshuler. 1999. “The Effects of Dissipative Heating on Hurricane Intensity.” Monthly Weather Review 127 (12): 3032–3038. doi:https://doi.org/10.1175/1520-0493(1999)127<3032:TEODHO>2.0.CO;2.