
 ?Mathematical formulae have been encoded as MathML and are displayed in this HTML version using MathJax in order to improve their display. Uncheck the box to turn MathJax off. This feature requires Javascript. Click on a formula to zoom.
ABSTRACT
It is imperative to understand the significance of the early diagnosis of pneumonia using a convolutional neural network (CNN) to reduce the processing time and increase the quality of treatment that is delivered to the patient. We have implemented transfer learning for processing of available datasets and constructed an ensemble of 3-CNNs: SqueezeNet, ResNet-50 and EfficientNet-b0. In this work, a multiclassification model has been built that can help in early pneumonia diagnosis. The chest X-rays of patients have been classified in 2-stages. In the first stage, the EfficientNet-b0 convolutional neural network with 99% accuracy is employed to diagnose whether the patient’s chest X-ray is Normal/Abnormal. If the output of the first stage is found abnormal then the chest X-ray is processed to the second stage wherein ResNet-50 with 97% accuracy is employed to diagnose the pneumonia type, pneumonia bacteria/pneumonia virus. Further, performance metrics have been computed from the confusion matrix for both stages of X-ray. Also, it is imperative to mention that a pneumonia diagnosis app has been developed in Matlab-2023 for the ease of patients who can self-evaluate the scan report and understand the course of clinical treatment.
1. Introduction
Pneumonia is an acute pulmonary infection that can be caused by bacteria, viruses, or fungi and infects the lungs, causing inflammation of the air sacs and pleural effusion, a condition in which the lung is filled with fluid. It accounts for more than 15% of deaths in children under the age of 5 years (WHO Pneumonia. World Health Organization Citation2019). Pneumonia is most common in underdeveloped and developing countries, where overpopulation, pollution and unhygienic environmental conditions exacerbate the situation, and medical resources are scarce. Pneumonia is regarded as an acute pulmonary infection caused due to viruses, bacteria, or fungi and infects the lungs, resulting in pleural effusion (lung is filled with fluid) and swelling of air sacs. Pneumonia is prominent in developing and underdeveloped countries, where pollution, overpopulation and unhygienic environments aggravate the condition, and medical resources are scarce (Mizgerd Citation2006, Citation2012).
In developing and underdeveloped countries many poor families lack of adequate vaccination programs and limited access to medical facilities results in undetected pneumonia and consequently aggravating the condition (Bhutta Citation2006). Also, it must be noted that numerous studies (Liang et al. Citation2019; Dutta and Jinsart Citation2020; Lu et al. Citation2020) have illustrated that several developing countries having higher levels of air pollution (especially combustion-derived particulate matter) are prone to significant exposure to particulate matter- PM-2.5, NO2 and SO2 which were found to be the primary source of increased incidence of pneumonia (Dutta et al. Citation2022). Furthermore, lack of personal hygienic practices such as hand washing, oral hygiene, lack of socio-economic status in developing countries increases the probability of contracting pneumonia infection (Walker et al. Citation2013) Pneumonia is primarily due to microbial infection, the disease development is dependent on the response of the host. Pneumonia is limited to lungs within the host by definition; however, this disease is regarded as complex as it includes the various physiological systems that are working synchronously. Even though pneumonia is considered an acute occurrence, it is driven by pre-existing long-term conditions and has a prolonged impact on health. Hence, pneumonia is considered more than an acute lower respiratory disease which is could inflict potential damage to the respiratory system (Mizgerd Citation2006, Citation2012; WHO Pneumonia. World Health Organization Citation2019). Pneumonia infection in the lungs affects the respiratory system due to the accumulation of exudative fluid in pulmonary parenchyma (consisting of thin-walled alveoli) which consequently impacts the respiration process of gas exchange and further leads to breathing difficulties (Murray and Lopez Citation1996). Hence, early diagnosis of pneumonia is pivotal in saving the patient’s health and increasing survival rates. Medical imaging techniques have proved quintessential for the identification and treatment of lung diseases (Kundu et al. Citation2021).
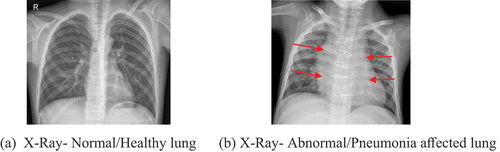
Radiological examination of the lungs is done via X-rays, magnetic resonance imaging (MRI), or computed tomography (CT), is used for diagnosis purposes. X-ray imaging constitutes a relatively inexpensive and non-invasive inspection of the lungs. shows the diagnosis of healthy (indicated as normal) and pneumonia-affected lung (indicated as abnormal). The white spots (indicated as red arrows) in are referred to as infiltrates, which is important for differentiating pneumonia-affected and healthy lungs (). However, the variability of the subject impacts pneumonia detection using chest X-ray (Neuman et al. Citation2012; Williams et al. Citation2013). Hence, it becomes imperative to design an automated pneumonia detection system. In this research work, an ensemble of deep-learning networks using CNN has been developed using optimised hyperparameters (learning rate, batch size, validation frequency) for precise and accurate multiclassification of chest X-ray images.
Figure 1. Automated pneumonia identification using CNN models.
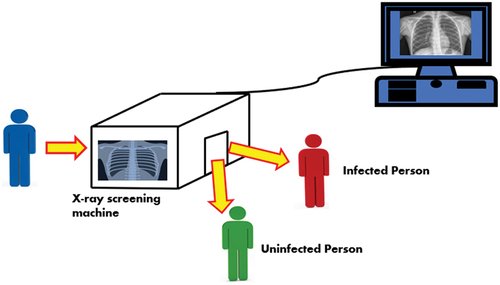
Figure 2. (A) X-Ray- Normal/Healthy lung (b)X-Ray- Abnormal/pneumonia affected lung.
Deep learning is a crucial artificial intelligence tool (AI), that plays a pivotal role in resolving various complex computer image recognition issues (Lal et al. Citation2021; Rauf et al. Citation2021). It must be noted that CNN-based models have been widely employed for image classification problems (Shah et al. Citation2020). However, these models perform with great accuracy only if it is provided with a large dataset. Specifically, for biomedical image classification, such a large labelled dataset is hard to obtain as it requires specialist doctors to classify individual images, which would prove to be tedious and expensive. Transfer learning technique circumvents this issue. In this method, to solve a small dataset problem, the trained model of the large dataset is reutilised and their network weights are reapplied. CNN models are trained in various large datasets like ImageNet (Deng et al. Citation2009) comprising more than 14 million images and are generally most frequently used for building biomedical image multiclassification tasks. Zhang et al. (Zhang et al. Citation2022). developed a novel deep learning architecture (deep COVID network (DC-Net)) for diagnosis of COVID-19. Zhang et al. (Zhang et al. Citation2022) developed three deep learning networks namely, DC-Net-S, DC-Net-E and DC-Net-R by replacing the fully connected layer in AlexNet with three classifiers: spiking neural network (SNN), extreme learning machine (ELM) and random vector functional link (RVFL) and found that DC-Net-R achieves an average accuracy of 90.91%. Wang et al. (Wang et al. Citation2023) had implemented adaptive chaotic particle swarm optimisation (ACP) for developing a novel neural network for pneumonia diagnosis and their final trained model wavelet entropy (WE-layer) ACP-based network (WACPN) gave an accuracy of 91%.
Numerical stability is pivotal factor that determines the reliability and robustness of deep neural network (Kloberdanz et al. Citation2022). A unstable numerical method produces larger changes in output data for smaller changes in input data that leads to many errors. Specifically in deep learning, high precision floating point computations is implemented to reach reliable decisions and required to use large integers to process huge datasets. Numerical instability in deep learning during training can trigger underflow or overflow and truncation. Such errors are then propagates through iterations of training, resulting in low-quality models and wastage computational resources (de Jong Citation1977).
The other significant problems affecting the numerical stability of deep neural network is the vanishing and exploding gradients. Vanishing gradient problem depends on the choice of the activation function such as sigmoid-s that is appended after each layer’s linear operations. The activation function sigmoid’s gradient vanishes in both cases where inputs are small and large. Also, when backpropagating through numerous layers, unless we are in the Goldilocks zone (Fort and Scherlis Citation2018), where the inputs to many of the sigmoids are close to zero, the gradients of the overall product might vanish. When the neural network boasts of numerous layers, the gradient would mostly be cut off at some layer resulting in numerical instability. Indeed, this was a major problem in deep network training. As a result of which ReLUs, which are more stable (but less neurally plausible), have emerged as the default choice for practitioners. Exploding Gradients is the opposite problem in deep neural networks, when gradients explode. The primary cause of exploding gradients is due to too large of a weight initialisation and update. Due to exploding gradients, the build-up of larger derivatives that consequently makes the model as unstable and also reduces the capacity of learning effectively. The large variations in the models weights generates a very unstable network, which at extreme values the weights are so large that it results in overflow and generates in NaN weight values of which cannot be updated. On the contrary, the build-up of smaller gradients generates a model that is unable to learn meaningful insights as the biases and weight of the initial layers, which would understand the essential features from the input data, would not be effectively updated. In the worst scenario, the network training would essentially stop as the gradient would become 0.
The ensemble learning method is employed to reduce variance as well as a bias for multi-classifications that are fused to generate the final prediction of the test sample. It is implemented to obtain distinguishing features from base classifiers and hence, generate more precise results. Some of the popular ensemble techniques that have been applied are majority voting, average probability and weighted average probability. The average probability allocates priority equally for each constituent base learner. However, for a particular problem, a certain base classifier may be able to capture information better than others. Therefore, optimisation of hyperparameters of CNN is imperative to enhance its classification accuracy. The CNN models could be used for automated pneumonia identification as shown in . In this research work, the comparative performance analysis of 3-pretrained CNN and optimisation of deep neural networks for multiclassification of chest X-ray images has been implemented which has not been done by in previous research work. Also, the development of a clinical diagnosis desktop app based on CNN for 2-stage multiclassification of chest X-rays has not been implemented in the previous literature. The implementation of deep neural network (with different optimisers-sgdm, rmsprop, adam & batch size-10/8/6) for a two-stage classification approach for pneumonia diagnosis using pre-trained CNN has not been implemented in previous literature for high accuracies of 99% (1st stage) using EfficientNet-b0 (adam solver, batch size-8), 97% (2nd stage) ResNet-50 using (sgdm solver, batch size-6) see 10 & 12]
2. Deep neural network solvers
2.1. Stochastic gradient descent with momentum (SGDM)
The SGDM solves oscillates on the descent with the steepest path towards the optimal value. So, in order to reduce the oscillation, a momentum term is added. The SGDM with update of momentum term is,
γ computes the contribution value of the previous gradient to the current iteration. Α defines the initial learning rate for all deep learning net algorithms. The impact of the learning rate varies for the different optimisation algorithms (Bishop and M Citation2006).
2.2. Root mean squared propagation (RMSProp)
The SGDM implements a single learning rate for all parameters. But, the numerous optimisation algorithms improve the network performance by employing diverse learning rates that vary in accordance with the parameter and adapt to the optimisation of the loss function. The RMS prop applies this methodology and moves the average of the element-wise squares of the parameter gradient.
β2 denotes the decay rate of the moving average. The value of β2 can be specified by using the Squared Gradient Decay Factor. RMS prop normalises each parameter independently by employing the moving average.
where there is element-wise division. The application of RMS prop decreases the parameter’s learning rate with large gradients while also increasing the learning rates of small gradient parameters. ɛ is a small constant added to avoid division by zero (Bishop and M Citation2006).
RMSProp is an extension of Adaptive gradient based learning algorithms that employs a moving average (MA) of the partial derivatives instead of the sum in the calculation of the η for each instance as explained in Equation 4 & 5, where S is the squared of decay average.
RMS prop is available to calculate learning rates for each individual parameter. Furthermore, individual variations for each parameter could be computed and packed independently.
2.3. Adaptive moment estimation (Adam)
Adam (derived from adaptive moment estimation) implements a parameter update that is analogous to the RMS prop, but there is an additional term of momentum. It produces a moving average element-wise of both the parameter gradients and their squared values.
The values of β1 and β2 decay rates can be quantified using the Gradient Decay Factor and Squared Gradient Decay Factor. Further, Adams uses the moving averages to update the network parameters.
If there are comparable gradients over many iterations, then the moving average of the gradient supports in the parameter updates to capture momentum in a particular direction. However, if the gradients comprise of typically noise, then the moving average of the gradient reduces to a smaller value, hence making parameter update values also smaller (Kingma and Ba Citation2014).
3. Convolution neural network models
3.1. Squeeze net
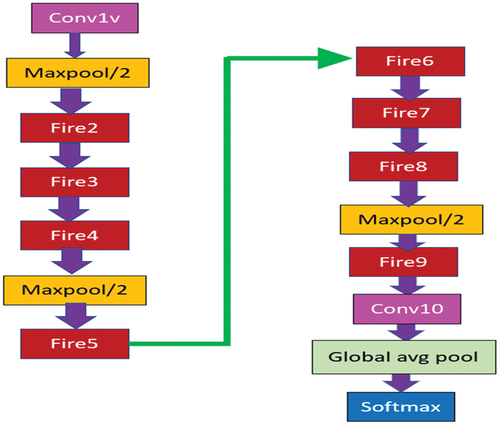
SqueezeNet contains fire module () that decreases network parameters by replacing 3 × 3 filters with 1 × 1 filters and thereby reduces the number of input channels to 3 × 3 filters. It places down sampling late in the network so that convolution layers cover larger activation maps. Deep compression is used to scale the model. In comparison to AlexNet, SqueezeNet reduces the number of parameters by nearly 50 times while ensuring that is no loss in accuracy and also the architecture and also the volume of the model is compressed to about 510 times the original volume (Iandola et al. Citation2016). The network architecture of SqueezeNet is shown in . The network architecture of SqueezeNet is shown in .
Figure 3. Fire protection module in SqueezeNet.
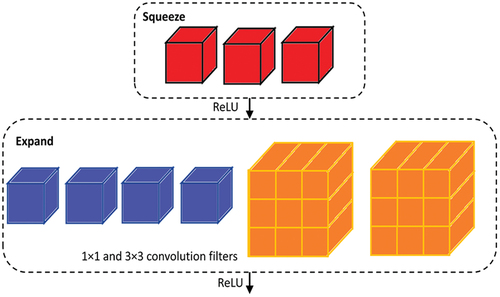
Figure 4. Schematic of SqueezeNet.
3.2. ResNet-50
The second pretrained deep neural network implemented in this manuscript is the ResNet-50 that had been proposed by Kaiming He et al. (He et al. Citation2016) in 2015. Due to its practicality and simplicity, several methods have been made on the basis of ResNet-50. ResNet has been employed in areas such as segmentation, detection and identification (He et al. Citation2016). The most significant problem affecting deep neural network training is the terms of numerical stability of the network’s parameters. This issue is known as the Exploding/Vanishing gradient issue. ResNet, due to its design, prevents all the occurrence of these problems in the network by skipping connections. The skip connections prevent the entry of (vanishing/exploding gradient) as they tend to behave as a gradient, allowing its flow without altering it by a large magnitude. In the context of the present network, it introduces a simple addition of the identity function to the output as shown in . In the aspect of architecture, if any layer results in damaging model performance in a plain network, it gets skipped due to the existence of the skip-connections as shown in .
Figure 5. Residual learning block.
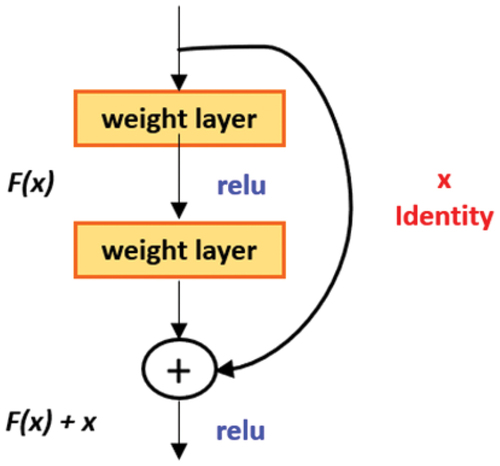
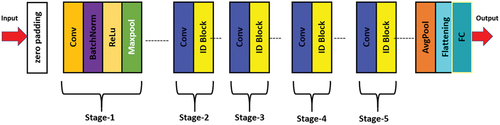
Figure 6. Schematic representation of ResNet-50 architecture.
3.3. Efficient net-b0
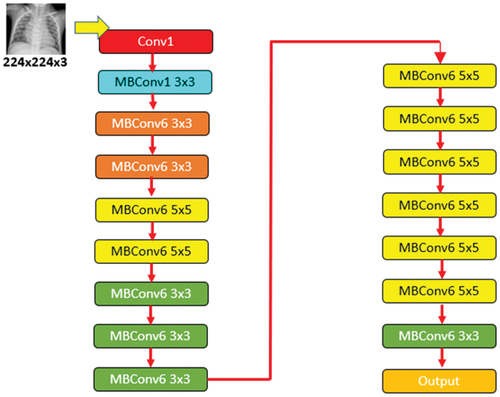
The third pre-trained deep neural network that has been applied for image classification is EfficientNet-b0. EfficientNet-b0 is the base model of this group that takes 224 × 224 pixels images as input (Tan and Le Citation2019). This EfficientNet-b0 architecture employs mobile inverted bottleneck convolution (MBConv) that is comparable to MobileNetV2 though it is little large due to higher floating-point operation per second (FLOP) budget. Usually, the EfficientNet-based models are known for their higher accuracy and efficiency over prevailing state-of-the-art CNN models, reducing parameter size and FLOPS by their order of magnitude. While other CNN models apply ReLU that acts as an activation function, EfficientNet models use Swish that is a product of a linear activation function and sigmoid. Additionally, EfficientNet-B0 deploys the inverted residual block that decreases the trainable parameters by a large number (Hridoy et al. Citation2021). The EfficientNet-b0 architecture is shown in .
Figure 7. EfficientNet-b0 schematic.
4. Methodology
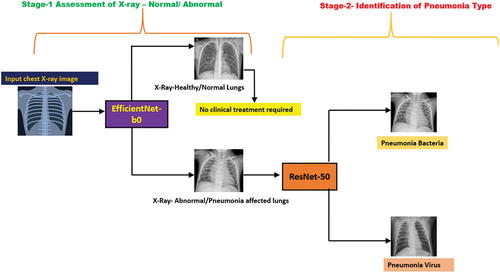
There are two stages of chest X-ray identification done in this research work. It is imperative to note that all CNN models implemented in this research work have been pre-trained on more than a million images from the ImageNet database (Deng et al. Citation2009). In the first stage, all three pre-trained CNN models (SqueezeNet, ResNet-50 & EfficientNet-b0) were tested on the image dataset consisting of 5863 chest X-ray images obtained from public data sources (https://www.kaggle.com/datasets/paultimothymooney/chest-xray-pneumonia) (Kermany et al. Citation2018) for analysing whether the chest X-ray is Normal/Healthy lung or Abnormal/Pneumonia affected lung. The three pre-trained CNN models were then optimised for maximum accuracy by varying the batch size while keeping the learning rate, validation frequency and epoch constant. If the output of the first stage was found to be Abnormal/Pneumonia affected lung then it would be sent for the second stage which is the diagnosis, this identifies the pneumonia type, i.e. whether it is pneumonia bacteria or pneumonia virus – as shown in .
Figure 8. Multiclassification of chest X-ray for pneumonia identification using CNN.
Furthermore, the pre-trained CNNs were optimised in the second stage of chest X-ray classification for maximum classification accuracy.
5. Results
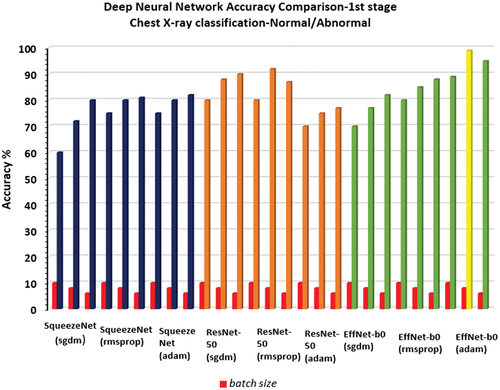
During the first stage of chest X-ray classification, all the pre-trained deep neural networks (SqueezeNet, ResNet-50, EfficientNet-b0) were optimised (learning rate-0.001, validation frequency = 5, epoch-10, batch size-10/6/8) to classify the chest X-Ray as Normal/Abnormal using the available image dataset. It should be noted that EfficientNet-b0 (adam solver, batch size-8) gave the maximum accuracy of 99% for a test sample dataset consisting of 100 chest X-ray images (see ) while the other deep neural networks SqueezeNet produced a maximum accuracy of 82%, ResNet-50 produced maximum accuracy of 92% as shown in .
Figure 9. Chest-xray classification-1st stage results using (a) EfficientNet-b0, (b) SqueezeNet, (c) ResNet-50.
Figure 10. Confusion matrix for stage-1 chest X-ray classification using EfficientNet-b0 with accuracy 99%.
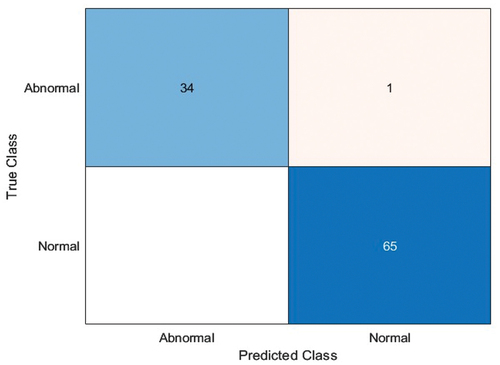
Chest X-ray stage-1 classification done using EfficientNet-b0 in comparison to SqueezeNet & ResNet-50 is shown in . The highest accuracy was obtained for EfficientNet-b0 as 99% for the first-stage classification of chest X-ray as Normal/Healthy lung or Abnormal/Pneumonia affected lung.
Figure 11. Comparison of results of 1st stage for all the 3-pretrained deep neural network(SqueezeNet, ResNet-50, EfficientNet-b0).
During the second stage of chest X-ray classification for identification of pneumonia type (pneumonia bacteria/pneumonia virus), all the pretrained deep neural networks (SqueezeNet, ResNet-50, EfficientNet-b0) were optimised (learning rate-0.001, validation frequency = 5, epoch-10, batch size-10/6/8) to classify the chest X-Ray using the available test image dataset consisting 100 chest X-ray images. It should be noted that ResNet-50 (sgdm solver, batch size-6) gave the maximum accuracy of 97% for a test sample dataset consisting of 100 chest X-ray images (see ) while the other deep neural networks SqueezeNet produced maximum accuracy of 77%, EfficientNet-b0 produced maximum accuracy of 78% as shown in .
Figure 12. Confusion matrix for 2nd stage- chest X-ray classification using EfficientNet-b0.
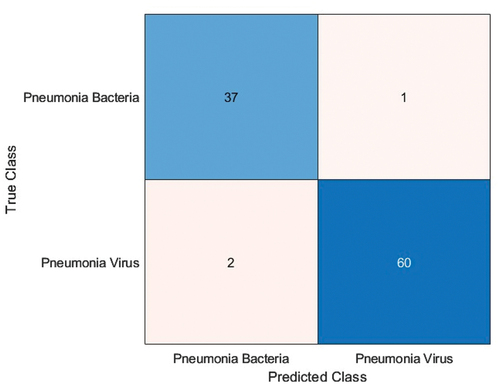
Figure 13. Comparison of results of 2nd stage for all the 3-pretrained deep neural network(SqueezeNet, ResNet-50, EfficientNet-b0).
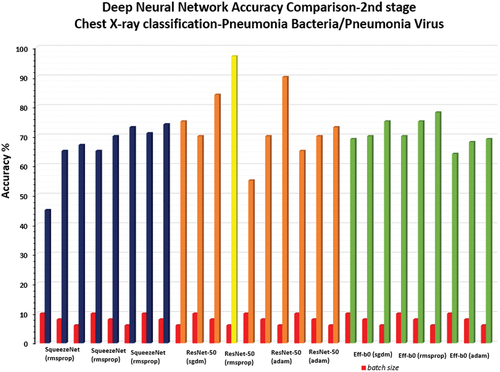
Figure 14. Chest-X ray classification- 2nd stage results using (a) ResNet-50, (b) SqueezeNet, (c) EfficientNet-b0.
Chest X-ray stage-2 classification (Pneumonia bacteria/Pneumonia virus) done using ResNet-50 in comparison to SqueezeNet & EfficientNet-b0 is shown in .
5.1. Performance metrics calculation
The performance metrics give a better understanding of the predictions in comparison to the accuracy performance metrics. From which depicts the confusion matrix of 1st & 2nd stage of chest X-ray classification, the parameters like Accuracy, Precision, Recall, F-1 score and specificity has been calculated (Dilshad et al. Citation2021) as shown in , which shows the performance metrics values of both EfficientNet-b0 and ResNet-50 networks.
Table 1. Performance metrics of EfficientNet-b0 & ResNet-50.
In medical diagnosis, it is imperative that the no of false negative cases is to be kept very minimal. The false negative rate is computed using the equation below.
TP- True positive, TN- True negative, FP- False positive, FN- False negative
The FNR value for both 1st and 2nd stage X-ray classification are very minimal as shown in Table-1, indicating great accuracy of the deep network model that has been trained.
6. Pneumonia diagnosis app development
For the implementation of clinical diagnosis app/tool in a distributed computing environment, the establishment of its service continuity is pivotal for its effectiveness. Vitabile et al. (Conti et al. Citation2021) have discussed about the bioinspired methodology for service-oriented network (SON) for improving robustness and network reliability while maintaining the continuity of service. They had implemented an embedded Field Programmable Gate Array (FPGA) prototyped SON for clinical imaging application.
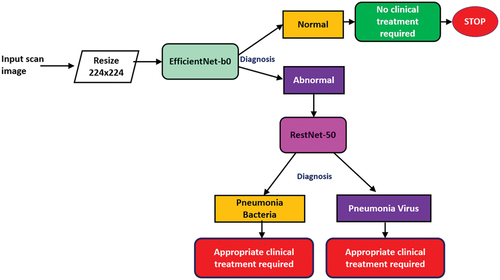
In this research work Matlab app has been developed for pneumonia diagnosis with the following concept, wherein the input chest X-ray scan image (jpg format) is fed into the app via the scan input button for the 1st stage classification (EfficientNet-b0) as Normal (Healthy lung)/Abnormal (Pneumonia affected lung), if the output of the 1st stage is Normal then there is no clinical treatment required, however if the output is Abnormal then the chest X-ray is fed into the 2nd stage diagnosis (RestNet-50) as Pneumonia Bacteria/Pneumonia Virus. The workflow of the app is described in the schematic diagram as shown in .
Figure 15. Workflow of pneumonia diagnosis app.
Conclusion
The pretrained deep neural networks, SqueezeNet, ResNet-50 and EfficientNet-b0 have been optimised and implemented for maximum accuracy in the multiclassification of chest X-rays using two stages.
In the first stage of chest X-ray classification, the EfficientNet-b0 (batch size-8, solver-adam) gave the maximum accuracy of 99% for 1st stage classification as Normal/Abnormal and other performance metrics of EfficientNet-b0 calculated using confusion matrix () were precision = 0.99, f1 score = 0.99 & recall = 0.99, while SqueezeNet (batch size-6, solver-adam) and ResNet-50 (batch size-8, solver-rms prop) gave an accuracy of 82% and 92%. In 2nd stage image classification as Pneumonia Bacteria/Pneumonia Virus ResNet-50 (batch size-6, solver-sgdm) gave the maximum accuracy of 97% and other performance metrics of ResNet-50 computed using confusion matrix () were precision = 0.99, f1 score = 0.99 & recall = 0.98 while SqueezeNet (batch size-6, solver-adam) and EfficientNet-b0 (batch size-6, solver-rms prop) gave an accuracy of 75% and 78%. This research work has large significance in the diagnosis of pneumonia that is vital to guarantee remedial treatment and increase rates of patient survival.
However, there are certain issues with deep learning models such as missing interpretable features as they are not inherently transparent. Interpretability of deep learning systems not only reveals any fault within the algorithms but also identifies other significant information in the imaging data that would not be noticed otherwise (Salahuddin et al. Citation2022).
Some of the known proven interpretability methods such as internal network representation (Bau et al. Citation2017; Natekar et al. Citation2020) would be implemented in future work of the deep learning-based CNN used in medical imaging data classification. This would increase its transparency of decision-making process and also would further enable the user to visualise the features learned by the different filters in CNN. Finally, this would inherently make the current deep learning-based CNN model more trustable in clinical setting.
Future work would be to implement larger number of classes of respiratory problems in addition to pneumonia for benefit of patient healthcare and also focus on integration of this clinical app with edge or cloud-based technology with higher service availability and security.
Acknowledgments
We deeply acknowledge Manipal Academy of Higher Education, Manipal Institute of Technology, Manipal for their constant support throughout the research work which was performed as part of employment. No funding was involved in this research work.
Disclosure statement
No potential conflict of interest was reported by the author(s)
Data availability statement
The data used to support the findings of this study are included within the article.
Additional information
Notes on contributors
G Divya Deepak
Dr. G Divya Deepak is an Assistant Professor-Selection Grade in the Department of Mechanical and Industrial Engineering at Manipal Institute of Technology, India. He has done his Masters from University of Windsor, Canada. His Ph.D research work is in the field of atmospheric pressure cold plasma jets for biomedical applications (in collaboration with Central Electronics Engineering Research Institute,Pilani (CSIR-CEERI) Govt of India). His current research interests include the topics related to Dielectric barrier discharge based cold plasma jets, Application of Machine Learning/Deep Learning Techniques for Biomedical Image Processing and Advanced Manufacturing Methods.
References
- Bau D, Zhou B, Khosla A, Oliva A, & Torralba A (2017). Network dissection: quantifying interpretability of deep visual representations. In 2017 IEEE Conference on Computer Vision and Pattern Recognition (CVPR) (pp. 3319–11). Honolulu, HI, USA.
- Bhutta ZA. 2006. Childhood pneumonia in developing countries. BMJ. 333(7569):612–613. doi: 10.1136/bmj.38975.602836.be.
- Bishop S, M C. 2006. Pattern Recognition and machine learning. New York, NY: Springer.
- Conti V, Militello C, Rundo L, Vitabile S. 2021. A novel bio-inspired approach for high-performance management in service-oriented networks. IEEE Trans Emerg Topics Comput. 9(4):1709–1722. doi: 10.1109/TETC.2020.3018312.
- de Jong LS. 1977. Towards a formal definition of numerical stability. Numer Math. 28(2):211–220. doi: 10.1007/BF01394453.
- Deng J, Dong W, Socher R, Li L, Li K, & Fei-Fei L (2009). Imagenet: A large-scale hierarchical image database. Proceedings of the 2009 IEEE Conference on Computer Vision and Pattern Recognition; Miami, FL, USA. p. 248–255.
- Dilshad S, Singh N, Atif M, Hanif A, Yaqub N, Farooq WA, Ahmad H, Chu YM, Masood MT. 2021. Automated image classification of chest X-rays of COVID-19 using deep transfer learning. Results In Physics. 28:104529. doi: 10.1016/j.rinp.2021.104529.
- Dutta A, Jinsart W. 2020. Risks to health from ambient particulate matter (PM2.5) to the residents of Guwahati city, India: an analysis of prediction model. Hum Ecol Risk Assess. 27(4):1094–1111. doi: 10.1080/10807039.2020.1807902.
- Dutta A, Jinsart W, Xu Y. 2022. Air pollution in Delhi, India: It’s status and association with respiratory diseases. PLoS ONE. 17(9):e0274444. doi: 10.1371/journal.pone.0274444.
- Fort S, Scherlis A. 2018. The goldilocks zone: towards better understanding of neural network loss landscapes arXiv (Cornell University) 33(1):3574–358110.48550/arxiv.1807.02581
- He K, Zhang X, Ren S, & Sun J (2016). Deep residual learning for image Recognition. Proceedings of the 2016 IEEE Conference on Computer Vision and Pattern Recognition; Las Vegas, NV, USA.
- Hridoy RH, Akter F, Mahfuzullah M, & Ferdowsy F (2021). A Computer Vision-based food recognition approach for controlling. Proceedings of the 2021 International Conference on Information Technology (ICIT); Amman, Jordan.
- Iandola FN, Han S, Moskewicz MW, Ashraf K, Dally WJ, Keutzer K. 2016. SqueezeNet: AlexNet-level accuracy with 50x fewer parameters and <0.5 MB model size. arXiv. arXiv:1602.07360.
- Kermany D, Zhang K, Goldbaum M. 2018. Labeled optical coherence tomography (OCT) and chest X-Ray images for classification. Mendeley Data. V2. doi: 10.17632/rscbjbr9sj.2.
- Kingma D, Ba J. 2014. Adam: a method for stochastic optimization Proceedings of the 3rd International Conference for Learning Representations; San Diego. p. 1412.6980.
- Kloberdanz E, Kloberdanz KG, & Le W (2022). DeepStability. Proceedings of the 44th International Conference on Software Engineering. 10.1145/3510003.3510095
- Kundu R, Das R, Geem ZW, Han G-T, Sarkar R. 2021. Pneumonia detection in chest xray images using an ensemble of deep learning models. PLoS ONE. 16(9):e0256630. doi: 10.1371/journal.pone.0256630.
- Lal S, Rehman S, Shah J, Meraj T, Rauf H, Damasˇevičius R, Mohammad M A, Abdhul Kareem KH. 2021. Adversarial attack and defence through adversarial training and feature fusion for diabetic retinopathy Recognition. Sensors. 21(11):3922. PMID: 34200216. doi: 10.3390/s21113922.
- Liang L, Cai Y, Barratt B, Lyu B, Chan Q, Hansell A, Xie W, Zhang D, Kelly FJ, Tong Z. 2019. Associations between daily air quality and hospitalisations for acute exacerbation of chronic obstructive pulmonary disease in Beijing, 2013–17: an ecological analysis. Lancet Planet Health. 3(6):e270–e279. doi: 10.1016/s2542-5196(19)30085-3.
- Lu X, Zhang S, Xing J, Wang Y, Chen W, Ding D, Wang Y, Duan L, Hao J. 2020. Progress of air pollution control in China and its challenges and opportunities in the ecological civilization era. Engineering. 6(12):1423–1431. doi: 10.1016/j.eng.2020.03.014.
- Mizgerd JP Lung infection–a public health priority. PLoS Med 3: e76, 2006. 10.1371/journalpmed0030076
- Mizgerd JP. 2012. Respiratory infection and the impact of pulmonary immunity on lung health and disease. Am J Respir Crit Care Med. 186(9):824–829. doi: 10.1164/rccm.201206-1063PP.
- Murray CJ, Lopez AD. 1996. Evidence-based health policy–lessons from the global burden of disease study. Sci. 274(5288):740–743. doi: 10.1126/science.274.5288.740.
- Natekar P, Kori A, Krishnamurthi G. 2020. Demystifying brain tumor segmentation networks: interpretability and uncertainty analysis. Front Comput Neurosci. 14. doi: 10.3389/fncom.2020.00006.
- Neuman M, Lee E, Bixby S, Diperna S, Hellinger JMarkowitz R, Sabah S, Michael MC, Samir SS. 2012. Variability in the interpretation of chest radiographs for the diagnosis of pneumonia in children. J Hosp Med. 7(4):294–298. PMID: 22009855. doi: 10.1002/jhm.955.
- Rauf HT, Lali MIU, Khan MA, Kadry S, Alolaiyan H, Razaq A, Irfan R. 2021. Time series forecasting of COVID-19 transmission in Asia Pacific countries using deep neural networks. Personal And Ubiquitous Computing. 27(3):733–750. doi: 10.1007/s00779-020-01494-0.
- Salahuddin Z, Woodruff HC, Chatterjee A, Lambin P. 2022. Transparency of deep neural networks for medical image analysis: a review of interpretability methods. Comput Biol Med. 140:105111. doi: 10.1016/j.compbiomed.2021.105111.
- Shah U, Abd-Alrazeq A, Alam T, Househ M, Shah Z. 2020. An efficient method to predict pneumonia from chest X-Rays using deep learning approach. PubMed. 272:457–460.
- Tan M, Le Q. 2019. EfficientNet: rethinking model scaling for convolutional neural networks. Proceedings of the 36th International Conference on Machine Learning; California. arXiv:1905.11946.
- Walker CLF, Rudan I, Liu L, Nair H, Τheodoratou E, Bhutta ZA, O’Brien KL, Campbell H, Black RE. 2013. Global burden of childhood pneumonia and diarrhoea. Lancet. 381(9875):1405–1416. doi: 10.1016/s0140-6736(13)60222-6.
- Wang S, Khan MA, Zhu Z, Zhang Y. 2023. WACPN: a neural network for pneumonia diagnosis. Comput Syst Sci Eng. 45(1):21–34. doi: 10.32604/csse.2023.031330.
- WHO Pneumonia. World Health Organization. (2019), https://www.who.int/news-room/fact-sheets/detail/pneumonia
- Williams G, Macaskill P, Kerr M, Fitzgerald D, Isaacs D, Codarini M, McCaskill M,Prelog, K,Craig JC. 2013. Variability and accuracy in interpretation of consolidation on chest radiography for diagnosing pneumonia in children under 5 years of age. Pediatr Pulmonol. PMID: 23997040. 48:1195–1200. doi:10.1002/ppul.22806.
- Zhang X, Lu S, Wang SH. 2022. Diagnosis of COVID-19 pneumonia via a novel deep learning architecture. J Comput Sci Technol. 37(2):330–343. doi:10.1007/s11390-020-0679-8.