
 ?Mathematical formulae have been encoded as MathML and are displayed in this HTML version using MathJax in order to improve their display. Uncheck the box to turn MathJax off. This feature requires Javascript. Click on a formula to zoom.
Abstract
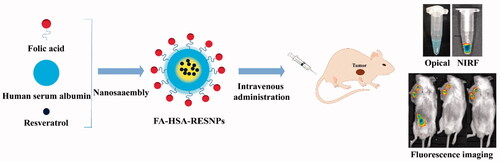
This work investigated the preparation of specific targeted drug delivery systems in cancer chemotherapy by folate conjugated human serum albumin nanoparticles encapsulated resveratrol (RES) nanoparticles (FA-HSA-RESNPs). FA was coupled to HSA, and RES was encapsulated in FA-conjugated HSA by high pressure fluid nano-homogeneous emulsification. The average particle size and polydispersity index of NPs prepared under optimal conditions were 102.1 ± 4.9 nm and 0.001. The drug capsulation efficiency and drug loading efficiency were 98.36 and 14.66%, respectively. The analysis of the results of the physical characterization showed that the RES was present in the FA-HSA-RESNPs in an amorphous state. In vitro drug-release study showed that the NPs can release the drug persistently and slowly. The inhibition rate of FA-HSA-RESNPs and RES was detected using the 3-(4,5-dimethylthiazol-2-yl)-2,5-diphenyl-2H-tetrazolium bromide method to be 110.8 and 157.2 μM, respectively. The targeting ability of the FA-HSA-RESNPs for the HepG2 cell was measured by fluorescein isothiocyanate-modified albumin techniques. The uptake rate of FA-HSA-RESNPs was higher than that of the original RES. By using near-infrared imaging, in vivo activity was labeled with Cy5 fluorescent FA-HSA-RESNP confirmed FA-HSA-RESNP tumor-targeting ability. The intravenous administration bioavailability of FA-HSA-RESNPs was about 5.95-fold higher than that of the original RES.
Graphical Abstract
Introduction
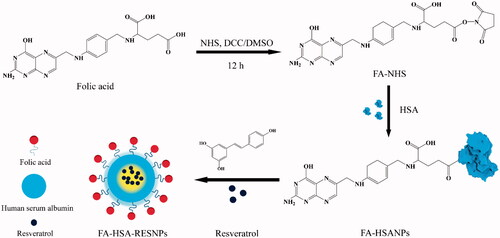
Resveratrol (trans-3,5,4′-trihydroxystilbene, RES), a nonflavonoid polyphenol compound found in massive plant, including cranberries, mulberries, peanuts and red grapes [Citation1], belongs to plant antibiotic compounds as a portion of plant defense against fungal infections () [Citation2]. RES has anti-inflammatory and antioxidant properties [Citation3,Citation4] and is a potential chemopreventive agent that can inhibit various stages of carcinogenesis, covers the initiation, promotion and progression of tumors [Citation5]. In the past three decades, it is also found to exhibit anticancer properties in some cancers, such as liver cancer, breast carcinoma and carcinoma of ovary [Citation6,Citation7]. In many types of cancer cells, RES stimulate apoptosis of cancer cell by activating the mitochondrial apoptotic pathway. It induces apoptosis, inhibits proliferation of cancer cells and increases the sensitivity of drug-resistant cancer cell lines [Citation8]. However, using RES as a potential antineoplastic agent has several drawbacks for clinical practice, such as low solubility, low blood flow and lack of selectivity [Citation9]. In addition, RES insolubilization has been demonstrated to hinder the biological induction of RES activity in vitro and in vivo [Citation10].
Figure 1 Synthesis of RES NPs encapsulated by FA-coupled HSA.
To ensure that the structural integrity of the drug is a precursor, packaging strategies have attracted the attention of many researchers. This method improves low solubility and poor bioavailability, decreases the rapid nephritic clearance and increases cell selectivity in traditional ‘free’ medications [Citation11]. Currently, many pharmaceutical carrier materials, such as chitosan, polylactide-co-glycolide, polybutylcyanoacrylate and albumin, are available. Among these materials, serum albumin has become a highly promising carrier that can deliver insoluble anticancer drugs. Human serum albumin (HSA) is a nontoxic and nonimmunogenic and biocompatible endogenous protein [Citation12–14]. The HSA has been diffusely used as a macromolecular protein vector for drug delivery. HSA improves the solubility of lipophilic drugs, and the carboxyl and amino groups on its surface promote the surface functionalization of albumin nanoparticles (NPs) [Citation15]. Thus, the surface of albumin NPs can be modified with fluorescent dyes and functional RNA by covalent binding [Citation16].
Liver cancer is a highly common malignancy in the world. It ranks third in cancer-related deaths worldwide, and its number of cases is increasing every year [Citation17,Citation18]. Early routine treatment of liver cancer covers operation, interventional therapy, radiotherapy and radiofrequency ablation [Citation19]. Although the treatment of choice for patients with liver cancer is surgery, the overall morbidity after resection can reach 22–42% [Citation20]. In addition, the survival rate of patients with liver cancer is very low because of their insensitivity to chemotherapy and their high metastatic potential. Moreover, chemotherapeutic drugs have potential disadvantages, such as short half-lives, low water solubility and significant toxicity. Therefore, the treatment of liver cancer involves a variety of nonsurgical treatments. Folic acid (FA) has attracted widespread attention as one of the best imaging and cancer-targeting ligands () [Citation21,Citation22]. Folate receptors are sites on the surface of many tumor cell membranes that specifically bind FA. Examples of FA receptor-positive tumor cells are Hela cells of cervical cancer, SKOV-3 cells of human ovarian cancer, Bel-7402 cells of hepatocellular carcinoma, etc. [Citation23,Citation24]. Therefore, after modification of the FA molecules on nanoliposomes, the target molecules can be efficiently and specifically targeted to the surface of the FA receptor-positive cells so as to kill the target tumor cells.
In this study, we used FA-coupled HSA to encapsulate RES and obtain RES NPs (FA-HSA-RESNPs) and established a targeted drug delivery system for hepatocellular carcinoma (). The ability of the tumor to target a nanomedicine carrier was assessed using a noninvasive live animal imaging system. First, FA active ester was coupled to HSA and RES was sealed in the composite by high pressure fluid nano-homogeneous emulsification. We investigated the factors influencing drug particle size variability and drug loading efficiency; these factors include HSA concentration, volume ratio of aqueous to organic phase, homogenization speed, homogenization time, homogenization pressure and homogenization frequency under certain pressure. Second, the related features of FA-HSA-RESNPs were characterized by scanning electron microscopy (SEM), transmission electron microscopy (TEM), Fourier transform infrared (FTIR) spectroscopy, thermogravimetric analysis (TGA), X-ray diffraction (XRD) and differential scanning calorimetry (DSC). In vitro assessment of drug release was also performed. The targeting properties of FA-HSA-RESNPs were studied in vivo and in vitro. We conducted an in vitro cell uptake test and cell proliferation assays. The in vivo biodistribution of FA-HSA-RESNPs was detected in tumor-bearing mice. Finally, the bioavailability and toxicity of FA-HSA-RESNPs in rats were investigated.
Materials and methods
Materials
RES (purity = 99%) was purchased from Xi’an Shou He Biotechnology Co., Ltd. (Xi’an, China). HSA was purchased from Sigma-Aldrich (St. Louis, MO, USA). Fluorescein isothiocyanate (FITC) and 0.25% trypsin–ethylenediaminetetraacetic acid were obtained from Invitrogen (Carlsbad, CA, USA). 3-(4,5-Dimethylthiazol-2-yl)-2,5-diphenyl-2H-tetrazolium bromide (MTT; 98% purity) was supplied by Sigma-Aldrich. N-Hydroxysuccinimide (NHS), 1,3-dicyclohexylcarbodiimide (DCC) and triethanolamine were purchased from Aladdin Reagent Co., Ltd. (Beijing, China). High-performance liquid chromatography (HPLC) grade methanol purchased from Merck (Germany). Phosphate-buffered saline (PBS; 0.15 M, pH = 7.2–7.6) was purchased from Sigma-Aldrich. Ethanol and trichloromethane were of analytical grade. Pentobarbital sodium was purchased from Sigma-Aldrich. Cy5 was obtained from Shanghai Yuan Ye Biological Technology Co., Ltd. (Shanghai, China).
Cell lines and animals
Human liver cancer cells (HepG2) and mouse liver cancer cells (H22) were provided by Beina Chuanglian Biotechnology Research Institute (Beijing, China). Kunming strain mice (18–22 g, male) and Sprague–Dawley rats (weight, 180–220 g) were obtained from Beijing HFK Bioscience Co., Ltd. (Beijing, China) and were used as subjects in the experiment. All animal operations were implemented in accordance with the Guidelines for the Care and Use of Experimental Animals of Harbin Medical University. Animal experiments were approved by the Ethics Committee of the Harbin Medical University.
Preparation of FA-HSA-RESNPs
Preparation of the NHS ester of FA (NHS-FA)
The active ester of FA was prepared using a previously reported method [Citation25]. In brief, FA (1 g) and triethylamine (0.5 mL) were melted in dimethyl sulfoxide (DMSO, 20 mL) and DCC (0.94 g) was added the solution. The solution was stirred for 1 h at room temperature in the dark, and NHS (0.52 g) was added. The mixture was stirred at room temperature and dark conditions for 12 h, and the insoluble byproduct dicyclohexylurea was removed by filtration. The filtrate was poured into a solution containing 30% acetone and ice-cold anhydrous ether, centrifuged and washed twice. Finally, the solution was dried at room temperature to obtain NHS-FA as a slightly yellow solid powder.
Conjugation of FA to HSA
A total of 125 mg of HSA was melted in 12.5 mL of deionized water, and the pH of HSANP solution (pH 10) was adjusted using 1 M carbonate buffer. Three milligrams of NHS-FA was dissolved in 1.0 mL of PBS and added to the HSA solution. Under alkaline conditions, the carboxyl group of FA was conjugated to the amino group of the HSA solution [Citation26,Citation27]. The resulting mixture was stirred at room temperature for 4 h. The unassociated FA in the mixture was then eliminated by centrifugation at 10,000 rpm for 15 min (Sigma 3K30 Centrifuge, Germany). The sample was freeze dried at 60 °C for 48 h to acquire a yellow FA-conjugated HSA NP (FA-HSANP) lyophilized powder.
Preparation of FA-HSA-RESNPs
The FA-HSA-RESNPs were prepared using an emulsion solvent evaporation method (refer Supplemental data for detailed procedure) [Citation28,Citation29].
Lyophilization
The FA-HSA-RESNP aqueous solution was lyophilized using a lyophilization apparatus (Martin Christ Gefriertrocknungsanlagen, Germany) to assure the stability of the physical properties of the final NPs. Ten milliliters of the FA-HSA-RES suspension was added to a glass dish, pre-frozen at −40 °C for 4 h and then lyophilized at −60 °C for 72 h to acquire the yellow lyophilized powder.
Characterization of FA-HSA-RESNPs
Determination of FA content associated with HSA
The amount of FA conjugated with HSA was evaluated using a previously reported method [Citation30]. Briefly, after dialysis with deionized water, 2 mg of FA-HSA-RESNPs was dispersed in 20 mL of deionized water containing trypsin (50 μg/mg HSA) and hydrolyzed in a shaker (Harbin Donglian Electronic Technology Development Co., Ltd., China) at 37 °C for 4 h. A solution of FA active ester solutions at concentrations of 40, 20, 10, 8 and 2 μg/mL was set with a volumetric flask. The standard curve of FA ester was tested with a UV spectrophotometer (Shimadzu, Tokyo, Japan). The absorbance at 281 nm was measured, and a standard curve was prepared to obtain a linear regression equation to calculate the FA content (y = 0.408x + 0.0563, R2=0.9985). The conjugated FA content was obtained from the average of triplicate samples.
The lyophilized solid powder (2 mg) was mixed with KBr (200 mg) to form a circular sheet having a diameter of 5 mm. The tablet was placed in the sample slot of a Magna-IR 560 ESP FTIR spectrometer (Nicolet, Madison, WI, USA) for inspection of FTIR spectra. The resolution of the FTIR was set at 4/cm and used to fit the spectrum scope of 400–4000/cm.
Characterization of FA-HSA-RESNPs
A powdery sample to be tested was covered on a gold conductive adhesive (JFC 1200 Fine Coater; JEOL, Japan). The morphology of the samples was then observed by SEM (Quanta 200; FEI, The Netherlands). The FA-HSA-RESNPs lyophilized powder was dispersed in deionized water and dropped on a copper grid. Then, it was negatively stained with a phosphotungstic acid solution (2%, w/v) for a while and placed under TEM for detection.
The FA-HSA-RESNP lyophilized powder was dissolved in deionized water to a suspension having a concentration of 5 mg/mL. The suspension (3 mL) was added to the sample cell, and the particle size was determined by laser light scattering (Zeta Plus Brookhaven Instruments, Holtsville, NY, USA) at 25 °C.
Solid-state study
The solid characteristics of FA-HSA-RESNP were detected by FTIR spectrometer. The frequency range of 4000–400/cm at a resolution of 1/cm was measured. The physical properties of the sample were examined with an X-ray diffractometer (Philips, Amsterdam, The Netherlands) to confirm the crystal phase of the sample. The X-ray diffraction pattern of the sample was procured in the range of 5–80° with a scan step size of 2°. Monochromatic CuΚα1 radiation (λ = 1.54060 Å) of 40 mA and 40 kV was used as the X-ray source. The thermodynamic changes of the samples related to their morphological changes were determined using DSC (Shimadzu) under constant nitrogen at a continuous heating rate of 10 °C/min due to different lipids with different melting points and enthalpies. The atmosphere was from 50 to 300 °C. TGA data were recorded with a TG analyzer (Diamond TG/DTA; PerkinElmer, Waltham, MA, USA) in the range of 40–600 °C under nitrogen flow at a rate of 10 °C per minute.
Evaluation of in vitro drug release
The in vitro release behaviors of RES from the FA-HSA-RESNPs were evaluated by dialysis method (refer Supplemental data for detailed procedure). The RES released from FA-HSA-RESNPs was trimmed in PBS (0.15 M, pH 7.4).
Measurement of lethality and targeting ability of FA-HSA-RESNP
Cell culture
Human hepatoma cells (HepG2) were used to perform the cell uptake study and cell proliferation assay of FA-HSA-RESNPs. The cells were cultured in MEM glucose containing 10% heat-inactivated FBS at 37 °C in the CO2 atmosphere.
FA-HSA-RESNP lethality measurement
The in vitro lethality of RES and FA-HSA-RESNPs was evaluated in HepG2 cells using the MTT method (refer Supplemental data for detailed procedure).
FA-RES-HSANP targeting ability measurement
Please refer to the supplement for detailed procedures on the establishment of a tumor model. The FITC-modified albumin technique was used to determine the targeting ability of FA-RES-HSANPs. The HepG2 cell suspension was injected into six-well plates at 2 mL/well (containing 2 × 10⁵ cells) and cultured at 37 °C for 24 h in a 5% CO2 incubator. FITC labels samples of FA-RES-HSANPs, pure RES, HSA-RESNPs and a mixture of HSA-RESNPs and FA, respectively. The sample was dissolved in a carbonate buffer solution (pH = 8.6). FITC and albumin NPs were added to water at a ratio of 1:200 and reacted in an ice bath at 4 °C for 12 h. Excess FITC was separated by centrifugation at 12,000 rpm for 20 min. The labeled sample was washed three times and centrifuged again. FITC-labeled samples were added to 6-well plates at different concentrations (100, 150, 175 and 200 μM RES) and incubated for 4 h. After the wells were washed two times with saline, 1 mL of saline was added to each well to infiltrate the cells. Plates were observed using a laser scanning confocal microscope (LSCM; D-eclipse C1; Nikon, Tokyo, Japan) at an excitation wavelength of 488 nm. After the cells were treated with Triton X100-PBS buffer, the fluorescence intensity was measured using a fluorescence spectrophotometer (F-7000; Hitachi, Ltd., Tokyo, Japan) at an excitation wavelength of 488 nm.
In vivo fluorescence imaging
The near-infrared (NIR) fluorophore Cy5 was labeled on FA-HSA-RESNPs to investigate the in vivo distribution of NPs in tumor-bearing mice [Citation31]. Cy5 and HSA were dispersed in pure water at a 5:1 ratio and reacted for 1 h in the dark. The free Cy5 dye was then separated by ultracentrifugation and verified by the detection of fluorescence in the supernatant. Cy5-labeled FA-HSA-RESNPs were solubilized with PBS as a solvent. The results of fluorescence imaging of mice were obtained at different time points (0.5, 1, 2, 4, 8, 12, 48 and 72 h) after injection by using 5 mg/kg of Cy5-labeled FA-HSA-RESNP. Noninvasive fluorescence imaging was performed using a PerkinElmer in vivo imaging system (IVIS Lumina Series III, USA).
Bioavailability test
All rats were fasted the night before the experiments. Rats were randomized into two groups: the original RES group and the FA-HSA-RESNPs group. Six rats per group. According to the dose of 6 mg/kg (calculated according to RES), it was administered by tail vein injection. The rats were anesthetized after tail vein administration. The blood samples taken from the orbital sinus at time points of 0.08, 0.166, 0.25, 0.33, 0.5, 0.75, 1, 2, 4, 8, 12, 18 and 24 h were placed in a centrifuge tube containing heparin. Then, it was centrifuged at 3000 rpm for 5 min to obtain plasma. The plasma samples were collected and stored at −20 °C. A total of 0.2 mL plasma samples and 0.4 mL methanol were vortexed for 5 min. The mixture was sonicated for 10 min and centrifuged at 12,000 rpm for 10 min to obtain plasma containing RES. The supernatant was analyzed by HPLC.
Toxic experiment
Thirty-six Sprague–Dawley rats (weight, 180 ± 20 g) were randomly divided into three groups, including the control group, raw RES group and FA-HSA-RESNP group, with 12 rats in each group (six males and six females). The rats in the administration group were intravenously injected at a dose equivalent to 6 mg/kg of RES per day for 2 weeks, and the rats in the control group were given physiological saline. During this time, all rats were free to eat and drink. After 2 weeks, the rats were killed, and the hearts, livers, spleens, lungs and kidneys were excised and weighed (accurate to 0.01). The immune organ index was calculated using the following formula:
(1)
(1)
Statistical analysis
All samples were tested in triplicate. Results are shown as mean ± standard deviation. Analysis of variance with data was considered statistically significant, p < .05.
Results and discussion
Experimental design and analysis
Orthogonal design and single-factor method were used to determine the optimal conditions of drug preparation. The size of the particle size plays an important role in the distribution of NPs in the living body. At the beginning of the experiment, we determined that these factors have a significant impact on particle size: HSA concentration, water-to-organic-phase volume ratio, homogenization speed, homogenization duration, homogenization pressure and homogenization frequencies at certain pressure levels.
The factors such as concentration of HSA, volume ratio of aqueous phase to organic phase, homogenization speed and homogenization duration were selected for orthogonal design. The 16 (L164) orthogonal test was carried out with the particle size as the selection standard to determine the optimal preparation process of FA-HSA-RESNPs. The results of the orthogonal experiment are shown in , which shows the product with a particle size between 122.4 ± 5.3 and 898.1 ± 42.7 nm. Analysis results of the tabular data showed that the optimal condition was the horizontal factor with the smallest average particle size. The optimal preparation conditions of slurry phase were A3B1C2D3, that is, CHSA=4 mg/mL, Vinorganic:Vorganic=9:1, homogenate time = 5 min and homogenate speed = 8000 rpm. Under the optical microscope system, the state of the optimal emulsification was observed.
Table 1. Relationships between the parameters and particle size when one variable parameter and others are fixed.
As shown in , there are many uniform oil droplets in the water. The morphology of the droplets dispersed in the solvent was examined under the fields of 10 × 40 () and 10 × 100 (). The observed droplets showed a uniform and stable state. Homogenization ensures a small particle size and a stable droplet system. Samples were obtained under optimal conditions of orthogonal experiments, and the effects of homogenization pressure and the number of homogenization at each pressure on particle size were examined by a single factor method (). The test homogenization pressure ranges from 500 to 1100 bars. The number of homogenizations ranges from 3 to 15 times. At 800 bars, the particle size measured from 3 to 15 times of homogenization remained stable between 72.3 ± 2.6 and 127.3 ± 6.1 nm. When the number of homogenization was nine times, the solution presented opalescence with a minimum size of 72.3 ± 2.6 nm. After homogenizing nine times, we tested the homogenization pressure from 500 to 1100 bars, and the particle size remained at 72.3 ± 2.6 and 215.0 ± 10.9 nm. When the homogenization pressure was 800 bars, the particle size reaches a minimum of 72.3 ± 2.6 nm and the emulsion system was in a stable state. Therefore, given the single-factor experimental results, we chose the homogeneous pressure of 800 bars and nine homogenization frequencies as the optimal conditions. Under the optimum process parameters, the average particle size of the suspension of FA-HSA-RESNPs after freeze drying was 102.1 ± 4.9 nm. The drug capsulation efficiency and drug loading efficiency were 98.36 and 14.66%, respectively (refer Supplemental data for detailed procedure). The residual amounts of chloroform and methanol in FA-HSA-RESNPs were separately less than the international conference on harmonization (ICH) limit (refer Supplemental data for detailed procedure).
Figure 2 Optimal emulsified state observed by optical microscopy: (A) 10 × 40 and (B) 10 × 100 magnification.
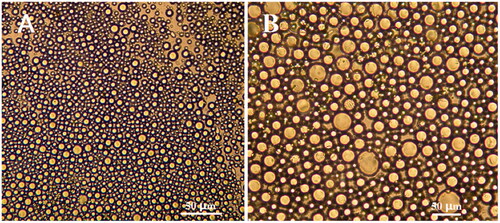
Table 2. Influence of particle size on homogenization times and pressure.
Characterization of FA-HSA-RESNPs
Morphology of FA-HSA-RESNPs
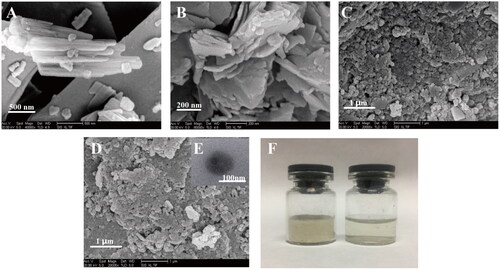
The morphology of the freeze-dried sample is shown in . The raw HSA, pure RES, FA-HSA and FA-HSA-RESNPs were observed using SEM. As shown in , the form of pure RES as a needle-like crystal having a particle diameter of 0.1–2 μm. As shown in , the form of pure HSA as irregular lamelliform crystal having a particle diameter of 1–200 μm. As shown in , the morphology of FA-HSANPs was approximately spherical. shows the morphology of the freeze-dried powders of FA-HSA-RESNPs, which were approximately spherical and connected to each other, obtained under optimal conditions. shows the morphology of single particles of lyophilized powder dispersed in deionized water by TEM. The sample demonstrated a nearly full spherical shape with an MPS of 97.5 ± 0.3 nm. RES was stable in amorphous state among the NPs. The lyophilized powder and its dissolution in deionized water are presented in . Lyophilized powder dissolves well in aqueous solution and presents a stable milky white system.
Figure 3 Morphology of samples observed by SEM and TEM: (A) raw RES, (B) HSA, (C) FA-HSANPs, (D) FA-HSA-RESNPs, (E) single NP and (F) photograph of freeze-dried FA-HSA-RESNP powder (left) and aqueous dispersion (right).
Solid-state study
The FTIR spectra of the FA, HSA, FA-HSA, RES and FA-HSA-RESNPs are shown in . shows an infrared spectrum of the original FA, which exhibited a characteristic absorption peak of stretching vibration of the benzene ring skeleton at 1500/cm. The other two peaks are located at 1590.40 and 1399.45/cm, and the absorption peaks correspond to the symmetric and asymmetric stretching vibrations of COO−, respectively. As shown in , the HSA contained a large amount of amide bonds with an absorption peak at 1654.68/cm. shows the infrared spectrum of FA-HSANPs containing the characteristic peaks of FA and HSA. The figure shows that the conjugation of FA and HSA was completed, and the amount of FA conjugation on HSA by HPLC analysis was 26.904 μg/mg. The infrared spectrum of the raw RES has an absorption peak of phenolic hydroxyl group at 3250.12/cm (). A small peak appeared in the infrared spectrum of FA-HSA-RESNPs (), indicating the presence of a certain amount of RES on the surface of FA-HSA.
Figure 4 (A) Infrared spectrograms of (a) FA, (b) HSA, (c) FA-HSANPs, (d) raw RES and (e) FA-HSA-RESNPs. (B) XRD patterns of (a) raw RES, (b) HSA, (c) FA-HSANPs and (d) FA-HSA-RESNPs. (C) DSC thermograms of (a) raw RES, (b) HSA, (c) FA-HSANPs and (d) FA-HSA-RESNPs. (D) TGA thermograms of (a) FA-HSANPs, (b) FA-HSA-RESNPs, (c) HSA and (d) raw RES.
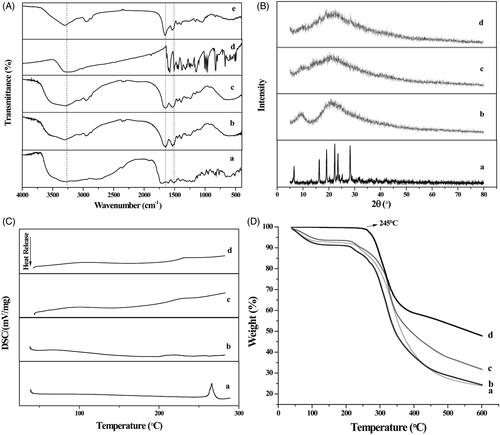
XRD analysis was performed on the crystalline structure of samples containing the original RES, pure HSA, FA-HSANPs and FA-HSA-RESNPs (). Many diffraction peaks of pure RES at 2θ = 6.6, 16.1, 19.2, 22.2, 23.5 and 28.3° were detected in the XRD curve of pure RES because of its crystal morphology [Citation32]. Two broad peaks (2θ = 9.47 and 21.18°) were found in the HSA curve, indicating that the crystallinity of HSA was very low and nearly amorphous. The FA-HSA-NP spectrum has only one broad diffraction peak (at 2θ = 21.04°), which is amorphous due to its small particle size. FA-HSA-RESNPs showed only one broad diffraction peak at 2θ = 21.85°. These data demonstrate that FA-HSA-RESNP was present in an amorphous state and was no longer in crystalline form. It was also demonstrated that the RES was encapsulated by the hydrophilic shell of FA-HSA-NPs. The amorphous solid was more easily dispersed than the crystalline solid [Citation33,Citation34]. Therefore, FA-HSA-RESNPs possessed a higher water solubility than raw RES.
shows a DSC thermogram of the samples. Curve a shows a distinct melting peak around 267.2 °C indicating the formation of crystals of the original RES. However, no melting peak was shown in the DSC pattern of FA-HSA-RESNPs. It is indicated that the RES in the FA-HSA-RESNPs exists in an amorphous state. This result is the same as the result of the XRD analysis. In addition, no melting peaks were observed in both the HSA and FA-HSA-NP spectra, confirming that both were amorphous.
TGA was used to determine the relationship between the temperature and the quality of a sample. The change in weight was caused by water loss. shows the TG curve of the sample. During the temperature increase to 245 °C, the raw RES showed no significant weight loss. The weight loss of RES was significant when the temperature was raised from 245 to 380 °C, and the weight loss ratio was 40%. The total weight loss of RES reaches 53%. The curves of pure HSA, FA-HSA-NPs and FA-HSA-RESNPs showed weight loss values of 6, 7 and 8%, respectively, from 40 to 110 °C. The recurrence of weight loss begins at a temperature of about 210 °C. As shown by curve c, the original HSA lost about 62% of its weight. The highest degree of weight loss was FA-HSA-NPs as shown by curve a, with a weight loss rate of 70%. This result implies that the FA-HSA-NPs possess a smaller particle size than pure HSA, and the smaller particle size indicates a higher specific surface area and thus a higher specific surface energy [Citation35], which subsequently lead to easier vaporization and earlier decomposition energy. The weight loss rate for FA-HSA-RESNPs was about 68%, which was higher than that of RES and lower than that of FA-HSA-NPs. The results of the assay confirmed the presence of RES in the NPs.
Drug-release study
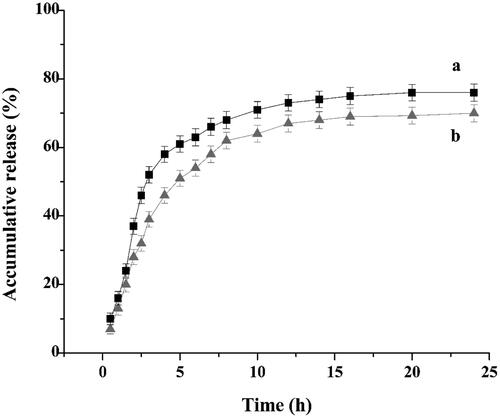
In vitro release studies provide important information about the efficiency of the delivery system. The FA-HSA-RESNPs for in vitro release study had a drug-loading of 14.66% and a entrapment efficiency of 98.36%. The dissolution profiles of the raw RES and FA-HSA-RESNPs within 24 h are shown in . The in vitro release results of FA-HSA-RESNPs, as shown by curve b, showed almost linear release during the first 5 h, and approximately 51% of the loaded RES was released from the FA-HSA-RESNPs. When the release time reached 12 h, approximately 66% of the loaded RES was released from the FA-HSA-RESNPs and the release profile at this time showed a very stable sustained release pattern. After 24 h, the cumulative release rate of FA-HSA-RESNPs reached 70%. However, the original RES exhibited a fast release characteristic, and the release rate of the original RES reached about 60% in the first 5 h. The cumulative release of the raw RES was 75% after 24 h. These results indicate that FA-HSA-RESNPs significantly affected the sustained drug release. The combination of drugs and albumin prevented the rapid release of the drug at the injection site but releases the drug slowly and continuously.
Figure 5 Drug-release curves (a) raw RES and (b) FA-HSA-RESNPs.
Targeting property assay
FA-HSA-RESNP lethality
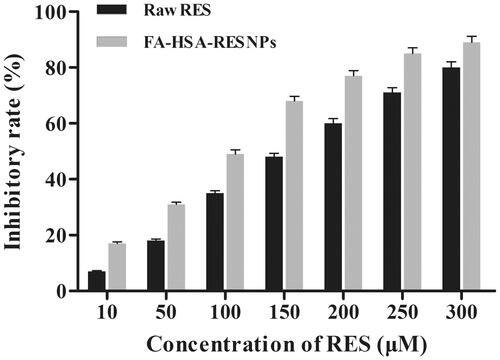
MTT assay was used to verify the effects of different types of drugs (raw RES and FA-HSA-RESNPs) on the growth inhibition of HepG2 cells. This method was used by Stepanenko and Dmitrenko [Citation36] and Wang et al. [Citation37]. The tested concentrations of pure RES and FA-HSA-RESNPs (14.66% (w/w) drug loading) were 10, 50, 100, 150, 200, 250 and 300 μM. Inhibition of cell proliferation occurred after incubation for 48 h and developed alongside a rising concentration. The cells were incubated for 48 h after administration, and the effect of inhibiting cell proliferation was detected. The inhibitory effect develops more significantly as the concentration increases. shows the inhibitory effect of pure RES and FA-HSA-RESNPs on HepG2. The results showed that the surviving cell fractions were related to the change in drug concentration, and the inhibitory rate increased with the increase in concentration. FA-HSA-RESNPs more effectively inhibited the cell proliferation than did pure RES. The IC50 values of the FA-HSA-RESNPs and pure RES were 110.8 and 157.2 μM, respectively. Therefore, RES improved the potential anticancer drug treatment effect.
Figure 6 Inhibitory rates of HepG2 cells by raw RES and FA-HSA-RESNPs.
FA-HSA-RESNP targeting ability
The fluorescence intensity of the FITC-labeled samples is shown in . The fluorescence intensity exhibited by HepG2 cells treated with FITC-labeled different types of drug samples was detected. From the results, the fluorescence intensity of the FITC-labeled FA-HSA-RESNPs in the cells was more pronounced than in the other samples because the cells captured and adsorbed abundant FA-HSA-RESNPs (). As shown in , the physical mixture of FITC-labeled HSA-RESNPs and FA showed some fluorescent spots in the cells, the fluorescence of which was significantly weaker than . The main reason for the decrease in uptake of HSA-RESNP was due to the selective capture of FA by HepG2 cells. confirms this inference because the fluorescence intensity in this figure was significantly greater than the fluorescence intensity in . shows that the fluorescence intensity of FITC-labeled HSA-RESNPs was weaker than that in but slightly stronger than that in . Fluorescent spots of raw RES were hardly detected as shown in due to the absence of NP. shows a fluorescence blank and almost no fluorescence spots. Thus, the fluorescence intensity of the samples followed the order >> >.
Figure 7 LSCM images of (A) FITC-labeled FA-HSA-RESNPs, (B) FITC-labeled FA-HSANPs, (C) FITC-labeled physical mixture of FA-HSANPs, (D) FITC-labeled raw RES, (E) blank cells without NPs added, (F) fluorescence intensity of NP uptake by cultured HepG2 cells and (G) concentration dependence of FA-HSA-RESNP uptake by cultured HepG2 cells. Notes: ***p ≤ .001. Abbreviation: CK, control check.
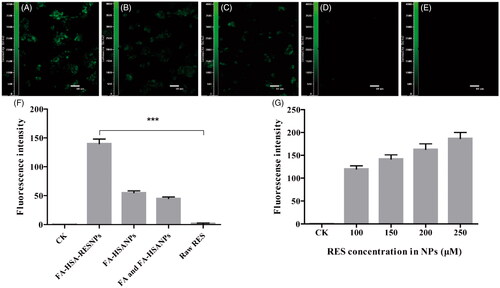
The targeting specificity of the sample complexes was further evaluated by quantitative fluorescence spectrophotometer analysis of the sample uptake in HepG2 cells. The fluorescently labeled cells were lysed using a Triton X100-PBS buffer solution and placed in a fluorescence spectrophotometer to determine the fluorescence intensity. As shown in , the strongest fluorescence intensity of FA-HSA-RESNPs on HepG2 cells is reflected, and this result was consistent with the above results. The mechanically mixed group containing HSA-RESNPs and FA had lower fluorescence intensity than the HSA-RESNP group. This may be related to the preferential selection of receptors on the surface of HepG2 cells by free FA, thereby reducing the ability of HepG2 cells to absorb NP. The raw RES showed almost no fluorescence intensity in the cells. The fluorescence intensity of the buffer solution based on FITC-labeled FA-HSA-RESNPs with different concentration gradients (100, 150, 200 and 250 μM of RES) is shown in . Under the premise of the same number of HepG2 cells, the fluorescence intensity increased with an increase in FA-HSA-RESNP concentration. This finding indicates that the uptake behavior of FA-HSA-RESNP by HepG2 cells is concentration dependent.
In vivo biodistribution of FA-HSA-RESNPs in tumor-bearing mice
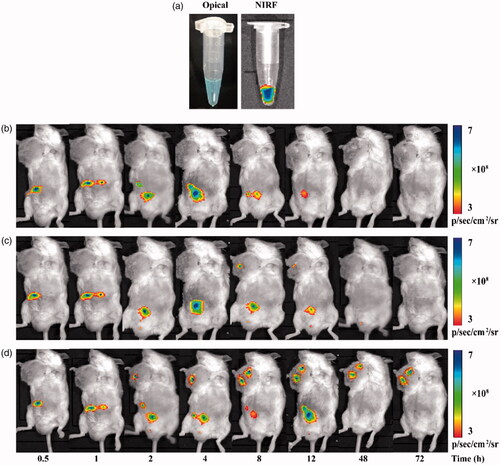
The noninvasive and real-time NIR fluorescence (NIRF) imaging technique has been used effectively to visualize and quantify the tissue distribution of drug carriers in vivo [Citation38]. To visualize the distribution of FA-HSA-RESNPs in tumor-bearing mice, the NIRF molecule Cy5 was labeled on the RES NPs. By observing the real-time NIRF intensity throughout the body of the mouse, the distribution characteristics of FA-HSA-RESNPs in living animals can be clearly monitored. FA-HSA-RESNPs were labeled with the NIR fluorophore Cy5 (Ex = 630 nm and Em = 680 nm), which exhibited a strong NIRF signal () to estimate the distribution of the drug in mice. HSA-RESNPs and FA-HSA-RESNPs (5 mg/kg) were injected into different H22 tumor-bearing KM mice via the tail vein and then exhibited fluorescence intensity in their bodies as shown in . presents the blank control group of H22 tumor-bearing KM mice, and the Cy5 aqueous solution is distributed in the body. The FA-HSA-RESNPs were injected from the tail vein into the body of the mouse and spreads in the body as blood flows. Within 2 h of administration of the tail vein, the drug exhibited intense fluorescence intensity in the body. A part of the FA-HSA-RESNPs were excreted from the body with urine, and when the time was up to 4 h, the drug was observed to spread to the tumor site. The tumor significantly accumulated the drug within 12 h. After 48 h, the fluorescent target in the tumor was still observable in the H22 tumor-bearing KM mice. The fluorescence intensity of the mice was tested after 72 h of administration, and drug accumulation was still found to be significant at the tumor site of KM mice bearing H22 tumors. At this point, no apparent fluorescence was noted at the tumor site of KM mice in the control group. In the HSA-RESNP group, a weak fluorescence intensity was tested at the tumor site of the H22 tumor-bearing KM mice at the time of administration of 8 h, and then, the fluorescence intensity gradually weakened until it disappeared.
Figure 8 In vivo imaging, NIRF images of Cy5-labeled FA-HSA-RESNPs: (a) white light and NIRF images of Cy5-labeled FA-HSA-RESNPs, (b) bioluminescence imaging of blank control mice, (c) bioluminescence imaging of H22 tumor-bearing KM mice injected with HSA-RESNPs and (d) bioluminescence imaging of H22 tumor-bearing KM mice injected with FA-HSA-RESNPs. HSA-RESNPs: HSA wrapping RES NPs. FA-HSA-RESNPs: FA-conjugated HSA NPs wrapping RES NPs.
Bioavailability analysis
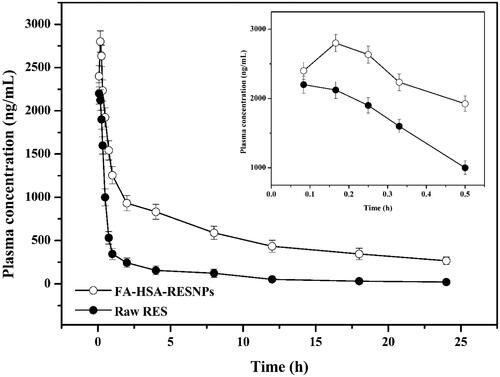
The concentration of the drug in the plasma of rats treated with FA-HSA-RESNPs was constant higher than that in the plasma of rats treated with the same dose of pure RES (). The RES concentrations of the rats treated with FA-HSA-RESNPs and those treated with original RES reached maximum levels of 2.89 and 2.17 μg/mL after 10 and 5 min of drug intake, respectively. The absolute bioavailability of the intravenous injection was calculated by comparing the corresponding AUC values of the FA-HSA-RESNP group and the RES group. The experimental results show that the AUC value of FA-HSA-RESNPs was 5.95 times higher than the AUC value of the original RES. Therefore, the bioavailability of FA-HSA-RESNPs prepared by the high-pressure fluid nano-homogeneous emulsification method was significantly improved compared with the original RES. The results obtained were consistent with the results of the dissolution and physical characterization.
Figure 9 Plasma concentration of FA-HSA-RESNPs and raw RES.
Toxicity testing
The weight gain and immune organ index of rats in the three groups are shown in . The weight gains of rats in the control, raw RES and FA-HSA-RESNP groups were about 23.77 ± 3.32, 37.43 ± 3.87 and 34.76 ± 3.66 g, respectively, indicating that the weight of the experimental group increased more than that of the control group. Therefore, these results indicated that the FA-HSA-RESNPs and raw RES have a slight effect on the body weight of rats but have no toxic effects on their organs. In addition, there was no significant difference in the immune organ index between the experimental group and the control group.
Table 3. Effects of FA-HSA-RESNPs on the indices of rat immune organs.
Conclusions
In this study, FA-HSA-RESNPs were successfully prepared by high-pressure fluid nano-homogeneous emulsification method and the average particle size of the obtained nanoparticles was 102.1 ± 4.9 nm. The drug capsulation efficiency and drug loading efficiency were 98.36 and 14.66%, respectively. The amount of FA that coupled to the HSA was 26.904 μg/mg. In addition, the characteristics of the FA-HSA-RESNPs were examined by SEM, TEM, FTIR spectroscopy, TGA, XRD and DSC. The results showed that the shape of FA-HSA-RESNPs was approximately spherical, and RES were amorphously encapsulated in FA-HSA. Furthermore, RES in the FA-HSA-RESNPs exists in low crystallinity. Therefore, the FA-HSA-RESNPs were greatly improved in solubility compared to the original RES. In vitro drug release studies have shown that the FA-HSA-RESNPs delivery system could release slowly and continuously.
The uptake of FITC-labeled samples by HepG2 cells was observed by confocal microscopy, and it was found that cells incubated with FA-HSA-RESNP exhibited stronger fluorescence intensity than samples without FA-conjugated NPs. The effect of the original RES and FA-HSA-RESNPs on the growth inhibition of HepG2 cells was determined by MTT assay. The IC50 values of FA-HSA-RESNPs and RES were 110.8 and 157.2 μM, respectively. As the concentration of FA-HSA-RESNPs increases, the effect of inhibiting cells becomes more pronounced. FA-HSA-RESNPs showed a higher inhibition rate under the same conditions of drug administration relative to RES.
The consequence showed that FA increased the directional attack ability of FA-HSA-RESNP on HepG2 cells and increased the lethal effect on HepG2 cells and FA-HSA-RESNP has high inhibitory rate. Noinvasive and live animal imaging techniques were used to demonstrate the ability of FA-HSA-RESNP to target liver tumor cells. This study showed that FA-HSA-RESNPs have excellent targeting and sustained release characteristics for liver tumor cells. The in vivo activities of the FA-HSA-RESNP targeted drug delivery system exhibit a broad range of possible applications in liver tumor cell targeting therapy. In addition, the bioavailability of intravenous administration of FA-HSA-RESNPs were about 5.95 times higher than that of the original RES, but FA-HSA-RESNPs had no toxic effects on rat organs.
Supplementary_Material.docx
Download ()Disclosure statement
The authors report no conflicts of interest.
Additional information
Funding
Related Research Data
References
- Wang H-D, Shi Y-M, Li L, et al. Treatment with resveratrol attenuates sublesional bone loss in spinal cord-injured rats. Br J Pharmacol. 2013;170:796–806. doi:10.1111/bph.12301. PubMed PMID: WOS:000325139400009.
- Singh NP, Hegde VL, Hofseth LJ, et al. Resveratrol (trans-3,5,4′-trihydroxystilbene) ameliorates experimental allergic encephalomyelitis, primarily via induction of apoptosis in T cells involving activation of aryl hydrocarbon receptor and estrogen receptor. Mol Pharmacol. 2007;72:1508–1521.
- Koul D, Shen R, Bergh S, et al. Inhibition of Akt survival pathway by a small-molecule inhibitor in human glioblastoma. Mol Cancer Ther. 2006;5:637.
- Harikumar KB, Aggarwal BB. Resveratrol: a multitargeted agent for age-associated chronic diseases. Cell Cycle. 2008;7:1020–1035.
- Colin D. Resveratrol as a chemopreventive agent: a promising molecule for fighting cancer. Curr Drug Targets. 2006;7:423–442.
- Carter LG, D’Orazio JA, Pearson KJ. Resveratrol and cancer: focus on in vivo evidence. Endocr Relat Cancer. 2014;21:R209.
- Venkatadri R, Muni T, Iyer AKV, et al. Role of apoptosis-related miRNAs in resveratrol-induced breast cancer cell death. Cell Death Dis. 2016;7:e2104.
- Mattarei A, Azzolini M, Carraro M, et al. Acetal derivatives as prodrugs of resveratrol. Mol Pharmaceutics. 2013;10:2781–2792.
- Deng R, Yi H, Fang Y, et al. Facile exfoliation of MoS2 nanosheets by protein as a photothermal-triggered drug delivery system for synergistic tumor therapy. RSC Adv. 2016;6:77083–77092.
- Singh G, Pai RS. In-vitro/in-vivo characterization of trans-resveratrol-loaded nanoparticulate drug delivery system for oral administration. J Pharm Pharmacol. 2014;66:1062–1076.
- Loira-Pastoriza C, Todoroff J, Vanbever R. Delivery strategies for sustained drug release in the lungs. Adv Drug Deliv Rev. 2014;75:81.
- Kratz F. Albumin as a drug carrier: design of prodrugs, drug conjugates and nanoparticles. J Control Release. 2008;132:171.
- Elzoghby AO, Samy WM, Elgindy NA. Albumin-based nanoparticles as potential controlled release drug delivery systems. J Control Release. 2012;157:168–182.
- Bokharaei M, Margaritis A, Xenocostas A, et al. Erythropoietin encapsulation in chitosan nanoparticles and kinetics of drug release. Curr Drug Deliv. 2014;8:164–171.
- Kouchakzadeh H, Shojaosadati SA, Tahmasebi F, et al. Optimization of an anti-HER2 monoclonal antibody targeted delivery system using PEGylated human serum albumin nanoparticles. Int J Pharm. 2013;447:62–69.
- Wei T, Du D, Wang Z, et al. Rapid and sensitive detection of microRNA via the capture of fluorescent dyes-loaded albumin nanoparticles around functionalized magnetic beads. Biosens Bioelectron. 2017;94:56–62.
- Parkin DM, Bray F, Ferlay J, et al. Global cancer statistics, 2002. Cancer. 2002;55:74–108.
- Zhu B, Sun L, Luo W, et al. Activated Notch signaling augments cell growth in hepatocellular carcinoma via up-regulating the nuclear receptor NR4A2. Oncotarget 2017;8:23289–23302.
- Yang YW, Yang L, Zhang C, et al. Physagulide Q suppresses proliferation and induces apoptosis in human hepatocellular carcinoma cells by regulating the ROS-JAK2/Src-STAT3 signaling pathway. RSC Adv. 2017;7:12793–12804.
- Ciacio O, Voron T, Pittau G, et al. Interest of preoperative immunonutrition in liver resection for cancer: study protocol of the PROPILS trial, a multicenter randomized controlled phase IV trial. BMC Cancer. 2014;14:1–10.
- Turk MJ, Reddy JA, Chmielewski JA, et al. Characterization of a novel pH-sensitive peptide that enhances drug release from folate-targeted liposomes at endosomal pHs. Biochim Biophys Acta. 2002;1559:56.
- Reddy JA, Dean D, Kennedy MD, et al. Optimization of folate-conjugated liposomal vectors for folate receptor-mediated gene therapy. J Pharm Sci. 1999;88:1112–1118.
- Tong L, Chen W, Wu J, et al. Folic acid-coupled nano-paclitaxel liposome reverses drug resistance in SKOV3/TAX ovarian cancer cells. Anti Cancer Drugs. 2014;25:244.
- Wu C, Cao H, Zhou H, et al. Research progress on the antitumor effects of rhein: literature review. Anti Cancer Agents Med Chem. 2015;15:1.
- Lee RJ, Low PS. Delivery of liposomes into cultured KB cells via folate receptor-mediated endocytosis. J Biol Chem. 1994;269:3198–3204.
- Zheng Y, Cai Z, Song X, et al. Preparation and characterization of folate conjugated -trimethyl chitosan nanoparticles as protein carrier targeting folate receptor: studies. J Drug Target. 2009;17:294–303.
- Ulbrich K, Michaelis M, Rothweiler F, et al. Interaction of folate-conjugated human serum albumin (HSA) nanoparticles with tumour cells. Int J Pharm. 2011;406:128.
- Desai NP, Tao C, Yang A, et al. Protein stabilized pharmacologically active agents, methods for the preparation thereof and methods for the use thereof, US; 2004.
- Wu M, Lian B, Deng Y, et al. Resveratrol-loaded glycyrrhizic acid-conjugated human serum albumin nanoparticles wrapping resveratrol nanoparticles: preparation, characterization, and targeting effect on liver tumors. J Biomater Appl. 2017;31:191–205.
- Zhao X, Tang J, Zu Y, et al. Preparation of folate-conjugated bovine serum albumin nanoparticles adsorbing epirubicin hydrochloride. Nano. 2013;08:1350066.
- Wang F, Yang K, Wang Z, et al. Combined image guided monitoring the pharmacokinetics of rapamycin loaded human serum albumin nanoparticles with a split luciferase reporter. Nanoscale. 2016;8:3991–4000.
- Jose S, Anju SS, Cinu TA, et al. In vivo pharmacokinetics and biodistribution of resveratrol-loaded solid lipid nanoparticles for brain delivery. Int J Pharm. 2014;474:6–13.
- Kim JS, Kim MS, Park HJ, et al. Physicochemical properties and oral bioavailability of amorphous atorvastatin hemi-calcium using spray-drying and SAS process. Int J Pharm. 2008;359:211–219.
- Medknow. International Journal of Pharmaceutical Investigation. Int J Pharm. 2011;359:211–219.
- Huang Z, Sun GB, Chiew YC, et al. Formation of ultrafine aspirin particles through rapid expansion of supercritical solutions (RESS). Powder Technol. 2005;160:127–134.
- Stepanenko AA, Dmitrenko VV. Pitfalls of the MTT assay: direct and off-target effects of inhibitors can result in over/underestimation of cell viability. Gene. 2015;574:193–203.
- Wang S, Yu H, Wickliffe JK. Limitation of the MTT and XTT assays for measuring cell viability due to superoxide formation induced by nano-scale TiO2. Toxicol In Vitro. 2011;25:2147–2151.
- Park K, Kim JH, Nam YS, et al. Effect of polymer molecular weight on the tumor targeting characteristics of self-assembled glycol chitosan nanoparticles. J Control Release. 2007;122:305–314.