
 ?Mathematical formulae have been encoded as MathML and are displayed in this HTML version using MathJax in order to improve their display. Uncheck the box to turn MathJax off. This feature requires Javascript. Click on a formula to zoom.
Abstract
The present study reports the biosynthesis of silver nanoparticles using aqueous root extract of Arnebia hispidissima. They were prepared by adding 10 mL root extract in 90 mL silver nitrate (0.5 mM) solution and heating at 60 ± 2 °C for 12 min at pH 7.5. Characterization of the biosynthesized silver nanoparticles was done using UV-Visible spectroscopy, field emission scanning electron microscopy, energy dispersive X-ray analysis, transmission electron microscopy, X-ray diffraction analysis, dynamic light scattering measurements and Fourier-transform infrared spectroscopy. The synthesized silver nanoparticles were crystalline in nature exhibiting different shapes like sphere, rod, triangle, hexagon and polygon. Their zeta potential was −23.6 mV confirming their high stability. Fourier-transform infrared spectroscopy analysis showed the presence of phenolics, flavonoids and proteins as reducing, capping and stabilizing agents. The synthesized nanoparticles showed effective in vitro anti-oxidant activity against DPPH (IC50 = 9.86 µg/mL) and H2O2 (IC50 = 53.78 µg/mL) radicals. The nanoparticles showed dose-dependent cytotoxicity against HeLa (cervical cancer, IC50 = 4.44 µg/mL) cells and were non-toxic towards normal L20 B cells (non-malignant mouse cell line). They also exhibited strong anti-microbial activity against Candida albicans, Candida tropicalis, Geotrichum candidum (fungal strains); Escherichia coli, Staphylococcus aureus, Enterococcus faecalis, Klebsiella pneumoniae (bacterial strains). This is the first report of synthesis of silver nanoparticles using A. hispidissima root extract validating their bioefficacy against HeLa cancer cells and diverse microorganisms.
Introduction
Nanoscience has emerged as a prominent technology which finds its application in the fields of biology, medicine, optoelectronics, forensic investigation, wastewater treatment, development of biosensors, electrochemical sensors, currency and hologram printing, etc. [Citation1]. Fabrication of nanoparticles can be done using various physical (ultrasonication, laser ablation, thermo-reductive, electrochemical and microwave-assisted synthesis) and chemical methods (Turkevich method, Brust-Schiffrin synthesis, etc. involving the use of chemicals like amino-boranes, polyols, oxalic acid, sugar, citrate, thiolate, etc.) [Citation1]. Green synthesis is a substitute for physical and chemical methods as it forfeits the use of toxic chemicals, surfactants and unfavourable conditions like high temperature or intensive energy. Thus, the biological approach of green synthesis of nanoparticles is relatively safer to use, eco-friendly, cost-effective, simple (one-step synthesis), easily scalable for large-scale production and energy efficient in nature.
Green nanoparticles synthesized using metals such as gold, silver, copper, iron, zinc, titanium, etc. are being used for various biomedical applications such as magnetically responsive drug delivery vehicles, photothermal therapy, contrast enhancing agent for molecular imaging, etc. Among the metal nanoparticles, silver nanoparticles (AgNPs) are highly explored as they are easy to synthesize, show tunable photo-physical attributes, good conductivity, chemical stability, catalytic and antimicrobial activity. Silver nanoparticles possess various biological applications including bioimaging, biosensors, gene delivery, catalysis, antimicrobial, antioxidant and anticancer agents [Citation2]. Medicinal plants are known to be of paramount importance attributed to the plethora of phytoconstituents contributing to their great potential for the synthesis of nanoparticles. Bioactive compounds namely terpenoids, phenols, flavonoids, alkaloids, amino acids, polysaccharides, vitamins, etc. are involved in the bio-reduction of metal ions to synthesize metal nanoparticles. They act as both reducing agents and capping agents helping in the stabilization of synthesized nanoparticles.
Environmental stress (UV, ionizing radiations, pollutants, heavy metals) and xenobiotics (antiblastic drugs) contribute to greatly increased ROS (O2•−, H2O2, •OH) production causing imbalance that leads to cell and tissue damage (oxidative stress). Oxidative stress is detrimental to human health as it can cause cancer, rheumatoid arthritis, kidney diseases, cardiovascular diseases, neurodegenerative disorders, autoimmune diseases, respiratory disorders, etc. [Citation3]. So, to mitigate their effect, use of antioxidants is extensively studied.
Apparently, nanobiotechnology has come forth as a novel strategy for the treatment and diagnosis of cancer. In vitro anticancer activity of nanoparticles has been reported against different human cancer cell lines such as A549 (lung adenocarcinoma), U87 (glioblastoma cell), COLO205 (colon adenocarcinoma), HepG2 (hepatic cancer), HT-29 (colorectal adenocarcinoma), PC-3 (prostate carcinoma), KB (oral cancer), HeLa (cervical cancer), HCT 15 (colon adenocarcinoma), AGS (gastric carcinoma), Jurkat (T acute lymphoblastic leukemia) and mouse colon adenocarcinoma (CT-26), etc. [Citation4]. Potent antiproliferative activity of AgNPs synthesized using leaf extract of Artemisia vulgaris has been observed against HeLa and MCF-7 cell lines [Citation5]. Also, cytotoxicity of AgNPs loaded chitosan-alginate constructs has been reported against HeLa cells [Citation6].
The antimicrobial activity of the metal nanoparticles has its application in the field of biomedicine to prepare medicines, injections, diagnostic kits, surface coating agents, wound dressings, polymers and silver coated textile fabrics to prevent microbial infections. Silver and gold nanoparticles were found to exhibit antihelminthic activity against platyhelminths, scolicidal activity against Echinococcus granulosus [Citation7]. Antibacterial activity of AgNPs synthesized using Artemisia vulgaris leaf extract has been reported against five human pathogens, namely Staphylococcus aureus, Pseudomonas aeruginosa, Escherichia coli, Klebsiella pneumoniae and Haemophilus influenza [Citation5].
Arnebia hispidissima (family – Boraginaceae) is a perennial herb widely distributed in semi-arid regions of India (Rajasthan), Persia and Pakistan [Citation8]. It is known to possess anti-microbial, anti-inflammatory, anti-oxidant, wound healing, anti-tumor, cardiotonic, antineoplastic activities, etc. [Citation9]. Chemical investigations by Hamdard et al. [Citation10] reported the presence of a number of flavonoids, namely apigenin, cyanidin, kaemferol, luteolin, quercetin and vitexin in fresh flowers. Also, roots are the source of naphthaquinones (shikonin, alkannin and related isohexenylnaphthazarine compounds) which possess antibiotic and anticancerous properties. The present investigation provides an insight into the nanobiotechnological applications of this plant keeping in view its high medicinal potential. Study pertaining to AgNPs synthesis using A. hispidissima root extract (AHRE) and their bioefficacy has not appeared till date so in the present report biosynthesis of silver nanoparticles using aqueous root extract of A. hispidissima (AHAgNPs), their characterization and evaluation of their therapeutic potential has been done.
Material and methods
Collection of plant material and preparation of root extract
Arnebia hispidissima (Lehm.) A. DC. plant material was collected from semi-arid regions of Jodhpur (26.6838°N latitude and 72.8988°E longitude), Rajasthan, India in the month of September 2017. The roots were cut, surface sterilized using distilled water, air-dried in shade and ground to fine powder. To prepare AHRE, 20 g root powder was added to 100 mL double distilled water and incubated in water bath at 60 °C for 120 min. It was then filtered and stored at 4 °C for further experiments.
Green synthesis of AgNPs
For AgNPs synthesis, 10 mL AHRE was added to 90 mL of different concentrations of aqueous silver nitrate (AgNO3) (Fisher Scientific, Mumbai, India) solution. The reaction mixture was stirred constantly at 60 ± 2 °C for 12 min at pH 7.5. Gradual change in colour of the solution from light yellow to brown was observed as the silver ions (Ag+) were reduced to Ag0 showing the formation of AHAgNPs.
Effect of AgNO3 concentrations, time, temperature and pH on AHAgNPs synthesis
To optimize the concentration of AgNO3 for AHAgNPs synthesis, different AgNO3 concentrations (0.5, 1, 2, 3, 4 and 5 mM) were used. Optimum time required for complete reduction of AgNO3 was determined by measuring absorption spectra at time intervals of 0, 6, 12, 18 and 24 min. In order to determine the effect of temperature on AHAgNPs synthesis, reaction was carried out at temperatures 40, 60 and 80 °C. Similarly, to study the effect of pH on AHAgNPs synthesis, the reaction was carried out at pH (3, 5, 7, 9 and 11) which was set using 0.1 N HNO3 and 0.1 N NaOH.
Characterization of AHAgNPs
The UV-Visible spectroscopy (DU 730, Beckman Coulter, CA, USA) was performed in the range 200–800 nm. The surface morphology and topography of AHAgNPs were determined using field emission scanning electron microscope (FE-SEM) (ZEISS GeminiSEM 500, Germany) operated at an accelerating voltage of 10 kV and elemental analysis was done using EDAX (Energy Dispersive X-ray analysis). Transmission electron microscopy, TEM (Tecnai G20 FEI, Oregon, USA) analysis was done to determine the shape and size of AHAgNPs at an accelerating voltage of 50–200 kV using carbon-coated copper grid. The crystalline nature of AHAgNPs was determined using X-ray diffraction analysis (XRD, Bruker D8 Discover, MA, USA) operated at 40 kV, 40 mA with Cu kα radiation (λ = 0.1541 nm) scanned from 10–80° (2θ range; step size 0.02/θ). Further, to determine their size distribution, zeta potential (surface charge) and stability, DLS (Dynamic light scattering) measurements were carried out using Zetasizer Nano ZS90 instrument (Malvern Instruments Ltd., UK) at 25 °C with a scattering angle of 90°. FT-IR spectrometry (Perkin Elmer, Spectrum RXI, Waltham, MA at resolution: 400 cm−1, detector: LiTaO3) was done to determine the functional groups of the bioactive compounds involved in metal reduction.
In vitro antioxidant activity of AHAgNPs
The anti-oxidant activity of AHRE and AHAgNPs was determined using DPPH and hydrogen peroxide (H2O2) radical scavenging assay. DPPH (2,2-Diphenyl-1-picrylhydrazyl) radical scavenging assay was performed following Brand Williams et al. [Citation11] with slight modifications. Briefly, different concentrations (20–100 µg/mL) of AHRE, AHAgNPs and Quercetin were added to DPPH solution (0.1 mM stock prepared in methanol) and incubated in dark for 30 min. Absorbance was recorded at 517 nm. For H2O2 radical scavenging assay 50 µL of AHRE, AHAgNPs and gallic acid in different concentrations (20–100 µg/mL) were added to 100 µL H2O2 (100 mM) solution. The reaction mixture was then incubated in dark for 30 min and absorbance was measured at 230 nm [Citation12]. In both the assays, percent scavenging activity was calculated by the formula [(AControl − ASample) /AControl] × 100. IC50 value was determined using Graph pad prism 7 software (Version 7.04, CA, USA).
Evaluation of in vitro anti-cancerous potential
MTT assay
Cytotoxicity of AHAgNPs and AHRE against HeLa cell line and their biocompatibility with L20 B cell line (non-malignant mouse cells) was examined using MTT [3‐(4, 5-dimethylthiazol-2-yl)-2, 5-diphenyltetrazolium bromide] assay [Citation13]. Cell lines were cultured in Dulbecco's modified eagle's medium (DMEM) having 10% fetal calf serum and 1% antibiotic-antimycotic solution. Cells in exponential growth phase were trypsinized and 5000 cells per well were seeded in a flat bottom 96 well plate for 24 h in a humidified 5% CO2 incubator at 37 °C. Different concentrations of AHAgNPs (2–12 µg/mL), AHRE (20–120 µg/mL), methotrexate (positive control, 10–60 µg/mL) and vehicle control (0.1% DMSO in incomplete DMEM medium) were added and further incubated for 24 h. Thereafter, 20 µL of MTT reagent (5 mg/mL in PBS) was added to it, followed by incubation for 4 h, subsequently, all wells were cleared off their constituents and 150 µL of DMSO was added to each well. The plates were then read in an ELISA plate reader (Tecan, Austria) at 540 nm (reference: 630 nm). Percent cell viability was calculated and IC50 was also determined.
Analysis of cellular morphology
To observe the cellular morphology, 0.1 × 10⁶ cells were seeded in 40 mm petri-dishes and subsequently treated with different concentrations of AHAgNPs (2–8 µg/mL) for 24 h and viewed under an inverted microscope (Nikon, Japan).
Trypan blue exclusion assay
HeLa cells (0.1 × 10⁶) were seeded (24 h) and treated with AHAgNPs (2–8 µg/mL) for 24, 48, 72 h. The cells from the control and treatment groups were trypsinized, washed and stained with trypan blue (Sigma Aldrich, USA) dye (4% in PBS) in 1:1 ratio and visualized under a light microscope (Carl Zeiss, Germany) to count the dead and live cells.
Acridine orange and ethidium bromide staining (AO/EtBr)
Cells (0.1 × 10⁶) were seeded in 40 mm petri-dishes (24 h) and treated with AHAgNPs (2–8 µg/mL) for 24 h. They were then washed with 100 µL PBS, stained with AO/EtBr (Sigma, USA) (100 µg/mL) dye mix and viewed under two filters (FITC: 502–526 nm and TRed: 510–595 nm) of the fluorescence microscope (Carl Zeiss, Axioscope, Germany).
Clonogenic assay
It was performed following the modified protocol of Franken et al. [Citation14], 0.1 × 10⁶ cells were seeded in 40 mm petri-dishes for 24 h and treated with AHAgNPs (2–8 µg/mL). Subsequently, 50 cells per petri-dish were again seeded and incubated for a week. The colonies thus obtained were fixed with glutaraldehyde (6.0% v/v), stained with crystal violet (1% w/v) and counted using a stereomicroscope. Further, plating efficiency (PE, colonies formed against initially seeded cells in control) and surviving fraction (SF, number of colonies formed after treatment of cells) were calculated according to the formula:
Evaluation of in vitro antimicrobial activity
The antifungal and antibacterial susceptibility pattern was evaluated using agar based well diffusion method. The activity of AHAgNPs was tested against the fungal strains namely Candida tropicalis (ATCC 750), C. albicans ATCC 24433, Geotrichum candidum ATCC 7115 and the bacterial strains were Escherichia coli (ATCC 25922), Klebsiella pneumoniae (ATCC 13883), Enterococcus faecalis (ATCC 29212) and Staphylococcus aureus (ATCC 25923). Mueller-Hinton agar medium supplemented with 2% glucose was used. The inoculum suspension was made by adjusting it to 0.5 McFarland standard i.e. 106 cells/mL. Sterile swab was dipped into the inoculum suspension and the agar plates were inoculated by streaking it along the agar surface in all directions spreading it as a lawn culture. A hole (diameter 8 mm) was punched aseptically using a sterile cork borer, and 100 µL of AHAgNPs and AHRE (0.125, 0.25, 0.5, 1 mg/mL) was introduced into the well. Plates were then incubated at 37 °C for 24 h till visible growth was seen. Amphotericin B was used as positive control for anti-fungal tests whereas amikacin, vancomycin and piptaz were used as positive controls for anti-bacterial tests. After incubation, the zone diameter endpoints were read at complete inhibition for all the treatments.
Quantification of dissolved silver in AHAgNPs suspension
It was done following the modified protocol of Dong et al. [Citation15] where AgNPs suspension was centrifuged at 4000 g for 20 min. at 4 °C. Then, 1 mL AgNPs suspension was acidified using 9 mL 70% HNO3 overnight at room temperature. Subsequently, it was diluted with deionized water. The silver content was measured by atomic absorption spectrometry (AAS Flame, SensAA, GBC Scientific equipment, Australia). Standards were also prepared along with samples to obtain a calibration curve for calculating silver concentrations.
Statistical analysis
Experiments were performed in triplicates and data presented as mean ± standard deviation. Statistical analysis was carried out using ANOVA (Analysis of Variance) through SPSS (Statistical Package for Social Science) version 16.0. The differences between means were tested for significance using Duncan’s multiple range test (DMRT) at p = 0.05. The UV-Vis measurements were carried out using OriginPro 2017 software (MA, USA).
Results and discussion
Green synthesis and characterization of AHAgNPs
UV-Vis spectroscopy
The colour change of reaction mixture from light yellow to brown due to the reduction of Ag+ ions into Ag0 indicated the formation of AHAgNPs. Mutual vibrations of free electrons of AgNPs with respect to metal lattice in resonance with the oscillating electromagnetic field of light waves, yields surface plasmon resonance (λspr) absorption band [Citation16]. A characteristic λspr was observed at 420 nm that is ascribed to resonant absorption of photons by AHAgNPs. The λspr depends on the properties of Ag colloids such as shape and size of AgNPs, the concentration of Ag+ ions, the volume of extract added and the bioactive compounds present in the plant extract. The colour change was found to be in direct correlation with the synthesis of nanoparticles as reported in neem leaves [Citation17].
Effect of AgNO3 concentrations on AgNPs synthesis
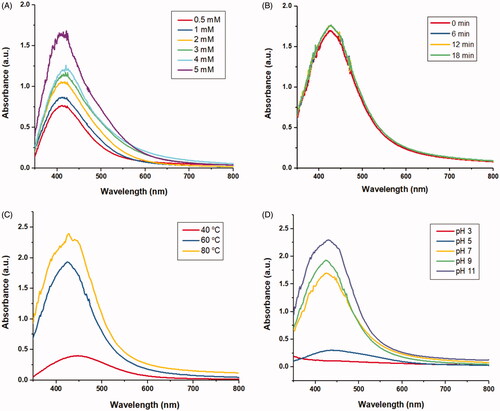
With increasing concentration of AgNO3, an increase in absorbance was observed with a simultaneous shift of λspr towards higher wavelength (red shift) indicating synthesis of larger size of AgNPs (). Similar findings were observed when nanoparticles were synthesized using Azadirachta indica leaf extract [Citation17].
Figure 1. Effect of (A) concentrations of AgNO3, (B) time, (C) temperature and (D) pH of reaction mixture on AgNPs synthesis using aqueous root extract of Arnebia hispidissima.
Effect of time on AgNPs synthesis
The wavelength scan was done from 200–800 nm and noticeable change in colour of reaction started after 5 min. Absorption maxima of AHAgNPs suspension increased with increasing the time of reaction as the absorbance at λspr (420 nm) increased from 1.669 a.u. (0 min) to 1.730 a.u. after 12 min and became stable with no further increase (). The faster bioreduction of AgNO3 to AHAgNPs could be due to the availability of large number of bioactive compounds in AHRE acting as both reducing and capping agents. Also, AHAgNPs were well dispersed and remained stable for over four weeks. Our findings are in accordance with the work of other researchers as complete reduction of AgNO3 by aqueous extract of Thymbra spicata occurred in 60 s [Citation18], whereas in Solanum xanthocarpum berry extract it was done in 30 min [Citation19].
Effect of temperature on AgNPs synthesis
Reaction temperature plays a crucial role in the biogenesis of AgNPs as it alters the rate of synthesis affecting their shape and size. Increasing temperature (40, 60, 80 °C) led to increase in absorbance along with shift towards lower wavelength (blue shift) from 446 to 420 nm (). In this study 60 °C was found to be optimum as rapid reduction of Ag ions was pertinent which brought faster change in colour of the reaction. Our results are supported by the study of Verma and Mehata [Citation17] where they reported shift of absorption spectra towards lower wavelength with increasing temperature. Similarly, Rashidipour and Heydari [Citation20] studied the effect of different temperatures (20, 30, 45, 60 °C) on AgNPs synthesis using Olea europaea leaf extract and reported that rapid reduction of Ag+ occurred at higher temperature (45 °C).
Effect of pH on AgNPs synthesis
Yet another important feature that determines AgNPs synthesis is pH. It also affects shape and size of AgNPs as it has the ability to alter the charge (ionization state) of phytoconstituents responsible for the reduction of AgNO3 which in turn affect their capping and stabilizing abilities. At pH 3, a flat UV spectrum was obtained whereas, at pH 7, 9 and 11 the absorption peaks were observed at 420, 426 and 430 nm, respectively (). So, acidic pH is not suitable for AHAgNPs synthesis while alkaline pH enhances it. We also observed that changing pH varied the colour of reaction which is ascertained to the difference in dissociation constants (pKa) of functional groups present in AHRE. Our findings are consistent with the previous studies where AgNPs were synthesized using Olea europaea leaf extract [Citation20].
FE-SEM, TEM and EDAX analyses
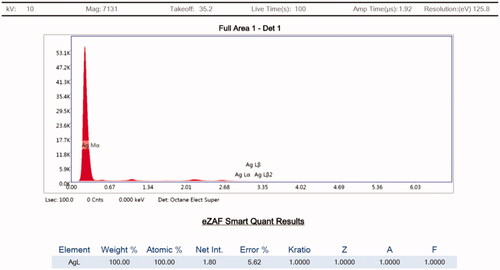
FE-SEM and TEM micrographs revealed that AHAgNPs were anisotropic, polydispersed and formed in a size range of 10–200 nm. FE-SEM micrographs showed triangle, pyramidal, trigonal bipyramidal, spherical and rod-shaped nanoparticles which were in the size range of 20–200 nm present in different aggregations though mainly spheres were predominant (). Whereas, TEM images showed triangle, rod, polygon, hexagon and spherical nanoparticles in the size range of 10–75 nm (). EDAX spectrum was recorded in the spot profile mode from one of the regions of the copper stub drop coated by AHAgNPs. It confirmed the AgNPs synthesis as the spectrum revealed silver as the principal ingredient element and AHAgNPs showed a strong signal peak at 0.310 keV and the weight percentage of silver was 100% (). Our results are similar to the nanoparticles synthesized using leaf extract of Musa balbisiana, Azadirachta indica, Ocimum tenuiflorum [Citation21]. Several other studies have reported the formation of a wide range of AgNPs both in terms of size (5–100 nm) and morphology (spherical, hexagonal, rods, etc.) using different plant extracts, green tea [Citation22] and Urtica dioica) [Citation23].
Figure 2. FE-SEM images of synthesized AgNPs illustrating anisotropic AgNPs triangular, spherical, pyramidal, trigonal bipyramidal (A–C, Scale = 200 nm) and rods (D, Scale = 1 µm).
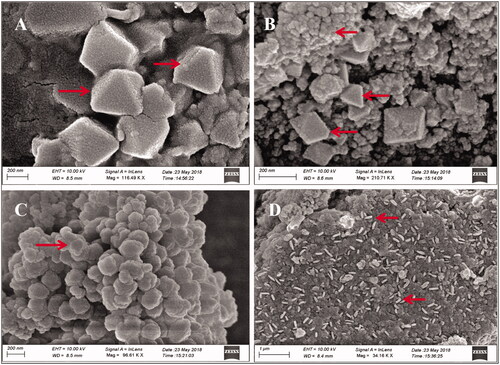
Figure 3. TEM images of synthesized AgNPs showing anisotropic AgNPs triangle, rods, hexagon, polygon and sphere (A–D, Scale = 50 nm).
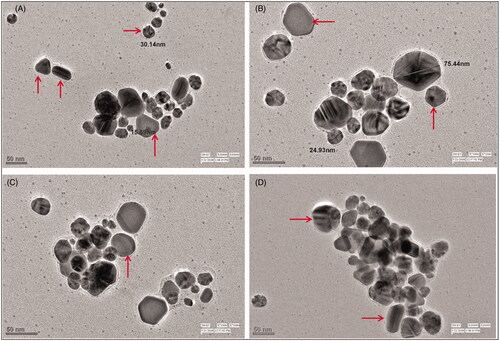
Figure 4. EDAX spectrum of the synthesized AgNPs.
XRD analysis
XRD pattern showed the Bragg's diffraction peaks at 38.02°, 44.30°, 64.42° and 77.42°, corresponding to (111), (200), (220) and (311) lattice planes respectively confirming the face centred cubic (FCC) crystal structure of AHAgNPs (). Few small peaks observed in the XRD pattern correspond to phytochemical compounds present in the root extract [Citation16]. Also, the average crystalline size of the synthesized AgNPs was estimated using Debye-Scherrer's equation [Citation24]:
Figure 5. XRD pattern of synthesized AgNPs.
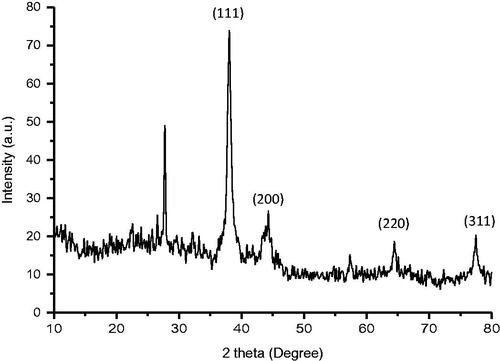
[K, Scherrer's constant (K = 0.9); λ, wavelength of X-ray radiation (0.15406 nm); β, full-width-at-half-maximum (FWHM) of the corresponding plane (in radians) and θ, diffraction angle]. The average crystallite size of the AHAgNPs was 15.96 nm as calculated by determining the width of most intense Bragg's reflection plane (111). Our results are consistent with the earlier reports of AgNPs synthesized using aqueous extract of spice blend formulation [Citation25].
DLS analysis and zeta potential measurements
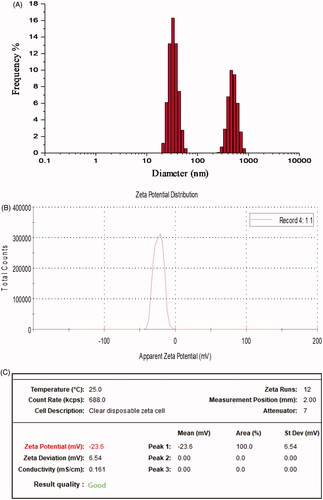
It provided further insight into size distribution profile of AHAgNPs, and it was observed that AHAgNPs suspension constituted smaller (20–60 nm) and moderate (200–500 nm) sized nanoparticles. Also, their zeta potential value was found to be −23.6 mV (). It indicates degree of electrostatic repulsion among the particles present in dispersion. The high negative potential is attributed to the capping action of bioactive compounds present in AHRE and further it indicates enhanced stability of AHAgNPs without agglomeration, their good colloidal nature, high dispersity and long-term stability due to repulsion among the particles. The high stability of AgNPs plays an important role for their application in biomedical and diagnostic fields [Citation2]. Similar results were obtained with the AgNPs synthesized from leaf extract of Convolvulus arvensis that had negative surface zeta potential value pointing towards their high stability and large surface area [Citation26].
Figure 6. DLS analysis showed (A) particle size distribution (B,C) Zeta potential measurement of synthesized AgNPs.
FTIR analysis
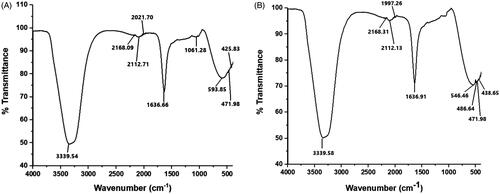
FTIR measurements were carried out to identify the biomolecules present in AHRE responsible for the reduction of AgNO3 to AHAgNPs. The spectra of both of them were more or less similar with a small shift and slight change in percent transmittance of AHAgNPs spectrum which could be due to the co-ordination of phytochemical compounds with metal surface (). The peak formed at 3339.54 is due to O–H stretching vibrations of phenolic compounds [Citation27] or N–H stretching vibrations of amines [Citation28]. Rasheed et al. also reported that peaks at 3440 and 3126 cm−1 corresponds to secondary amine and phenolic hydroxyl groups which suggested that hydroxyl groups reduce Ag+ and are oxidized to carbonyl groups in the process [Citation26]. Also, in case of AgNPs synthesized using Artemisia vulgaris leaves extract, the band vibrations at 3419 and 3151 cm−1 are designated to −OH stretching of the phenolic group [Citation5]. It suggests that alkaloids with polyphenols might be involved in the reduction of AgNO3 and stabilization of AHAgNPs. According to the studies of Shanmugam et al. [Citation29], these bonds could be due to the stretching of –OH in proteins, enzymes or polysachharides present in the extract. The peaks at 2168.09, 2112.71 corresponds to S–C≡N (thiocyanate class of functional groups) or C≡C (alkyne stretch) and C–H2 stretching of aldehydic amines, respectively. Peak at 2112.71 could be raised due to C=O stretching of the aromatic groups [Citation2]. Peaks at 2112.71 and 1636.66 shows involvement of both polyphenols and flavonoids in the reduction of AgNO3. The peak at 1636.66 could be due to C=N, C=O, C=C and are a definite indicator of amide I and amide II linkages of proteins [Citation30]. Plausibly, proteins were involved in coating/capping of AHAgNPs leading to long term stability as was confirmed by zeta potential measurement. The peak at 1061.28 cm−1 might be due to C–OH of carboxylic acids [Citation27]. The peak at 593.85 cm−1 corresponds to C–Br moiety. The peaks clearly indicate the participation of proteins, polyphenols, flavonoids, hydroxyl, amine, carboxyl groups take part in the formation and stabilization of AHAgNPs.
Figure 7. FTIR spectrum of synthesized AgNPs (A) and aqueous root extract (B).
Evaluation of in vitro anti-oxidant activity of AHAgNPs
DPPH radical scavenging activity
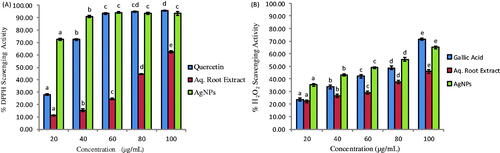
Initially, AHAgNPs exhibited dose-dependent increase in the DPPH free radicals scavenging activity with increasing concentration from 20 to 40 µg/mL; then, it became almost constant at higher concentrations (60–100 µg/mL) showing approximately 94% radical scavenging activity (). The IC50 values for AHRE, AHAgNPs and Quercetin were 86.01, 9.86 and 27.91 µg/mL, respectively. Several authors have reported similar antioxidant capacity of AgNPs as the IC50 value in case of AgNPs synthesized using spice blend formulation was 31.2 µg/mL [Citation25], Indigofera tinctoria leaf extract was 10.04 ± 0.51 µg/mL [Citation31] and Cymbopogon citratus leaf extract was 30.60 µg/mL [Citation32].
Figure 8. (A) DPPH radical scavenging activity; (B) H2O2 radical scavenging activity.
Hydrogen peroxide (H2O2) radical scavenging assay
A concentration-dependent increase in the H2O2 radical scavenging activity of AHAgNPs was observed showing maximum inhibition (65.07%) at 100 µg/mL AHAgNPs (). The IC50 values for AHRE, AHAgNPs and gallic acid against H2O2 radicals were 159.2, 53.78 and 67.13 µg/mL, respectively. Our results are similar to the antioxidant potential of AgNPs synthesized using leaf extract of I. tinctoria that showed 65.75% inhibition at 200 µg/mL concentration [Citation31].
Oxidative stress causes lipid peroxidation, enzyme inactivation, damage to protein (fragmentation at amino acid residues, formation of protein-protein cross-linkages, etc.) and alterations in DNA bases which ultimately leads to various disorders and diseases such as cancer. Antioxidants quench free radicals and AHAgNPs were found to possess strong antioxidant activity so their potential for treatment of HeLa cancer was tested.
Evaluation of anti-cancerous activity
MTT assay
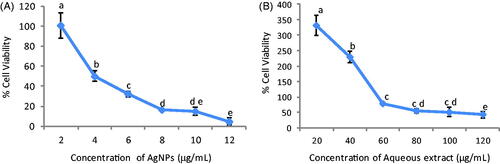
In the present investigation, AHAgNPs and AHRE showed dose-dependent decrease in percent cell viability of HeLa cells pointing towards strong cytotoxic effect of AHAgNPs (). Also, they were found to be biocompatible with normal L20 B cell line as they did not show any cytotoxicity towards these cells. IC50 for AHAgNPs and AHRE against HeLa cells was 4.44 µg/mL and 100.7 µg/mL, respectively.
Figure 9. Graph depicting effect of (A) AgNPs (2–12 µg/mL) and (B) aqueous root extract (20–120 µg/mL) on HeLa cells through MTT assay.
Analysis of the cellular morphology
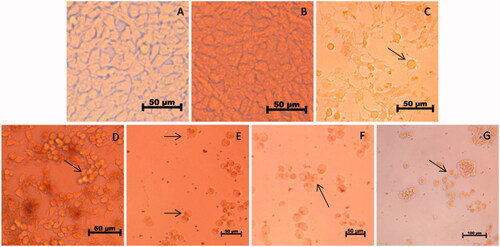
HeLa cells treated with various concentrations of AHAgNPs showed distortions and irregularities in shape as cell shrinkage, detachment of the cells from substratum, membrane blebbing was observed. The dead cells appeared round in shape, which were quite evident at 4, 6 and 8 µg/mL AHAgNPs concentration ().
Figure 10. (A–G) Dose dependent effect of AgNPs on the morphology of HeLa cells. In the order: Control (A), vehicle control (B), positive control (C), 2 μg/mL (D), 4 μg/mL (E), 6 μg/mL (F), 8 μg/mL and (G) AgNPs treated cells, respectively. Magnification: 40×. Arrows represent dead cells and apoptotic features such as echinoid processes, cell shrinkage and nuclear condensation.
Trypan blue exclusion assay
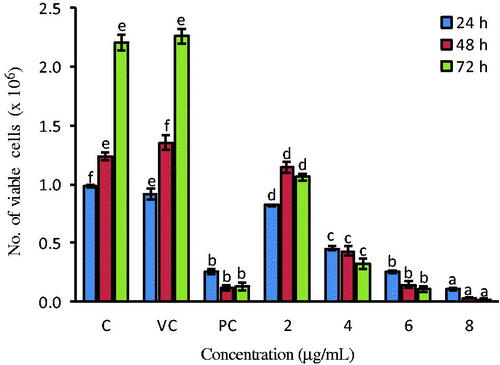
Trypan blue dye stains only dead cells with blue colour excluding live cells which remain unstained, and it was found that with an increase in AHAgNPs concentration, number of live cells decreased sharply, indicating a strong cytotoxic effect of the AHAgNPs on HeLa cells thus corroborating the MTT results ().
Figure 11. Cell viability of HeLa cells after AgNPs treatment as assessed by trypan blue exclusion assay.
Acridine orange and ethidium bromide staining (AO/EtBr)
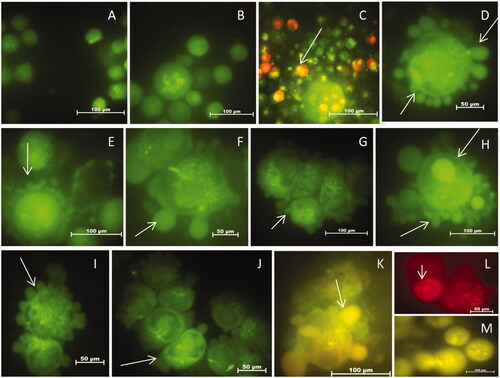
HeLa cells without AHAgNPs in growth medium appeared round and green with intact membrane, whereas in treated cells (2–8 µg/mL AHAgNPs) loss of membrane integrity (membrane blebbing), condensed, fragmented nuclei and apoptotic bodies were observed (). The results indicated that cells were in early apoptotic stage as they show fragmented nuclei which fluoresced green.
Figure 12. (A–m) Dose dependent detection of apoptosis in HeLa cells through Acridine Orange and Ethidium Bromide Staining after treatment with AgNPs. In the order: Control (A), vehicle control (B), positive control (c,d), 2 μg/mL (e,f) 4 μg/mL (g,h), 6 μg/mL (i–k), 8 μg/mL and (l,m) AgNPs respectively. Magnification: 100×. Arrows represent dead cells and apoptotic features such as nuclear condensation, fragmentation and apoptotic bodies.
Clonogenic cell survival assay
It was done to determine the anti-proliferative effect and cell reproductive death after treatment of cells with AHAgNPs. The results indicated that clonogenic capacity of HeLa cells was reduced in dose-dependent manner as at higher concentrations number of colonies and surviving fraction was greatly reduced (; ). Only a fraction of seeded cells retained the capacity to produce colonies after treatment with varying AHAgNPs concentrations that might have caused cell reproductive death due to damage of chromosomes, apoptosis, etc. Our results are in agreement with the studies performed by Kulkarni et al. [Citation33] where treatment with increasing concentration of AgNPs synthesized using Deionococcus radiodurans exhibited a dose-dependent decrease in number of colonies, effectively inhibiting growth of MCF-7 cancer cells. Similarly, AgNPs synthesized using starch showed concentration-dependent cell death of HCT116 cell line where 85% cell death occurred at 200 µM [Citation34].
Figure 13. Anti-proliferative effect of AgNPs on HeLa cell line as seen by Clonogenic assay. (A) a: control, b: vehicle control, c: positive control, d–g: 2, 4, 6, 8 µg/mL AgNPs, respectively. (B) Number of colonies versus treatment plot.
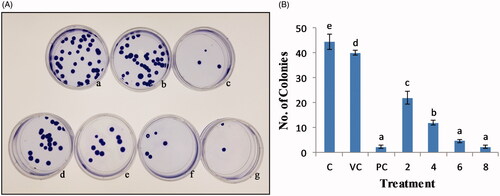
Figure 14. Antimicrobial activity of the AgNPs against fungal species (A) Geotrichum candidum, (B) C. tropicalis, (c) C. albicans and bacterial species, (d) E. coli, (e) K. pneumoniae, (f) S. aureus and (g) E. faecalis. Inhibition zones observed by AgNPs, (i) 0.125 mg/mL, (ii) 0.25 mg/mL, (iii) 0.5 mg/mL, (iv) 1 mg/mL, (c) Inhibition zones by standard drug.
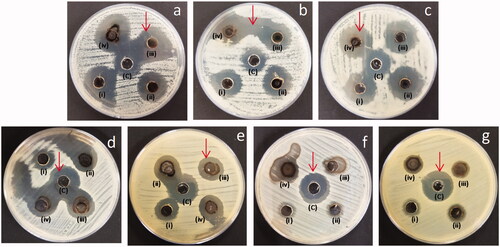
Table 1. Clonogenic cell survival assay depicting number of colonies and surviving fraction (SF) for HeLa cells at different concentrations of AHAgNPs treatment.
Cellular uptake of nanoparticles occurs through phagocytosis, pinocytosis and endocytosis (caveolae/lipid raft-mediated endocytosis prevents their degradation by lysosomes, clathrin/caveolae-independent and clathrin-mediated) [Citation35]. AgNPs impart toxicity to cancer cells by embroilment in mitochondrial function, releasing lactate dehydrogenase, disrupting cell cycle, inducing apoptotic genes such as upregulation of Bax, downregulation of Bcl-2, development of micronuclei, chromosomal aberration and DNA damage [Citation36]. Rasheed et al. [Citation37] reported antiproliferative activity of AgNPs synthesized using methanolic leaves extract of Taraxacum officinale against MCF7 cell line and also observed granulations in nuclei and chromatin condensation. Bilal et al. [Citation6] studied the cytotoxicity profile of AgNPs loaded chitosan-alginate constructs and revealed complete bicompatibility against normal cell line L929 but considerable cytotoxicity against HeLa cancer cell. Jeyaraj et al. [Citation38] studied AgNPs induced cytotoxicity studies against HeLa cell line and found that Bax and Bcl-2 genes regulated the caspases 3, 8, 9 responsible for apoptotic cell death. Therapeutic efficiency of the nanoparticles depends on their shape, size and surface charge as they affect its hemorheological dynamics, cellular uptake and in vivo fate. In the present study, negatively charged anisotropic AHAgNPs exhibited high anti-cancerous potential that might be attributed to their different shapes and surface charge. Nonspherical nanoparticles exhibit tumbling and oscillatory effects showing lateral drift in vasculature which greatly enhances their interaction with vessel walls. This enhances the particle binding by establishing contact/binding points and adhesion to endothelium. So, the nanoparticles with different shapes having high aspect ratios and minimal regions of curvature are preferred for the enhanced accumulation of therapeutics in tumours. Also, negatively charged nanoparticles are known to have prolonged circulating half-life [Citation35].
Evaluation of in vitro antimicrobial activity
The diameter of inhibition zones produced by AHRE, AHAgNPs and positive controls were compared (, and ). It was observed that AHAgNPs displayed stronger inhibition against all the fungal and bacterial strains tested when compared with AHRE. This could be due to the synergistic effect of silver core, phenols, flavonoids and proteins forming the AHAgNPs. Also, gram-negative bacteria are more affected than gram-positive bacteria due to the absence of peptidoglycan layers making it easy for AHAgNPs to reach cell membrane. Our findings concur with the results of previous studies where AgNPs synthesized using leaf extract of Indigofera hirsuta effectively inhibited growth of Candida albicans, C. nonalbicans, C. tropicalis [Citation2]. Also, the ZnO nanoparticles synthesized using Crinum latifolium leaf extract exhibited anticandidal activity [Citation39]. The antifungal activity might be attributed to the destruction of fungal membrane integrity and inhibition of fungal cell cycle as the AgNPs cause membrane depolarization, pits on cell surface and pores in their plasma membrane [Citation40]. The antimicrobial activity of the AgNPs mainly depends on their size, shape and negative surface charge. Also, as the nanoparticles have large surface area to volume ratio, their area of contact with microorganisms is enhanced leading to strong antimicrobial effect. Similar to our findings, the antibacterial activity of AgNPs synthesized using Rheum palmatum against S. aureus and P. aeruginosa has been reported [Citation41]. Rasheed et al. [Citation37] reported potential antibacterial activity of AgNPs synthesized using Taraxacum officinale leaves extract against S. aureus, E. coli, Haemophilus influenzae and antibiofilm activity against P. aeruginosa and S. aureus. The observed bactericidal activity might be due to alteration of bacterial cell wall because of their interaction with AgNPs which causes membrane permeability leading to leakage of intracellular ions and reducing sugars causing cell death. AgNPs also react with biomaterial rich in phosphorus and sulphur, such as DNA or proteins, membrane proteins affecting respiration, division and survival of cells [Citation42].
Table 2. In vitro antifungal activity of AHAgNPs.
Table 3. In vitro antibacterial activity of AHAgNPs.
Quantification of dissolved silver in AHAgNPs suspension
It was observed that total Ag dissolved in the nanoparticle suspension was 20 ± 0.8 ppm. The mechanism of antimicrobial activity and toxicity of silver nanoparticles is still not well understood. The silver ion must be in its ionized form as Ag+ to act as an antimicrobial agent. Silver is inert in its ionized form but releases Ag+ when it comes in contact with water or moisture. The AgNPs accumulate and penetrate in cell wall or cell membrane to form a stable S–Ag bond with the compounds containing thiol (–SH) groups leading to deactivation of enzymes of the cell. The AgNPs and Ag cause interference with disulphide bonds affecting the cellular glycoproteins and impede microbial functions [Citation43]. Probably the similar mechanism showing antimicrobial activity might have occurred in our study also.
Conclusion
To the best of our knowledge, present study is the first report of synthesis and characterization of AHAgNPs where evaluation of their antioxidant, anticancer and antimicrobial activity has been done. We have reported facile, one-step, rapid, efficient and eco-friendly approach for the synthesis of AgNPs. The AHAgNPs were crystalline in nature, polydispersed and anisotropic with a varying size range. Their therapeutic potential was screened, and it was observed that they had strong anti-oxidant potential and had shown remarkable anti-cancerous and anti-microbial activity. In vitro studies performed revealed the high utility of AHAgNPs for various biomedical applications but further in vivo studies are needed to be performed in future to understand their functioning and explore their utility in biological systems.
Acknowledgements
Authors acknowledge University Science Instrumentation Centre, D.U. for providing facilities for successful completion of work. SN is indebted to UGC, India for the award of RGNF JRF and SRF.
Disclosure statement
No potential conflict of interest was reported by the authors.
Additional information
Funding
Related Research Data
References
- Chugh H, Sood D, Chandra I, et al. Role of gold and silver nanoparticles in cancer nano-medicine. Artif Cells Nanomed Biotechnol. 2018;12:1–11.
- Netala VR, Bukke S, Domdi L, et al. Biogenesis of silver nanoparticles using leaf extract of Indigofera hirsuta L. and their potential biomedical applications (3-in-1 system). Artif Cells Nanomed Biotechnol. 2018;6:1–11.
- Pizzino G, Irrera N, Cucinotta M, et al. Oxidative stress: Harms and benefits for human health. Oxid Med Cell Longev. 2017;2017:8416763
- Barabadi H, Ovais M, Shinwari ZK, et al. Anti-cancer green bionanomaterials: Present status and future prospects. Green Chem Lett Rev. 2017;10:285–314.
- Rasheed T, Bilal M, Iqbal HM, et al. Green biosynthesis of silver nanoparticles using leaves extract of Artemisia vulgaris and their potential biomedical applications. Col Surf B Biointerfaces. 2017;158:408–415.
- Bilal M, Rasheed T, Iqbal HM, et al. Development of silver nanoparticles loaded chitosan-alginate constructs with biomedical potentialities. Int J Biol Macromol. 2017;105:393–400.
- Barabadi H, Honary S, Mohammadi MA, et al. Green chemical synthesis of gold nanoparticles by using Penicillium aculeatum and their scolicidal activity against hydatid cyst protoscolices of Echinococcus granulosus. Environ Sci Pollut Res. 2017;24:5800–5810.
- Singh B, Sharma RA. Yield enhancement of phytochemicals by Azotobacter chroococcum biotization in hairy roots of Arnebia hispidissima. Ind Crops Prod. 2016;81:169–175.
- Damianakos H, Kretschmer N, Sykłowska-Baranek K, et al. Antimicrobial and cytotoxic isohexenylnaphthazarins from Arnebia euchroma (Royle) Jonst.(Boraginaceae) callus and cell suspension culture. Molecules. 2012;17:14310–14322.
- Hamdard ME, Badar Y, Khan MS, et al. Revised phytochemical study of Arnebia hispidissima. Pak J Pharm Sci. 1988;1:19–20.
- Brand-Williams W, Cuvelier ME, Berset C. Use of a free radical method to evaluate antioxidant activity. LWT – Food Sci Technol. 1995;28:25–30.
- Patel A, Patel A, Patel A, et al. Determination of polyphenols and free radical scavenging activity of Tephrosia purpurea Linn leaves (Leguminosae). Phcog Res. 2010;2:152–158.
- Mosmann T. Rapid colorimetric assay for cellular growth and survival: Application to proliferation and cytotoxicity assays. J Immunol Methods. 1983;65:55–63.
- Franken NA, Rodermond HM, Stap J, et al. Clonogenic assay of cells in vitro. Nat Protoc. 2006;1:2315–2319.
- Dong F, Valsami-Jones E, Kreft JU. New, rapid method to measure dissolved silver concentration in silver nanoparticle suspensions by aggregation combined with centrifugation. J Nanopart Res. 2016;18:259.
- Anandalakshmi K, Venugobal J, Ramasamy V. Characterization of silver nanoparticles by green synthesis method using Pedalium murex leaf extract and their antibacterial activity. Appl Nanosci. 2016;6:399–408.
- Verma A, Mehata MS. Controllable synthesis of silver nanoparticles using Neem leaves and their antimicrobial activity. J Radiat Res Appl Sci. 2016;9:109–115.
- Veisi H, Azizi S, Mohammadi P. Green synthesis of the silver nanoparticles mediated by Thymbra spicata extract and its application as a heterogeneous and recyclable nanocatalyst for catalytic reduction of a variety of dyes in water. J Clean Prod. 2018;170:1536–1543.
- Amin M, Anwar F, Janjua MR, et al. Green synthesis of silver nanoparticles through reduction with Solanum xanthocarpum L. berry extract: Characterization, antimicrobial and urease inhibitory activities against Helicobacter pylori. Ijms. 2012;13:9923–9941.
- Rashidipour M, Heydari R. Biosynthesis of silver nanoparticles using extract of olive leaf: Synthesis and in vitro cytotoxic effect on MCF-7 cells. J Nanostructure Chem 2014;4:112.
- Banerjee P, Satapathy M, Mukhopahayay A, et al. Leaf extract mediated green synthesis of silver nanoparticles from widely available Indian plants: Synthesis, characterization, antimicrobial property and toxicity analysis. Bioresour Bioprocess 2014;1:3.
- Karade VC, Waifalkar PP, Dongle TD, et al. Greener synthesis of magnetite nanoparticles using green tea extracts and their magnetic properties. Mater Res Express. 2017;4:096102.
- Jyoti K, Baunthiyal M, Singh A. Characterization of silver nanoparticles synthesized using Urtica dioica Linn. leaves and their synergistic effects with antibiotics. J Radiat Res Appl Sci. 2016;9:217–227.
- Ajitha B, Reddy YA, Reddy PS. Biogenic nano-scale silver particles by Tephrosia purpurea leaf extract and their inborn antimicrobial activity. Spectrochim Acta A Mol Biomol Spectrosc. 2014;121:164–172.
- Otunola GA, Afolayan AJ. In vitro antibacterial, antioxidant and toxicity profile of silver nanoparticles green-synthesized and characterized from aqueous extract of a spice blend formulation. Biotechnol Biotechnol Equip. 2018;32:724–733.
- Rasheed T, Bilal M, Li C, et al. Catalytic potential of bio-synthesized silver nanoparticles using Convolvulus arvensis extract for the degradation of environmental pollutants. J Photochem Photobiol B, Biol. 2018;181:44–52.
- Netala VR, Murali BS, Bobbu PL, et al. Biogenesis of silver nanoparticles using endophytic fungus Pestalotiopsis microspora and evaluation of their antioxidant and anticancer activities. IJN. 2016;11:5683–5696.
- Carmona ER, Benito N, Plaza T, et al. Green synthesis of silver nanoparticles by using leaf extracts from the endemic Buddleja globosa hope. Green. Chem Lett Rev. 2017;10:250–256.
- Shanmugam N, Rajkamal P, Cholan S, et al. Biosynthesis of silver nanoparticles from the marine seaweed Sargassum wightii and their antibacterial activity against some human pathogens. Appl Nanosci. 2014;4:881–888.
- Magudapathy P, Gangopadhyay P, Panigrahi BK, et al. Electrical transport studies of Ag nanoclusters embedded in glass matrix. Physica B Condens Matter. 2001;299:142–146.
- Vijayan R, Joseph S, Mathew B. Indigofera tinctoria leaf extract mediated green synthesis of silver and gold nanoparticles and assessment of their anticancer, antimicrobial, antioxidant and catalytic properties. Artif Cells Nanomed Biotechnol. 2018;46:861–871.
- Ajayi E, Afolayan A. Green synthesis, characterization and biological activities of silver nanoparticles from alkalinized Cymbopogon citratus Stapf. Adv Nat Sci: Nanosci Nanotechnol. 2017;8:015017.
- Kulkarni RR, Shaiwale NS, Deobagkar DN, et al. Synthesis and extracellular accumulation of silver nanoparticles by employing radiation-resistant Deinococcus radiodurans, their characterization, and determination of bioactivity. Int J Nanomed. 2015;10:963–974.
- Satapathy SR, Mohapatra P, Preet R, et al. Silver-based nanoparticles induce apoptosis in human colon cancer cells mediated through p53. Nanomedicine. 2013;8:1307–1322.
- Blanco E, Shen H, Ferrari M. Principles of nanoparticle design for overcoming biological barriers to drug delivery. Nat Biotechnol. 2015;33:941–951.
- Zhang XF, Shen W, Gurunathan S. Silver nanoparticle-mediated cellular responses in various cell lines: An in vitro model. IJMS. 2016;17:1603.
- Rasheed T, Bilal M, Li C, et al. Biomedical potentialities of Taraxacum officinale-based nanoparticles biosynthesized using methanolic leaf extract. CPB. 2017;18:1116–1123.
- Jeyaraj M, Rajesh M, Arun R, et al. An investigation on the cytotoxicity and caspase-mediated apoptotic effect of biologically synthesized silver nanoparticles using Podophyllum hexandrum on human cervical carcinoma cells. Col Surf B Biointerfaces. 2013;102:708–717.
- Jalal M, Ansari MA, Ali SG, et al. Anticandidal activity of bioinspired ZnO NPs: Effect on growth, cell morphology and key virulence attributes of Candida species. Artif Cells Nanomed Biotechnol. 2018;14:1–4.
- Kim KJ, Sung WS, Suh BK, et al. Antifungal activity and mode of action of silver nano-particles on Candida albicans. Biometals. 2009;22:235–242.
- Arokiyaraj S, Vincent S, Saravanan M, et al. Green synthesis of silver nanoparticles using Rheum palmatum root extract and their antibacterial activity against Staphylococcus aureus and Pseudomonas aeruginosa. Artif Cells Nanomed Biotechnol. 2017;45:372–379.
- Chung IM, Park I, Seung-Hyun K, et al. Plant mediated synthesis of silver nanoparticles: their characteristic properties and therapeutic applications. Nanoscale Res Lett 2016;11:40.
- Bilal M, Rasheed T, Iqbal HM, et al. Silver nanoparticles: Biosynthesis and antimicrobial potentialities. International J of Pharmacology. 2017;13:832–845.