
Abstract
Objective
Silver nanoparticles (AgNPs) are widely used in orthopaedic implants because of their excellent antimicrobial properties. However, the effects of AgNPs on bone cells and osteogenic activity are still poorly understood.
Method
Here, we investigated the effect of AgNPs on the cell viability, uptake, and osteogenic activity of osteoblast-like cells (MG-63 cells) at low concentrations.
Results
Our results showed that uptake and retention of AgNPs reduced the cell viability and increased cell membrane penetrability even after termination of exposure of MG-63 cells to AgNPs. In addition, AgNPs induced cell shrinkage, reduced the expressions of ALP, COL-I, OCN and OPG, and enhanced the expressions of Runx2 and RANKL.
Conclusion
Collectively, our work demonstrated that the cytotoxic effects of low-dose AgNPs on MG-63 cells persisted even after termination of exposure. AgNPs may interfere with bone formation. More attention should be paid to the toxicity of AgNPs during the design of future orthopaedic implants.
Introduction
Rapid advances in material science and medicine have facilitated the development of a wide range of orthopaedic and dental implants that help improve the quality of life of patients. However, implant infection is a major problem that typically necessitates costly treatment [Citation1]. Silver nanoparticles (AgNPs) are widely used in the field of medicine; moreover, some consumer cosmetic products also contain AgNPs because of their excellent antimicrobial property [Citation2,Citation3]. Use of AgNPs as surface coating for orthopaedic implants and as an additive compound in bone cement have been shown to reduce the infection rates [Citation4–6].
Induction of growth of osteoblasts and promotion of osteogenic differentiation are important attributes of bone repair materials. As antimicrobial coating agents, AgNPs have been shown to enhance bone cell mineralization and differentiation through miRNA regulation [Citation7–10]. For instance, AgNPs can be incorporated into the surface of titanium implants by plasma immersion ion implantation process and have been shown by activating the integrin-α5-orchestrated MAPK/ERK signal cascade to promote osteogenesis [Citation11]. In situ synthesis was also used to incorporate AgNPs to titanium surface and has been observed a sustained release time of Ag+ up to 28 days [Citation4].
However, recent studies have revealed potential health risks associated with use of AgNPs for orthopaedic tissue repair. For example, AgNPs were shown to have cytotoxic effects (induction of cell death, cell-cycle arrest) on osteoblast or osteoblast-like cells [Citation12–14]. However, the effects of AgNPs on bone cells and bone formation and their underlying mechanisms are not well characterized.
Previous studies were largely based on very high concentrations exposure for short periods of times, which does not mimic the real-world exposure environment when AgNPs are used as antimicrobial coating on orthopaedic and dental implants. Interestingly, recent studies demonstrated that under low-dose exposure conditions, AgNPs may display ‘‘hormesis’’ effects by accelerating cell proliferation, which may translate into a potential carcinogenic risk [Citation15–19]. Thus, investigation of the effects of prolonged exposure of osteoblasts to low-dose (even non-cytotoxic dose) AgNPs is of significant clinical relevance. In addition to the amount of AgNPs exposure, it is also essential to evaluate the retention effect on osteoblasts upon cessation of exposure to AgNPs.
Many studies have reported that Ag+ release from AgNPs take the major responsibility of their cytotoxicity [Citation20,Citation21]. Current studies found that the AgNPs can act as a transport vehicle for delivering Ag+ into cells which was called “Trojan-horse” mechanism [Citation22,Citation23]. As a result, AgNPs are uptaken by the cells in particle form and then dissolve to active ions to cause the toxicity. The “Trojan-horse” mechanism demonstrates that the cytotoxic effect of AgNPs may be attributed to the synergistic toxicity from both AgNPs and Ag+ [Citation22,Citation23]. Therefore, AgNPs showed more serious biological toxic effects than Ag+. Based on these researches, in the present study, we exposed the osteoblast-like cell line MG63 to AgNPs. Different cell parameters were investigated: cell viability and proliferation, membrane integrity, endocytosis, and osteogenic activity of osteoblasts after exposure to a low dose of AgNPs. We also investigated the retention effect on osteoblasts after termination of exposure to AgNPs.
Material and methods
Ethical approval
The study was approved by the Institutional Ethics Committee of our hospitals, and written informed consent was obtained from all participants.
Characterization of AgNPs
AgNPs (<100 nm, Product No. 576832) were purchased from Sigma-Aldrich (Saint Louis, MO, USA). The average size of the nanoparticles was measured by transmission electron microscopy (TEM, JEM-2010, JEOL Ltd., Tokyo, Japan). Nanoparticle size, agglomerates, and charge measurements in high glucose Dulbecco modified Eagle medium (DMEM, Gibco-Invitrogen Company Paisley, UK) including 10% fetal bovine serum (FBS, Gibco-Invitrogen Company Paisley, UK) were determined with dynamic light scattering (DLS), and the zeta potential measured using ZetaSizer (Malvern Instruments Ltd., Worcestershire, UK) at a dose of 1 mg/mL. In order to ensure the dispersion of nanoparticles in fluids, the suspension of AgNPs was sonicated under ultrasonic pulses of 600 W at 20 kHz for 30 min.
Cell culture and AgNPs treatment
Osteoblast-like MG-63 cells were obtained from the Cell Bank of Type Culture Collection of the Chinese Academy of Sciences, Shanghai. The cells were cultured in high-glucose DMEM containing 10% FBS, 100 U/mL penicillin and 100 μg/mL streptomycin (Sigma Chemical Company, Saint Louis, MO, USA) at 37 °C in 5% CO2. AgNPs were ultraviolet (UV)-sterilized for 4 h prior to their use and suspended in culture medium at different concentrations. Suspensions were sonicated for at least 30 min (600 W; 20 kHz) to generate a homogenous suspension immediately prior to their use. After attachment of cells in the completed medium for 24 h, freshly dispersed serial dilutions of AgNPs suspensions (0.5, 5, 10 and 20 µg/mL) were immediately applied to the cells. Cells that received only medium (without AgNPs) were used as negative controls. After exposure of cells to different concentrations for different durations of time(exposure for 24, 48, and 72 h and retention of AgNPs at 24, 48, and 72 h after termination of exposure), parts of these cells were rinsed thrice with PBS to clean out the AgNPs and collected for further detection. After changing the medium, another part of the cells was sequentially cultured and examined for the retention effect of AgNPs at various post-exposure time points.
Assessment of uptake of AgNPs using inductively coupled plasma mass spectrometry (ICP-MS) and transmission electron microscopy (TEM)
The uptake of AgNPs by MG-63 cells was detected using ICP-MS. MG-63 cells in 6-well plates were exposed to different concentrations of AgNPs (0.5, 5, 10 and 20 µg/mL) for 24, 48, and 72 h and the retention of AgNPs assessed at 24, 48, and 72 h after termination of exposure. At each time point, after trypsinization, and centrifugation at 1000 rpm, the cells were resuspended in deionized water and dried overnight. The 50 wt% HF (100 ml) and 2 wt% HNO3 (9.9 ml) were added to dissolute the AgNPs and cells with ultrasound. These clear acidic solutions were diluted to a volume of 50 ml and used for ICP-MS analysis. The mass of AgNPs in the MG-63 cells was measured by detecting the silver concentration with ICP-MS. Experiments were conducted in five individual replicates for each concentration and time point; and each experiment included a negative control arm.
TEM images of untreated and AgNP-treated cells were obtained in order to determine the uptake of particles by the MG-63 cells. Briefly, after treatment of cells with 5 µg/mL AgNPs for 72 h and at 72 h after termination of exposure, MG-63 cells were collected and centrifuged at 1500 g at 4 °C for 10 min. The cell pellets were fixed with 2.5% glutaraldehyde solution at 4 °C overnight. After further fixation with osmium acid, the cells were dehydrated with pyruvic acid and coated with epon. The cells were visualized using TEM (TEM, JEM-2010, Tokyo, Japan).
MTS assay and LDH measurement
The MG-63 cells (six poles per group for each time point) were seeded in 96-well plates at a density of 2 × 10⁴ cells/well for 24, 48 and 72 h exposure to different concentrations of AgNPs (0.5, 5, 10 and 20 µg/mL) and at 24, 48 and 72 h after termination of exposure. CellTiter 96® Assay (MTS) kit (Promega, Madison, WI, USA) was used to evaluate the mitochondrial function and viability of MG-63 cells cultured in medium containing different concentrations of AgNPs at different time points. Following incubation with MTS reagent in serum-free culture medium for 3 h, the plate was read at 490 nm with a Bio-Rad ELISA reader (Bio-Rad, Richmond, CA, USA).
LDH Kit (Beyotime Biotech, Nantong, China) was used to evaluate the membranes damage of MG-63 cells. The experimental design was the same as MTS assay. Briefly, the cell culture medium was collected from different groups for LDH measurement according to the manufacturer’s protocol. The absorbance values after colorimetric reaction were measured at 490 nm with a reference wavelength of 655 nm, using a Bio-Rad ELISA reader (Bio-Rad, Richmond, CA, USA).
Observation of osteoblast cytoskeleton morphology
In this part of the experiment, MG-63 cells were divided into five groups: control; 0.5 µg/mL AgNPs exposure for 72 h; 5 µg/mL AgNPs exposure for 72 h; after termination of 0.5 µg/mL AgNPs exposure for 72 h; and after termination of 5 µg/mL AgNPs exposure for 72 h. Cells were digested, and 1 × 10⁵/mL cell suspensions prepared and placed in culture dishes. Different concentrations of AgNPs (0.5 and 5 μg/mL) were added to the dishes and cultivated for 72 h. After discontinuation of AgNPs exposure, the cells were further cultured for 72 h. The cell culture dishes from each group were taken out and subjected to cytoskeleton fluorescence staining. Briefly, the cells were fixed with 4% polyformaldehyde at 4 °C for 15 min and treated with 0.5% Triton X-100 solution (Sangon Biotech, Shanghai, China) for 10 min at room temperature. Subsequently, 1 ml Phaloidin-TRITC (final concentration was 100 nM, Sigma-Aldrich, Saint Louis, MO, USA) was dropped in dishes for 30 min at room temperature. Then DAPI staining was performed for 10 min. The changes in cytoskeleton protein at different concentrations and time points were measured by Confocal Laser Scanning Microscopy (CLSM, Leica, Wetzlar, Germany). The fluorescence intensity was determined by Image J software. Five cells with membrane integrity and clear boundaries were randomly selected in each specimen to determine the mean intensity of fluorescence.
Detection of the proteins involved in osteoblastic and osteoclastic differentiation
The groups and treatment protocol was identical to that used for cytoskeleton morphology test. After treatment, cells from each group were resuspended in RIPA lysis buffer and placed on ice for 30 min. The supernatant was collected after centrifugation at 10,000 g for 15 min at 4 °C. Protein concentrations were determined using the BCA method (Pierce, Rockford, IL, USA). A total of 30–40 µg proteins were resolved using sodium dodecyl sulfate-polyacrylamide gel electrophoresis (SDS-PAGE) and transferred onto polyvinylidene difluoride (PVDF) membranes (Millipore, U.S.). Membranes were blocked in a dilute solution of 5% non-fat dry milk for 1 h, and then incubated overnight with Tris-buffered saline and Tween 20 (TBST) solution containing the desired primary antibodies [1:1000, antibodies targeting alkaline phosphatase (ALP), type 1 collagen (COL-I), osteocalcin (OCN), runt-related transcription factor 2 (Runx2), receptor activator of nuclear factor kappa-Β ligand (RANKL), osteoprotegerin (OPG), and β-actin] at 4 °C. After rinsing the membranes with TBST three times, the membranes were incubated with respective secondary antibodies under gentle agitation for 1 h. After three washes with TBST, an ECL chemiluminescence reagent (Millipore, USA) was applied to the membrane.
Statistical analysis
Data are expressed as mean and standard deviation (SD). Statistical analyses were performed using SPSS 16.0 software (SPSS, Chicago, Illinois) and between-group differences were assessed using the t-test and one way ANOVA followed by Tukey’s HSD post hoc test. Differences were considered statistically significant when the p values were less than .05.
Results
Characterization of AgNPs
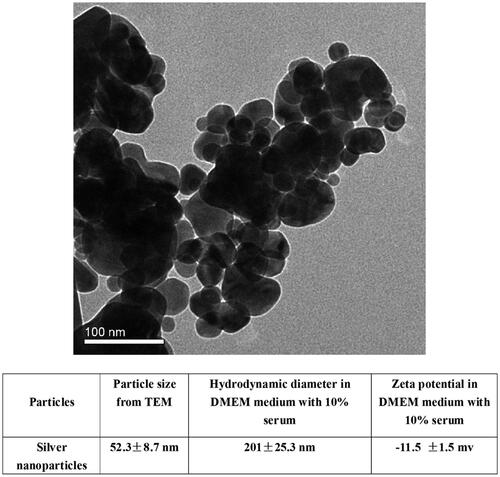
The primary size of the AgNPs was measured from TEM images () and the data is presented in . Since nanoparticles often form agglomerates in solution, the hydrodynamic diameter in DMEM with 10% FBS was measured using DLS. The size of the nanoparticle agglomerates in the cell medium was 201 nm, which was about four times larger than the primary size. The zeta potential was approximately −11.5 mV ().
Figure 1. Characterization of AgNPs: (A) TEM analysis of AgNPs; (B) AgNPs size, hydrodynamic diameter and zeta potential.
Uptake and retention of AgNPs in MG-63 cells
To determine the uptake and retention of AgNPs in MG-63 cells, the quantity of silver in cells was first measured using ICP-MS. A clear dose- and time-dependent increase in silver content in cells (p < .05) was observed after exposure to AgNPs for 24, 48 and 72 h (). Silver content was detectable in cells even 72 h after termination of treatment with AgNPs. The TEM images showed that nanoparticles were observed in the MG-63 cells exposed to AgNPs (5 μg/mL) for 72 h ( (B2,B5)) and at 72 h after termination of exposure ( (B3,B6)).
Figure 2. Uptake and retention of AgNPs in MG-63 cells. A: Results of ICP-MS showing a significant increase in silver content of MG-63 cells after exposure to AgNPs for 24, 48, and 72 h and after 24, 48, and 72 h of termination of exposure (N = 5). B: TEM images of MG63 cells without (B1, B4), with (B2, B5) exposure to AgNPs (5 μg/mL) for 72 h, and at 72 h after termination of exposure to AgNPs (B3, B6).
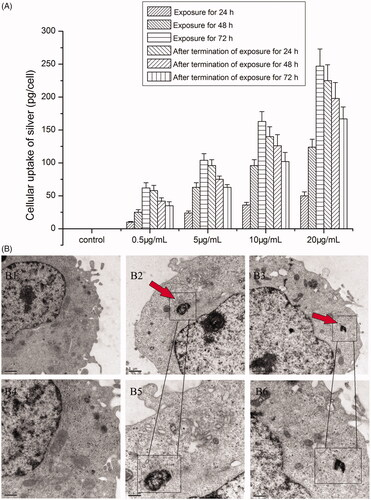
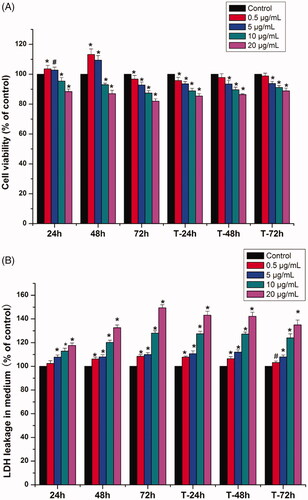
Figure 3. Effects of AgNPs on the viability and the LDH levels of MG-63 cells. (A) The viability of MG-63 cells treated with different concentrations of AgNPs for 24, 48, and 72 h and at 24, 48, and 72 h after termination of exposure was measured by MTS assay; (B) LDH level of MG-63 cells cultured in media containing varied concentrations of AgNPs for 24, 48, and 72 h and at 24, 48, and 72 h after termination of exposure. (n = 5, *p < .01 vs. control, # p < .05 vs. control; 24, 48, and 72 h: AgNPs treatment for 24, 48, and 72 h; T-24 h, T-48 h and T-72 h: termination of AgNPs exposure for 24, 48, and 72 h).
Cytotoxic effects of AgNPs on MG-63 cells
Cell viability data for MG-63 cells exposed to AgNPs were presented in . The results revealed significant decrease in cell viability after exposure to AgNPs at concentrations of 10 and 20 μg/mL, irrespective of the duration of exposure (24, 48 or 72 h) (p < .05). In contrast, exposure to low doses of AgNPs (0.5 and 5 μg/mL) for 24 h and 48 h, showed a stimulatory effect on cell growth (p < .05). However, after treatment with 0.5 and 5 μg/ml AgNPs for 72 h, the rate of cell proliferation showed a dramatic decrease (p < .05). After termination of AgNPs exposure for 24, 48, and 72 h, although the cell viability has risen in time-dependent manner, the growth rates of all exposed groups (with the exception of the 0.5 μg/mL group) were still obviously lower than that of the control group (p < .05). Based on these results, we considered 0.5 and 5 μg/mL as the low-dose and low-toxicity concentration and chose the following time-points for assessment in the subsequent experiments: exposure time of 72 h and 72 h after termination of exposure for 72 h.
The results of LDH leakage are shown in . After treatment with AgNPs for 24 h, except 0.5 μg/mL, other concentration groups showed increased release of LDH in cells (p < .05). When the exposure time extended to 48 h and 72 h, LDH release in the various concentration groups was significantly higher than that in the control group (p < .05). Even when AgNPs were no longer in contact with cells, LDH release in all the experimental groups was significantly higher than that in the control group, which implied that AgNP-induced damage to cell membrane was still continuing.
Osteoblast cytoskeleton morphology after treatment with AgNPs
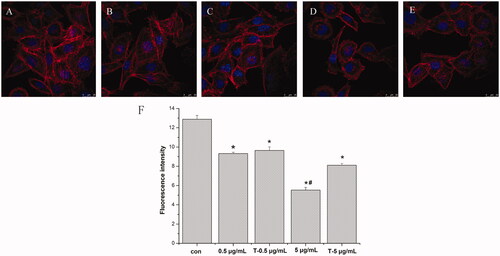
The CLSM results () showed that, in comparison with the control group, the cells exposed to 0.5 and 5 μg/mL AgNPs exhibited reduced fluorescence intensity of F-actin cytoskeleton and reduction in the number of cytoskeleton fibres; moreover, especially the group of 5 μg/mL, the fibre array was sparse, and signs of cell shrinkage were observed (reduction in cell size and acquisition of round shape) ().
Figure 4. Cytoskeleton morphology and fluorescence intensity of MG-63 cells treatment with AgNPs and after termination of AgNPs treatment. A-E: Observation of cytoskeleton morphology (CLSM ×20). A: control; B: 0.5 μg/mL AgNPs treatment for 72 h; C: Termination of 0.5 μg/mL AgNPs treatment for 72 h; D: 5 μg/mL AgNPs treatment for 72 h; E: Termination of 5 μg/mL AgNPs treatment for 72 h. F: Fluorescence intensity of MG-63 cells cytoskeleton (*p < .05 vs. control, # p < .05 vs. T-5 μg/mL). con: control group; 0.5 μg/mL: 0.5 μg/mL AgNPs exposure for 72 h; T-0.5 μg/mL: termination of 0.5 μg/mL AgNPs exposure for 72 h; 5 μg/mL: 5 μg/mL AgNPs exposure for 72 h; T-5 μg/mL: termination of 0.5 μg/mL AgNPs exposure for 72 h)
Expression of proteins involved in osteoblastic and osteoclastic differentiation after AgNPs exposure
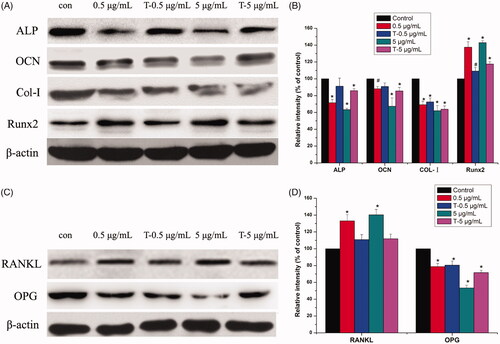
Western blot results () showed that after treatment with AgNPs, the expressions of ALP, OCN and Col-I were reduced while that of Runx2 was increased in a dose-dependent manner. Moreover, exposure to AgNPs enhanced the expression of osteoclast-associated cytokine RANKL and reduced the expression of OPG, thus increasing the RANKL/OPG ratio.
Figure 5. Western blot analysis of expressions of ALP, OCN, Col-I, Runx2, RANKL and OPG in MG-63 cells induced by AgNPs. A: Expression of osteogenic related proteins. B: Densitometry showing data from three experiments. C: Expression of osteoclast-related proteins. D: Densitometry showing data from three experiments. (n = 3, *p < .01 vs. control, # p < .05 vs. control; con: Control group; 0.5 μg/mL: 0.5 μg/mL AgNPs exposure for 72 h; T-0.5 μg/mL: termination of 0.5 μg/mL AgNPs exposure for 72 h; 5 μg/mL: 5 μg/mL AgNPs exposure for 72 h; T-5 μg/mL: termination of 0.5 μg/mL AgNPs exposure for 72 h).
Discussion
AgNPs are widely used in orthopaedic implants because of their excellent antimicrobial properties and it was found that AgNPs could enhance mineralization and alkaline phosphatase (ALP) expression in osteoblast or osteoblast-like cells [Citation12–14]. In addition, AgNPs are gradually used as surface modification coating to obtain antibacterial and potential bone formation ability. For example, AgNPs (4 to 19 nm) were immobilized on titanium used by a plasma immersion ion implantation process and have been found could activate integrin-α5-orchestrated MAPK/ERK signal cascade of osteoblast differentiation in BMSCs [Citation12]. However, recent studies have revealed potential health risks associated with the use of AgNPs for orthopaedic tissue repair. For example, AgNPs were shown to have cytotoxic effects (induction of cell death, cell-cycle arrest) on osteoblast or osteoblast-like cells [Citation12–14]. However, the potential toxic effects of AgNPs on osteoblasts, especially under low-dose exposure, remains unclear. Our ICP-MS results showed the cellular silver content increased in a dose-dependent manner and exhibited a notable retention effect after termination of treatment with AgNPs (). The uptake of AgNPs by MG-63 cells was also observed by TEM at a concentration of 5 μg/mL for 72 h (). The MTS results showed a significant decrease in viability of MG-63 cells after exposure to 10 and 20 μg/mL AgNPs for 24, 48, and 72 h (). Even 24 and 48 h after termination of AgNPs exposure, the cell proliferation rate was still lower than that of control group. Nevertheless, exposure of cells to 0.5 and 5 μg/mL AgNPs for 24 and 48 h could stimulate cell growth (). This phenomenon may be attributable to hormesis, which is considered as a compensatory behaviour or an adaptive response of organisms to stimulation, prior to eventual dyshomeostasis [Citation24,Citation25]. The cell viability declined after 72 h exposure to doses of 0.5 and 5 μg/mL AgNPs, which further illustrated the increase of cell viability after short exposure to low-dose was a compensatory response to AgNPs. Except for the 0.5 μg/mL dose, all the other doses caused increase in LDH release after AgNPs exposure to MG-63 cells (), which implied the damage of cell membrane [Citation26,Citation27]. The cell membrane damage was likely due to the adhesion of AgNPs on the surface of cell membrane, and their interaction with membrane proteins [Citation28]. This difference between MTS and LDH results mainly due to the different biological endpoint of MTS and LDH measurement. MTS assay is used to evaluate the mitochondrial enzyme activity and LDH measurement reflects the cell membrane permeability. In our study, low-dose AgNPs were uptaken by cells and induce hormesis in short-term which indicated the increase of cell viability. However, after exposure to cells, due to high surface activity, AgNPs could adhere to cell membrane easily and interact with membrane proteins which lead to the damage of cell membrane.
Cytoskeleton plays a crucial role in the maintenance of cell morphology, and the differentiation of osteoblasts [Citation29,Citation30]. Our CLSM results showed the fluorescence intensity of F-actin in MG-63 cells was weakened after exposure to AgNPs. Especially at the dose of 5 μg/mL, shrinkage of MG-63 cells was observed, and the F-actin structure was sparse and disorderly (), which would reduce cell adhesion and further affect osteogenesis [Citation31].
ALP, COL-I and OCN are important markers in the stage of osteoblasts differentiation and mineralization [Citation32,Citation33]. Here, AgNPs treatment reduced the expressions of ALP, OCN and COL-I in MG-63 cells in a dose-dependent manner (), which demonstrated AgNPs inhibited the differentiation and mineralization of osteoblasts. Particularly, the decrease of COL-I expression may be associated with the derangement of cytoskeleton, as shown in . Runx2 is a key transcription factor for osteoblast differentiation [Citation34]. Interestingly, we found the expression of Runx2 was increased after AgNPs exposure which was in contradiction to the results of ALP, Col-I and OCN. These discrepancies may be due to the ability of AgNPs to induce a switch in the Runx2 control of gene expression, from that of promoting matrix production to that of inducing the expression of pro-osteoclastogenic [Citation35]. RANKL and OPG are important factors in the regulation of osteoclast differentiation [Citation36,Citation37]. shows that AgNPs exposure enhanced the expression of RANKL and reduced the expression of OPG, thus increasing the RANKL/OPG ratio, which increased the risk of peri-implant osteolysis [Citation38].
In summary, our results demonstrated the cytotoxic effects of low-dose AgNPs on MG-63 cells persisted even after termination of exposure. Moreover, AgNPs exert a potential adverse effect on osteogenic activity. More attention should be paid to toxicity of AgNPs during designing of future orthopaedic implants.
Disclosure statement
No potential conflict of interest was reported by the authors.
Additional information
Funding
Related Research Data
References
- Derks J, Tomasi C. Peri-implant health and disease. A systematic review of current epidemiology. J Clin Periodontol. 2015;42:S158–S171.
- Chen X, Schluesener HJ. Nanosilver: a nanoproduct in medical application. Toxicol Lett. 2008;176:1–12.
- Qing Y, Cheng L, Li R, et al. Potential antibacterial mechanism of silver nanoparticles and the optimization of orthopedic implants by advanced modification technologies. Int J Nanomedicine. 2018;13:3311–3327.
- Jia Z, Xiu P, Li M, et al. Bioinspired anchoring AgNPs onto micro-nanoporous TiO 2 orthopedic coatings: Trap-killing of bacteria, surface-regulated osteoblast functions and host responses. Biomaterials. 2016;75:203–222.
- Noronha VT, Paula AJ, Durán G, et al. Silver nanoparticles in dentistry. Dent Mater. 2017;33:1110–1126.
- Zhao L, Wang H, Huo K, et al. Antibacterial nano-structured titania coating incorporated with silver nanoparticles. Biomaterials. 2011;32:5706–5716.
- Tao Q, Mahmood M, Zheng Y, et al. A genomic characterization of the influence of silver nanoparticles on bone differentiation in MC3T3‐E1 cells. J Appl Toxicol. 2017;38:172–179.
- Qin H, Zhu C, An Z, et al. Silver nanoparticles promote osteogenic differentiation of human urine-derived stem cells at noncytotoxic concentrations. Int J Nanomedicine. 2014;9:2469–2478.
- Mahmood M, Li Z, Casciano D, et al. Nanostructural materials increase mineralization in bone cells and affect gene expression through miRNA regulation. J Cell Mol Med. 2011;15:2297–2306.
- Pauksch L, Hartmann S, Rohnke M, et al. Biocompatibility of silver nanoparticles and silver ions in primary human mesenchymal stem cells and osteoblasts. Acta Biomater. 2014;10:439–449.
- Cao H, Zhang W, Meng F, et al. Osteogenesis catalyzed by titanium-supported silver nanoparticles. ACS Appl Mater Interfaces. 2017;9:5149–5157.
- Zielinska E, Tukaj C, Radomski MW, et al. Molecular mechanism of silver nanoparticles-induced human osteoblast cell death: protective effect of inducible nitric oxide synthase inhibitor. Plos One. 2016;11:e0164137.
- Rosário F, Hoet P, Santos C, et al. Death and cell cycle progression are differently conditioned by the AgNP size in osteoblast-like cells. Toxicology. 2016;368:103–115.
- Albers CE, Hofstetter W, Siebenrock KA, et al. In vitro cytotoxicity of silver nanoparticles on osteoblasts and osteoclasts at antibacterial concentrations. Nanotoxicology. 2013;7:30–36.
- Sthijns MM, Thongkam W, Albrecht C, et al. Silver nanoparticles induce hormesis in A549 human epithelial cells. Toxicol in Vitro. 2017;40:223–233.
- Brzóska K, Męczyńska-Wielgosz S, Stępkowski TM, et al. Adaptation of HepG2 cells to silver nanoparticles-induced stress is based on the pro-proliferative and anti-apoptotic changes in gene expression. Mutagenesis. 2015;30:431–439.
- Tyne W, Little S, Spurgeon DJ, et al. Hormesis depends upon the life-stage and duration of exposure: examples for a pesticide and a nanomaterial. Ecotoxicol Environ Saf. 2015;120:117–123.
- Vila L, Marcos R, Hernández A. Long-term effects of silver nanoparticles in caco-2 cells. Nanotoxicology. 2017;11:771–780.
- Choo WH, Park CH, Jung SE, et al. Long-term exposures to low doses of silver nanoparticles enhanced in vitro malignant cell transformation in non-tumorigenic BEAS-2B cells. Toxicol in Vitro. 2016;37:41–49.
- Herzog F, Clift MJ, Piccapietra F, et al. Exposure of silver-nanoparticles and silver-ions to lung cells in vitro at the air-liquid interface. Part Fibre Toxicol. 2013;10:11.
- Powers CM, Badireddy AR, Ryde IT, et al. Silver nanoparticles compromise neurodevelopment in PC12 cells: critical contributions of silver ion, particle size, coating, and composition. Environ Health Perspect. 2011;119:37–44.
- You F, Tang W, Yung LL. Real-time monitoring of the Trojan-horse effect of silver nanoparticles by using a genetically encoded fluorescent cell sensor. Nanoscale. 2018;10:7726–7735.
- Hsiao IL, Hsieh YK, Wang CF, et al. Trojan-horse mechanism in the cellular uptake of silver nanoparticles verified by direct intra- and extracellular silver speciation analysis. Environ Sci Technol. 2015;49:3813–3821.
- Calabrese EJ. Hormesis: why it is important to toxicology and toxicologists. Environ Toxicol Chem. 2008;27:1451–1474.
- Sthijns MM, Weseler AR, Bast A, et al. Time in Redox Adaptation Processes: From Evolution to Hormesis. Ijms. 2016;17:1649.
- Karlsson HL, Cronholm P, Hedberg Y, et al. Cell membrane damage and protein interaction induced by copper containing nanoparticles-importance of the metal release process. Toxicology. 2013;313:59–69.
- Fotakis G, Timbrell JA. Role of trace elements in cadmium chloride uptake in hepatoma cell lines. Toxicol Lett. 2006;164:97–103.
- Wei L, Tang J, Zhang Z, et al. Investigation of the cytotoxicity mechanism of silver nanoparticles in vitro. Biomed Mater. 2010;5:044103.
- McBeath R, Pirone DM, Nelson CM, et al. Cell shape, cytoskeletal tension, and RhoA regulate stem cell lineage commitment. Dev Cell. 2004;6:483–495.
- Louzao MC, Ares IR, Cagide E, et al. Palytoxins and cytoskeleton: an overview. Toxicon. 2011;57:460–469.
- Saldaña L, Vilaboa N. Effects of micrometric titanium particles on osteoblast attachment and cytoskeleton architecture. Acta Biomater. 2010;6:1649–1660.
- Beck GR, Sullivan EC, Moran E, et al. Relationship between alkaline phosphatase levels, osteopontin expression, and mineralization in differentiating MC3T3-E1 osteoblasts. J Cell Biochem. 1998;68:269–280.
- Sun J, Li J, Li C, et al. Role of bone morphogenetic protein-2 in osteogenic differentiation of mesenchymal stem cells. Mol Med Rep. 2015;12:4230–4237.
- Franceschi RT, Xiao G. Regulation of the osteoblast-specific transcription factor, Runx2: responsiveness to multiple signal transduction pathways. J Cell Biochem. 2003;88:446–454.
- Atkins GJ, Welldon KJ, Holding CA, et al. The induction of a catabolic phenotype in human primary osteoblasts and osteocytes by polyethylene particles. Biomaterials. 2009;30:3672–3681.
- Lee NK, Choi YG, Baik JY, et al. A crucial role for reactive oxygen species in RANKL-induced osteoclast differentiation. Blood. 2005;106:852–859.
- Boyce BF, Xing L. Functions of RANKL/RANK/OPG in bone modeling and remodeling. Arch Biochem Biophys. 2008;473:139–146.
- Crotti TN, Smith MD, Findlay DM, et al. Factors regulating osteoclast formation in human tissues adjacent to peri-implant bone loss: expression of receptor activator NFkappaB, RANK ligand and osteoprotegerin. Biomaterials. 2004;25:565–573.