
Abstract
MicroRNAs (miRNAs) have vastly expanded our view of RNA world in intracellular signal regulating networks. Here, we functionally characterized a normally highly expressed miRNA, miR-30a-5p (MIMAT0000087), which exhibits downregulated expression profiles in prostate cancer samples. MiR-30a-5p knockdown and overexpression in PC-3 cell line alters cell proliferation supporting a tumour suppressor role. We also discovered that PCLAF is the direct target of miR-30a-5p. Notably, PC-3 cell proliferation is inhibited by miR-30a-5p/PCLAF axis. miR-30a-5p represents a novel molecule of functionally important miRNAs which may shed light on the novel therapeutic targets for prostate cancer.
Introduction
Prostate cancer is one of the most common malignancies in the male reproductive system [Citation1]. There are significant geographic and racial differences in its incidence [Citation2]. For example, it ranks second in all types of human cancers in Europe [Citation3] and the United States [Citation4], while significantly lower in Asia than that in western countries. However, this incidence shows a rapid upward trend in recent years [Citation5]. Therefore, exploring the tumorigenesis and progression of prostate cancer in depth is critical and may identify novel diagnostic or treatment targets for improving the clinical outcome of prostate cancer patients.
MicroRNAs (miRNAs) are ubiquitously present non-coding small RNAs (19–25 nucleotides in length) in eukaryotic organisms [Citation6]. With incomplete complementation with 3′UTR region of target mRNA, they regulate gene expressions at the post-transcriptional level by degrading mRNAs or inhibiting mRNAs translations in eukaryotic organisms. In recent decades, with the help of next-generation sequencing technologies, a large number of miRNAs have been discovered [Citation7,Citation8] and further studies have proved that they play an important role in prostate cancer progressions.
The miR-30 family, which contains five members of distinct pre-mature miRNAs (miR-30a, -30 b, -30c, -30d, -30e), has been proved to play diverse roles in regulating essential aspects of tumorigenesis, metastasis, chemo-resistance and clinical prognosis in several types of human cancers [Citation9,Citation10]. Mounting evidence further suggests that certain members of miR-30 family are the key hubs in the prostate cancer progression by targeting critical signalling pathway molecules [Citation11,Citation12]. However, miR-30a-5p expression and role in prostate cancer remain unclear.
Here, we defined miR-30a-5p with downregulated expression patterns in prostate cancer samples and suppressed cell proliferation via targeting PCLAF, which shed light on molecular targeted therapy for prostate cancer patients.
Material and methods
Clinical prostate cancer samples collection
Human prostate cancer samples and adjacent benign glands (n = 20 pairs) were collected from prostate cancer patients who underwent tumour-resection surgery at our department and quickly cryopreserved in nitrogen canister for further experiments. The procedures of this study were approved by the Ethical Commission of Fuzhou General Hospital, Fuzhou, China.
Cell culture and transfection/infection
HEK293T and PC-3 cell line was purchased from cell bank of Shanghai Institutes for Biological Sciences, Chinese Academy of Sciences, and cultured in Ham’s F-12K medium (Gibco, USA) supplemented with 10% FBS (Gibco, USA). Cells were maintained at incubator with humidified atmosphere (37 °C, 5% CO2). The culture medium was changed every three days until confluent. As for transfection of miRNA mimics or inhibitor, cells were seeded in 6-well plates and transfected 24 h later with lipofectamine 2000 (Invitrogen, USA) according to the manufacturer’s protocols. The detailed sequences are as follows: mimics: 5′-UGUAAACAUCCUCGACUGGAAG-3′; inhibitor: 5′-CUUCCAGUCGAGGAUGUUUAC A-3′; NC: 5′-ACAUAGGGCCCAUGCUAAC UGC-3′. In infection cases, shPCLAF and shCtrl vectors were constructed and corresponding viruses were generated. Seventy-two hours after adding viruses into the culture medium, PC-3 cells were screened with puromycin (10 μg/ml) and observed under fluorescence microscope until 85% cells positive with GFP. Cells were then collected for further experiments.
RNA isolation and qRT-PCR
RNA originated from cryopreserved tissues or cultured cells were extracted by TRIZol agent (Thermo Fisher Scientific, Waltham, MA, USA) and was reverse transcribed by Transcriptor First Strand cDNA Synthesis Kit (Roche, Basel, Switzerland). The expressions of mRNA and miRNA were then detected by quantitative real-time PCR (qRT-PCR) by applying the SYBR Green PCR Master Mix (Thermo Fisher Scientific, Waltham, MA, USA) as described earlier [Citation13]. GAPDH and U6 were used as internal reference controls. The specific primer sequences for human miRNAs and mRNA are as follows. PCLAF: 5′-ATGGTGCGGACTAAAGCAGAC-3′ (forward); 5′-CCTCGATGAA ACTGATGTCGAAT-3′ (reverse); GAPDH: 5′-AGTAGAGGCAGGGATGATG-3′ (forward); 5′-TGGTATCGTGGAAGGACTC-3′ (reverse); miR-30a-5p: 5′-GGGCCTGTAAACATCCT CG-3’ (forward); 5′-GAATACCTCGGACCCTGC-3′ (reverse); U6: 5′-GGTCGGGCAGG AAAGAGGGC-3′ (forward); 5′-GCTAATCTTCTCTGTATCGTTCC-3′(reverse). All experiments were carried out according to the manufacturers’ instructions and data expressed as bar in the Mean ± SD in triplicate.
MTT proliferation assay
For cellular proliferation analysis, 3–(4,5-dimethylthiazol-2-yl)-2,5-diphenyltetrazol-ium bromide (MTT) was employed as described previously. In brief, the transfected or infected cells were plated in 96-well plates at 2 × 10³ per well. After culture for 24, 48, 72 h, MTT was added to each well and the data were recorded at the optical density (570 nm) on Microplate Spectrophotometer (BioTek, Winooski, VT, USA). At least three individual experiments were performed.
Colony formation assay
Five-hundred cells transfected with miR-30a-5p mimics, inhibitor or NC were seeded in 6-well plates per well, respectively. After 2 weeks long-term culturing, 4% paraformaldehyde and crystal violet were then applied step by step to immobilize and stain the cells. Finally, the colonies were formed and counted on light microscopy (Olympus, Tokyo, Japan). Bar graphs were represented at the mean ± SD of three separate experiments.
Luciferase reporter gene assay
To identify the probability of miR-30a-5p binding on PCLAF 3′UTR, psiCHECK luciferase reporter vectors inserted with full-length PCLAF WT and mutant 3′UTR were constructed. The assay was then performed according to the manufacturer’s protocols. In brief, HEK293T cells were seeded in 48-well plates and cultured for next 24 h. miR-30a-5p mimics/NC and psiCHECK-PCLAF WT/mutant plasmids were then co-transfected into the cells. Finally, luciferase activity was measured by luciferase assay reagents (Promega, Fitchburg, WI, USA). At least three individual experiments were performed.
Bioinformatics analysis
Putative miR:genes pairs regulatory network in TCGA-PRAD was analyzed and queried at Broad GDAC Firehose [Citation14] (\cenveospan{https://gdac.broadinstitute.org/}). Meta-profiling of miR-30 family expressions across human cancers was analyzed by dbDEMC 2.0 [Citation15] (\cenveospan{www.picb.ac.cn/dbDEMC/}). DIANA TOOLS mirPath v(0).3 was employed to carry out GO-term analysis of miRNA target genes [Citation16] (\cenveospan{http://snf-515788.vm.okeanos.grnet.gr/}). miRNA expressions of prostate normal tissues were queried at human miRNA tissue atlas [Citation17] (\cenveospan{https://ccb-web.cs.uni-saarland.de/tissueatlas}). Secondary structure of miRNA was predicted by miRNAMap 2.0 [Citation18] (\cenveospan{http://mirnamap.mbc.nctu.edu.tw/}). miRNA expression profiles and corresponding clinical significance in TCGA-PRAD were also analyzed by multi-omics tool LinkedOmics [Citation19] (\cenveospan{www.linkedomics.org/}). microRNA-target binding and their expression correlations were predicted by TargetScanHuman (\cenveospan{http://www.targetscan.org/vert_72/}), miRTarBase (\cenveospan{http://mirtarbase.mbc.nct u.edu.tw/}) and LinkedOmics [Citation20,Citation21]. UALCAN was also employed to analyze PCLAF mRNA expression from TCGA-PRAD transcriptome data [Citation22] (\cenveospan{http://ualcan.path.uab.edu/}). Its mRNA expression in prostate cancer cell lines was also queried at Cancer Cell Line Encyclopedia [Citation23] (\cenveospan{https://portals.broadinstitute.org/ccle}). Survival analysis of PCLAF with or without alteration in TCGA-PRAD was conducted at cBioPortal for Cancer Genomics (\cenveospan{http://www.cbioportal.org/}).
Statistical analysis
Statistical analyses were performed by using the GraphPad Prism 7.0 software. Student’s t-test was employed to compare the differences between two groups. Two-tailed p values <.05 was considered significant.
Results
miR-30 family exists in putative miR direct targets regulatory network of TCGA PRAD samples
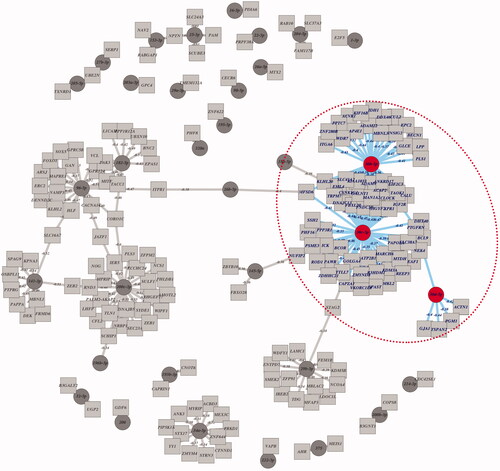
Recently, with the wide applications of small RNA next-generation sequencing (NGS) in biomedical industry, more and more miRNA data from a variety of tumour samples could be downloaded and analyzed by several algorithms or software. To obtain miR:genes pairs, 687 miRs and 18274 mRNAs across 493 prostate cancer samples from Broad GDAC Firehose were analyzed by two filtering steps, CLR algorithm (inferring putative miR:genes regulatory connections) and Pearson correlation (< =−0.3), in combination usage of three miRNA prediction databases (Miranda, Pictar, Targetscan). After filtering procedures mentioned above, 233 miR:genes pairs were detected (). Specific miR/Gene hubs with predicted interactions information were listed in \cenveospan{Table S1}. Among these pairs, miR-30 family hubs were in a fairly large proportion, suggesting miR-30 family:genes pairs may play an important role in prostate cancer progression.
Figure 1. Identification of putative miR direct targets networks from Broad GDAC Firehose by analyzing TCGA PRAD sequencing data.
Expression of miR-30 family across human cancers and its target genes GO-term analysis
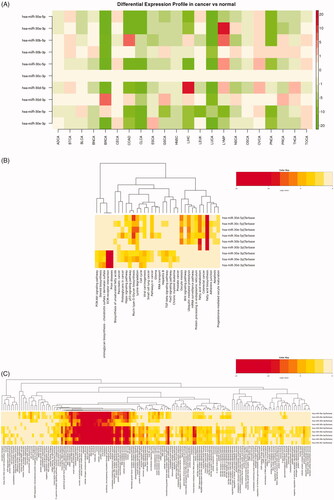
dbDEMC 2.0, which was developed by Dr. Zhen Yang (Computational Systems Genomics Lab, Chinese Academy of Sciences), covers differentially expressed miRNAs in most of the human cancers. After meta-profiling of miR-30 family expressions across different cancer types, we found miR-30 family members were downregulated in almost all tumours barring a few exceptions (). To further elucidate the roles of these low-expressed miR-30 family played in cancer progression, we carried out GO KEGG and Biological process (BP)/Cellular component (CC)/Molecular function (MF) enrichments of their target genes by mirPath v(0).3 (\cenveospan{Table S2}). Regarding KEGG pathway analysis, the option union of pathways and p values threshold (.05) were settled and the miR-30 family signature was predicted to be involved in multiple signalling pathways associated with process of different cancer types, including prostate cancer. The option of categories union and p values threshold (.05) was set for BP/CC/MF analysis. Multiple processes or functions, especially metabolic process and transcriptional regulations, got higher rankings, which therefore reminded us of the possible regulatory mechanism of miR-30 family in cancer progressions.
Figure 2. Expression profiles of miR-30 family in TCGA tumour samples and GO-term enrichment analysis of its target genes by mirPath3. (A) Heatmap results of differential expression patterns of miR-30 family in TCGA (tumour vs normal) samples. Green and red indicate downregulated and upregulated miRNA expression in the corresponding datasets, respectively. (B) Heatmap of KEGG pathways enriched in miR-30 family target genes. (C) Heatmap of GO BP/CC/MF analysis of miR-30 family target genes.
Expression and clinical significance of miR-30a-5p in prostate cancer
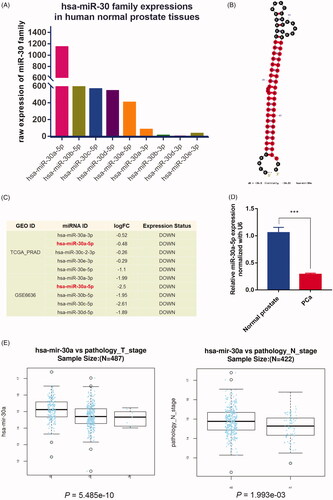
Expression abundances of miRNA family are closely related with their physiological and pathological functions. We identified the expressions of all miR-30 family members in human normal prostate tissues with the help of Human miRNA tissue atlas database. Interestingly, these miRNAs displayed varying degrees of expressions in the prostate, with miR-30a-5p exhibiting the highest degree of expressions (). We focused further analysis on miR-30a-5p due to its highest expression pattern in prostate compared to the relatively lower expression of other miR-30 family members. It was derived from 5′ arm of precursor miR-30a stem-loop structure (). Similar results were obtained from miRCarta 1.0 [Citation24] (\cenveospan{Figure S1}). Using dbDMEC database, we also identified that expression of miR-30 family, especially miR-30a-5p, was downregulated in TCGA-PRAD and GSE6636 samples (, \cenveospan{Table S3}). This expression tendency of miR-30a-5p was also independently confirmed via qRT-PCR in human prostate cancer samples compared with normal prostate samples (). Additionally, by utilizing LinkedOmics tool, we also observed significantly negative correlations between the expression of miR-30a-5p and the T- and N-stage, while had no significant association with survival in TCGA-PRAD samples patients (F), \cenveospan{Figure S2}), suggesting a potential role for miR-30a-5p in prostate cancer progression.
Figure 3. Expression pattern and clinical significance of miR-30a-5p in prostate cancer tissues. (A) The comparison of miR-30 family expression abundance in human normal prostate tissues. (B) Secondary structure of miR-30a predicted by miRNAMap. (C) miR-30a-5p was downregulated in both TCGA-PRAD and GSE6636 prostate cancer datasets. (D) Comparison of miR-30a-5p expression in prostate cancer patients (n = 20) and normal controls (n = 20) were analyzed by qRT-PCR. Data were presented as mean ± SEM, ***p < .001 compared with normal controls. (E) Negative correlation between the expression of miR-30a-5p and the T- or N-stage in TCGA-PRAD revealed by LinkedOmics, p = 5.49e-10, 1.99e-03.
Proliferation functional implication of mR-30a-5p in PC-3 prostate cancer cells
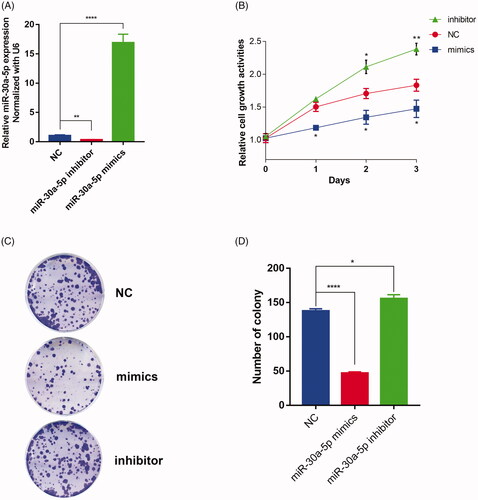
To implicate the function relationship between miR-30a-5p and prostate cancer progression, we performed miR-30a-5p mimics or inhibitors transfections to up- or down- regulate its expression in PC-3 cells () and observed a dramatic change in the proliferative capacity of these cells (). Inhibitor knockdown of miR-30a-5p in PC-3 cells resulted in remarkably enhanced cell growth rates and colony formation capability, while mimics overexpression of miR-30a-5p obtained contradictory results, as compared with NC group. All results above confirm that miR-30a-5p regulates prostate cancer cells functions through its proliferation regulatory characteristic.
Figure 4. miR-30a-5p inhibits cellular proliferation in PC-3 cells. (A) PC-3 cells are transfected with a miR-30a-5p mimics/inhibitor or NC, and the expression of miR-30a-5p is quantified by real-time PCR. Data were presented as mean ± SEM, **p < .01, ****p < .0001 compared with NC. (B) MTT assay reveals that miR-30a-5p mimics inhibited cell growth significantly while miR-30a-5p inhibitors stimulated cell growth compared to NC. Each bar represents the mean of three independent experiments (*p < .05, **p < .01 compared with NC, one-way ANOVA). (C) Representative graphs of miR-30a-5p mimics or inhibitors regulating cell proliferation as indicated by colony-formation assay. (D) Quantification of colonies that are larger than 0.1 mm was scored. Each bar represents the mean of three independent experiments (*p < .05, ****p < .0001 compared with NC, one-way ANOVA).
Characterization of miR-30a-5p/PCLAF targeting axis
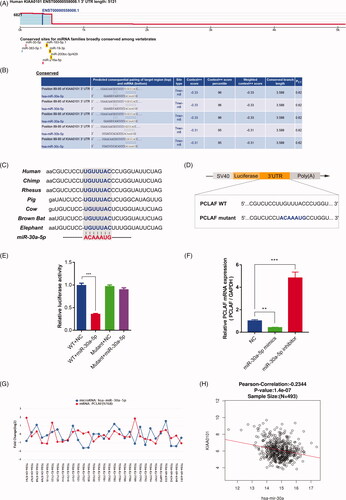
Given that we observed the highest expression of miR-30a-5p in prostate tissues (), and proliferation regulatory properties in prostate cancer cells (), we set out to interrogate its potential target genes, extending the implications of miR-30a-5p downstream signalling pathways in prostate cancer. Several conserved sites for miRNA family binding were predicted to be in PCLAF 3′UTR region (). Specific information for miR-30 family predicted interaction sites in PCLAF 3′UTR was listed in , and these binding sites for miR-30a-5p were highly conserved among seven different species (). These evolutionary conservation trends indicate most probable negative regulation of miR-30a-5p on expression of PCLAF. To further characterize the relationship between miR-30a-5p and PCLAF, we constructed pGL3 luciferase reporter vectors containing full length of PCLAF WT and mutant 3′UTR (). A significant decrease in luciferase activity was detected when the PCLAF 3′UTR vector was co-transfected with miR-30a-5p mimics, compared to the NC, while the miR-30a-5p-mediated suppression of luciferase activity was abolished in the mutant PCLAF 3′UTR vector (). PC-3 cells were also transfected with miR-30a-5p mimics and inhibitor to restore or downregulate its expression. Restoration of miR-30a-5p in PC-3 cells significantly suppressed PCLAF mRNA expression, whereas inhibition of miR-30a-5p in PC-3 cells dramatically enhanced PCLAF expression (). These negative expression correlations between miR-30a-5p and PCLAF were also present in TCGA-PRAD samples revealed by miRTarBase and LinkOmics (). These results confirmed that PCLAF is a direct target for miR-30a-5p in prostate cancer.
Figure 5. PCLAF is a miR-30a-5p target. (A) Full length of PCLAF 3’UTR region and its conserved sites for miRNA families predicted by TargetScanHuman 7.2. (B) Position 89–95 of PCLAF 3’UTR is predicted to be targeted by all miR-30-5p isoforms. (C) Position 89–95 of PCLAF 3′UTR targeted by miR-30a-5p is highly conserved among vertebrates. (D) Schematic illustrating the construction of luciferase reporter plasmids PCLAF WT UTR and PCLAF mutant UTR. (E) Luciferase assay is conducted and all data were reported as mean ± s.e.m. p values are calculated based on at least three independent experiments. ***p < .001. (F) qRT-PCR analysis of endogenous PCLAF mRNA expressions in PC-3 cells transfected with miR-30a-5p mimics or miR-30a-5p inhibitor; data are expressed relative to the corresponding NC cells, **p < .01, ***p < .001. (G) miR-30a-5p and PCLAF expressions show negative correlation in TCGA-PRAD data analyzed by miRTarBase. (H) LinkedOmics also revealed significant negative correlation between miR-30a-5p and PCLAF in TCGA-PRAD samples. R= −0.2344, p = 1.4e-07.
Expression and clinical significance of PCLAF in prostate cancer
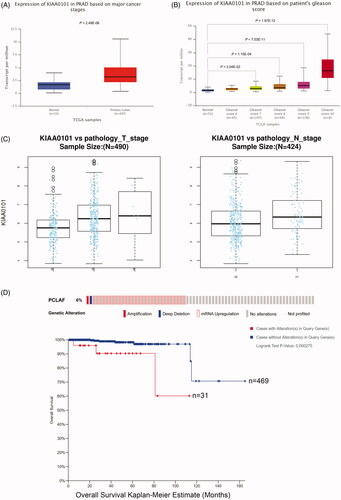
Given that we observed PCLAF was a direct target of miR-30a-5p via various methods, we intended to further explore the functional relationship between this target gene PCLAF and prostate cancer. In TCGA-PRAD samples, PCLAF was upregulated significantly in primary tumours (n = 497) compared with normal prostate tissues (n = 52), and this expression was positively correlated with patient’s Gleason scores, T stage and N stage revealed by UALCAN and LinkedOmics (). Meanwhile, PCALF alterations also decreased the overall survival Kaplan–Meier estimate in prostate cancer patients (). All data above indicates that PCLAF may be involved in driving the progression of prostate cancer.
Figure 6. Expression profiles and clinical significance of PCLAF in prostate cancer samples. (A) Up-regulated PCLAF mRNA expressions in TCGA primary prostate cancer samples uncovered by UALCAN, p = 2.49e-06. (B) PCLAF expressions correlated with clinical characteristics of Gleason score 7, 8, 9, 10, p = 2.04e-02, 1.15e-04, 7.03e-11, 1.97e-12. (C) Positive correlation between the expression of PCLAF and the T-stage (left) or N-stage (right) in TCGA-PRAD revealed by LinkedOmics, p = 5.51e-08, 2.66e-03. (D) cBioPortal Kaplan-Meier survival analysis for PCLAF with or without alterations on 500 prostate cancer patients with death outcome, p = 2.75e-04.
Downregulation of PCLAF inhibits the proliferation of PC-3 prostate cancer cells
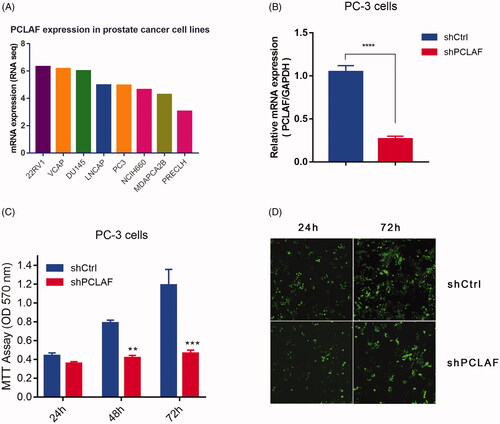
To more broadly assess the function of PCLAF in prostate cancer, we constructed shPCLAF lenti-virus vector and its NC vector and further evaluated the proliferation rate of shPCLAF prostate cancer cells. PCLAF mRNA expressions in eight prostate cancer cell lines were firstly analyzed at CCLE, and PC-3 cells, in which PCLAF was moderately expressed, were chosen for ulterior cellular experiments (). shPCLAF lentivirus infections produced downregulation of PCLAF expression in PC-3 cells (). Moreover, by utilizing MTT assay, significant decreases in proliferation rates were detected after shPCLAF lenti-virus infection at different time points (24 h, 48 h, 72 h), compared to the NC. As expected, knockdown of PCLAF also led to a similar proliferation reduction by immunofluorescence staining () suggesting an essential role for PCLAF in mediating the proliferation of PC-3 cells.
Figure 7. Downregulation of PCLAF inhibits the proliferation of PC-3 cells. (A) PCLAF mRNA expressions in all CCLE prostate cancer cell lines. (B) Construction of stably shPCLAF cell lines is determined by qRT-PCR. (C) Cell proliferations measured by MTT assay (24, 48, 72 h time points) of shCtrl and shPCLAF PC-3 cells. (D) Cell proliferation rates could be also reflected by GFP immunofluorescence staining (24, 72 h time points) in shCtrl and shPCLAF PC-3 cells. All the experiments were performed at least three times and representative results are displayed as mean ± SD. *p < .05, **p < .01, ***p < .001.
Proliferation characteristics of PC-3 cells regulated by miR-30a-5p/PCLAF axis
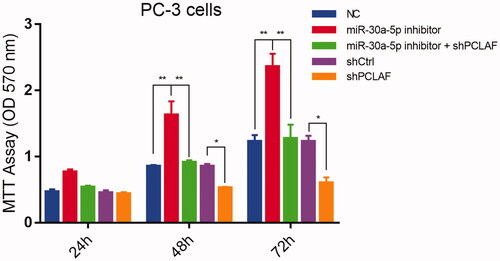
In order to further investigate the role of miR-30a-5p/PCLAF, we assessed the function of the manipulation of miR-30a-5p inhibitor and shPCLAF in PC-3 cells by utilizing the lipofectamine 2000 transfection or lenti-virus infection methods with NC and shCtrl used as a negative control. In this cell model, inhibition of miR-30a-5p was sufficient for a significant increase of proliferation rate in PC-3 cells at time points (48 h, 72 h), while this trend was abolished by shPCLAF infection (). Thus the striking proliferation regulation ability of miR-30a-5p/PCLAF axis in PC-3 cells present compelling evidence for an important role of miR-30a-5p/PCLAF in prostate cancer development.
Figure 8. miR-30a-5p regulates prostate proliferation by targeting PCLAF. MiR-30a-5p inhibitor promoted PC-3 cell proliferation. The cells transfected with the indicated NC or inhibitor were subjected with MTT assays. The rescue experiments for miR-30a-5p inhibitions were performed by transfection of shPCLAF in miR-30a-5p inhibitor-treated cells. All the experiments were performed at least four times and representative results are displayed as mean ± SD. *p < .05, **p < .01.
Discussion
Prostate cancer is a common malignant tumour among men in Europe and the United States. The incidence rate ranks second in all malignancies. American Cancer Society estimates about 164,690 new cases of prostate cancer and about 29,430 deaths from prostate cancer in the United States for 2018. The incidence of prostate cancer in China is much lower than in Western countries. However, due to improvement of living standard, ageing, and the popularity of prostate-specific antigen (PSA) screening, the incidence and mortality of prostate cancer have risen linearly over the past 10 years and it has become one of the national health issues affecting the life index of Chinese men.
miR-30 family was commonly downregulated and regulated biological behaviours of tumour growth, invasion, epithelial-mesenchymal transition (EMT), chemo-resistance by targeting different downstream genes in various types of cancers [Citation25–28]. Previous studies have proved that miR-30a, one member of miR-30 family, regulated radio sensitivity of DU145 and LNCaP cells by inhibiting autophagy via TP53INP1 [Citation29]. Naohito Kobayashi et al. also identified miR-30d as a novel prognostic marker of prostate cancer by using miRNA microarrays [Citation30]. MiR-30b-3p and miR-30d-5p were also identified as direct regulators of androgen receptor signalling in prostate cancer by using same method [Citation31]. However, the expression and role of miR-30a-5p in prostate cancer progression remain unclear. Here, we identified downregulated miR-30a-5p involved cell proliferation in prostate cancer, suggesting that miR-30a-5p may be a novel therapeutic strategy for prostate cancer treatment.
Here we reported that miR-30 family locate at the focal point of putative miR direct targets networks () and were low-expressed across a variety of tumour types. GO analysis of their target genes also elucidated that they participated in the process or signalling pathways of different cancer types (). Further investigations showed that miR-30a-5p expressed the highest abundance among all other miR-30 family members (, \cenveospan{Figure S1}). However, until now, little is known on the ways in which miR-30a-5p is functioning in prostate cancer progression. Therefore, we aimed to reveal the expression and potential mechanism of miR-30a-5p in prostate cancer progression in this study.
The combination of bioinformatics and experimental methods were widely employed to study the function of genes or miRNAs in specified tumours [Citation32,Citation33]. Thus, we explored the expressions and clinical features of miR-30a-5p in prostate cancer samples through multiple ways. Results showed that miR-30a-5p was downregulated significantly and showed negative correlations with the T- and N-stage (). miRNA mimics and inhibitor allow us to manipulate the expression of miR-30a-5p and further analyze its proliferation functions in PC-3 cells. MTT results, largely concordant with the colony formation findings, suggested that miR-30a-5p functions as tumour suppressor role in prostate cancer progression by inhibiting cell proliferation ().
We subsequently implicated PCLAF as the direct target of miR-30a-5p through bioinformatics analysis (). And this scientific supposition was confirmed by luciferase assay, qRT-PCR (). Positive expression correlations between miR-30a-5p and PCLAF in prostate cancer samples were also determined by miRTarbase and LinkedOmics analysis (), suggesting that miR-30a-5p/PCLAF axis may play an important role in prostate cancer progression.
PCLAF, also named as KIAA0101, has been reported to be overexpressed and involved in various cancers [Citation34–37]. It acted as an oncogenic role by promoting tumour proliferation and invasions [Citation37–39]. Greg L. Shaw et al found that PCLAF was highly expressed in prostate cancer samples through immunohistochemistry staining [Citation40], but the exact function of PCLAF in prostate cancer is still unknown. Consistent with published data in other tumours, the expression of PCLAF in prostate cancer samples was also extremely higher than that in normal tissues and had a strong clinical relevance (). MTT assay and immunofluorescence staining assay further confirmed that PCLAF knockdown reduced the proliferation rate of PC-3 cells (). Additionally, the proliferative advantage conferred by miR-30a-5p inhibitor was abrogated by reduction of PCLAF levels in PC-3 cell line (). All together, we speculated that PCLAF is a target gene of miR-30a-5p and plays important roles in tumorigenesis of prostate cancer.
In conclusion, the present study provides new visions on the role of miR-30a-5p in prostate cancer proliferation and suggests that miR-30a-5p/PCLAG axis may provide a potential therapeutic target for prostate cancer.
Supplentary_files.rar
Download ()Disclosure statement
No potential conflict of interest was reported by the authors.
Additional information
Funding
Related Research Data
Reference
- Siegel RL, Miller KD, Jemal A. Cancer statistics 2016. CA: a Cancer Journal for Clinicians. 2016;66:7–30.
- Rebbeck TR. Prostate cancer genetics: variation by race, ethnicity, and geography. Semin Radiat Oncol. 2017;27:3–10.
- Schroder FH, Hugosson J, Roobol MJ, et al. Screening and prostate cancer mortality: results of the European Randomised Study of Screening for Prostate Cancer (ERSPC) at 13 years of follow-up. Lancet. 2014;384:2027–2035.
- Parekh DJ, Punnen S, Sjoberg DD, et al. A multi-institutional prospective trial in the USA confirms that the 4Kscore accurately identifies men with high-grade prostate cancer. Eur Urol. 2015;68:464–470.
- Zhu Y, Wang HK, Qu YY, et al. Prostate cancer in East Asia: evolving trend over the last decade. Asian J Androl. 2015;17:48–57.
- Vidigal JA, Ventura A. The biological functions of miRNAs: lessons from in vivo studies. Trends Cell Biol. 2015;25:137–147.
- Hu Y, Lan W, Miller D. Next-generation sequencing for MicroRNA expression profile. Methods Mol Biol. 2017;1617:169–177.
- Song C, Chen H, Wang T, et al. Expression profile analysis of microRNAs in prostate cancer by next-generation sequencing. Prostate. 2015;75:500.
- Yang SJ, Yang SY, Wang DD, et al. The miR-30 family: versatile players in breast cancer. Tumour Biol. 2017;39:1010428317692204.
- Liu MM, Li Z, Han XD, et al. MiR-30e inhibits tumor growth and chemoresistance via targeting IRS1 in Breast Cancer. Sci Rep. 2017;7:15929.
- Kao CJ, Martiniez A, Shi XB, et al. miR-30 as a tumor suppressor connects EGF/Src signal to ERG and EMT. Oncogene. 2014;33:2495–2503.
- Egan SM, Karasik E, Ellis L, et al. miR-30e* is overexpressed in prostate cancer and promotes NF-κB-mediated proliferation and tumor growth. Oncotarget. 2017;8:67626–67638.
- Zhao H, Bian H, Bu X, et al. Targeting of Discoidin Domain Receptor 2 (DDR2) prevents myofibroblast activation and neovessel formation during pulmonary fibrosis. Mol Ther. 2016;24:1734–1744.
- Broad Institute TCGA Genome Data Analysis Center. Identification of Putative miR Direct Targets by Sequencing Data. Broad Institute of MIT and Harvard; 2016. doi:10.7908/C10R9NV4.
- Yang Z, Wu L, Wang A, et al. dbDEMC 2.0: updated database of differentially expressed miRNAs in human cancers. Nucleic Acids Res. 2017;45:D812–D818.
- Vlachos IS, Zagganas K, Paraskevopoulou MD, et al. DIANA-miRPath v3.0: deciphering microRNA function with experimental support. Nucleic Acids Res. 2015;43:W460–W466.
- Ludwig N, Leidinger P, Becker K, et al. Distribution of miRNA expression across human tissues. Nucleic Acids Res. 2016;44:3865–3877.
- Hsu SD, Chu CH, Tsou AP, et al. miRNAMap 2.0: genomic maps of microRNAs in metazoan genomes. Nucleic Acids Res. 2008;36:D165–D169.
- Vasaikar SV, Straub P, Wang J, et al. LinkedOmics: analyzing multi-omics data within and across 32 cancer types. Nucleic Acids Res. 2018;46:D956–D963.
- Chou CH, Shrestha S, Yang CD, et al. miRTarBase update 2018: a resource for experimentally validated microRNA-target interactions. Nucleic Acids Res. 2018;46:D296–D302.
- Agarwal V, Bell GW, Nam JW , et al. Predicting effective microRNA target sites in mammalian mRNAs. eLife. 2015;4:e05005.
- Chandrashekar DS, Bashel B, Balasubramanya SAH, et al. UALCAN: a portal for facilitating tumor subgroup gene expression and survival analyses. Neoplasia. 2017;19:649–658.
- Barretina J, Caponigro G, Stransky N, et al. The cancer cell line encyclopedia enables predictive modelling of anticancer drug sensitivity. Nature. 2012;483:603–607.
- Backes C, Fehlmann T, Kern F, et al. miRCarta: a central repository for collecting miRNA candidates. Nucleic Acids Res. 2018;46:D160–D167.
- Ouzounova M, Vuong T, Ancey PB, et al. MicroRNA miR-30 family regulates non-attachment growth of breast cancer cells. BMC Genomics. 2013;14:139.
- Zhao JJ, Lin J, Zhu D, et al. miR-30-5p functions as a tumor suppressor and novel therapeutic tool by targeting the oncogenic Wnt/β-catenin/BCL9 pathway. Cancer Res. 2014;74:1801–1813.
- Fan MJ, Zhong YH, Shen W, et al. MiR-30 suppresses lung cancer cell 95D epithelial mesenchymal transition and invasion through targeted regulating Snail. Eur Rev Med Pharma Sci. 2017;21:2642–2649.
- Zhong Z, Xia Y, Wang P, et al. Low expression of microRNA-30c promotes invasion by inducing epithelial mesenchymal transition in non-small cell lung cancer. Mol Med Rep. 2014;10:2575–2579.
- Xu CG, Yang MF, Fan JX, et al. MiR-30a and miR-205 are downregulated in hypoxia and modulate radiosensitivity of prostate cancer cells by inhibiting autophagy via TP53INP1. Eur Rev Med Pharma Sci. 2016;20:1501–1508.
- Kobayashi N, Uemura H, Nagahama K, et al. Identification of miR-30d as a novel prognostic maker of prostate cancer. Oncotarget. 2012;3:1455–1471.
- Kumar B, Khaleghzadegan S, Mears B, et al. Identification of miR-30b-3p and miR-30d-5p as direct regulators of androgen receptor signaling in prostate cancer by complementary functional microRNA library screening. Oncotarget. 2016;7:72593–72607.
- Zhong B, Guo S, Zhang W, et al. Bioinformatics prediction of miR-30a targets and its inhibition of cell proliferation of osteosarcoma by up-regulating the expression of PTEN. BMC Med Genomics. 2017;10:64.
- Wang M, Xie R, Si H, et al. Integrated bioinformatics analysis of miRNA expression in osteosarcoma. Artif Cells Nanomed Biotechnol. 2017;45:936–943.
- Zhu K, Diao D, Dang C, et al. Elevated KIAA0101 expression is a marker of recurrence in human gastric cancer. Cancer Sci. 2013;104:353–359.
- Cheng Y, Li K, Diao D, et al. Expression of KIAA0101 protein is associated with poor survival of esophageal cancer patients and resistance to cisplatin treatment in vitro. Lab Invest. 2013;93:1276–1287.
- Jain M, Zhang L, Patterson EE, et al. KIAA0101 is overexpressed, and promotes growth and invasion in adrenal cancer. PloS One. 2011;6:e26866.
- Su X, Zhang T, Cheng P, et al. KIAA0101 mRNA overexpression in peripheral blood mononuclear cells acts as predictive marker for hepatic cancer. Tumor Biol. 2014;35:2681–2686.
- Hosokawa M, Takehara A, Matsuda K, et al. Oncogenic role of KIAA0101 interacting with proliferating cell nuclear antigen in pancreatic cancer. Cancer Res. 2007;67:2568–2576.
- Kato T, Daigo Y, Aragaki M, et al. Overexpression of KIAA0101 predicts poor prognosis in primary lung cancer patients. Lung Cancer. 2012;75:110–118.
- Shaw GL, Whitaker H, Corcoran M, et al. The early effects of rapid androgen deprivation on human prostate cancer. Eur Urol. 2016;70:214–218.