
 ?Mathematical formulae have been encoded as MathML and are displayed in this HTML version using MathJax in order to improve their display. Uncheck the box to turn MathJax off. This feature requires Javascript. Click on a formula to zoom.
Abstract
The application of layer-by-layer (LbL) approach on nanoparticle surface coating improves the colon-specific drug delivery of insoluble drugs. Here, we aimed to formulate a self-assembled cysteamine-based disulphide cross-linked sodium alginate with LbL self-assembly to improve the delivery of paclitaxel (PCX) to colonic cancer cells. Cysteamine was conjugated to the backbone of oxidized SA to form a core of self-assembled disulphide cross-linked nanospheres. P3DL was selected for PCX loading and fabricated LbL with poly(allylamine hydrochloride) (PAH) and poly(4-styrenesulfonic acid-co-maleic acid) sodium salt (PSSCMA) resulting from characterization and drug release studies. P3DL-fabricated PCX-loaded nanospheres (P3DL/PAH/PSSCMA) exhibited an encapsulation efficiency of 77.1% with cumulative drug release of 45.1%. Dynamic light scattering analysis was reported at 173.6 ± 2.5 nm with polydispersity index of 0.394 ± 0.105 (zeta potential= −58.5 mV). P3DL/PAH/PSSCMA demonstrated a pH-dependent swelling transition; from pH 1 to 7 (102.2% increase). The size increased by 33.0% in reduction response study after incubating with 10 mM glutathione (day 7). HT-29 cells showed high viabilities (86.7%) after treatment with the fabricated nanospheres at 0.8 µg/mL. Cellular internalization was successful with more than 70.0% nanospheres detected in HT-29 cells. Therefore, this fabricated nanospheres may be considered as potential nanocarriers for colon cancer-targeted chemotherapeutic drug delivery.
Introduction
In recent years, many researchers have shown interest in the development and innovation of colon-targeted drug delivery system, which provides potential solutions for many diseases, such as inflammatory bowel diseases, specifically Crohn’s disease, ulcerative colitis and colorectal cancer [Citation1]. This system also provides a wide range of potential treatment for systemic diseases and applications in the delivery of peptides and vaccines into the human body [Citation2,Citation3]. Colon drug delivery system facilitates the amount of drugs that can be delivered to the colon disease region successfully by minimizing any adverse effect. This system also delivers high retention time for drugs to localize in the colon, which will improve the absorption of drugs into the human body [Citation1]. In colon drug delivery, the oral route is preferable, and it is the most convenient administration route due to its flexibility [Citation4] and improvement on patient’s compliance [Citation5].
The presence of different pH values along the gastrointestinal tract (GI tract) is a considerable challenge for drugs to reach the target sites accurately [Citation5,Citation6]. Many strategies related to colon-specific drug delivery were introduced; these strategies include the covalent linkage between drugs and polymers (prodrug), pH, time and microbial responsive strategies osmotic pressure-controlled drug delivery system [Citation7–9] and the use of multiparticulate systems, such as microspheres and nanospheres [Citation10].
The human colon contains abundant of bacterial populations that can produce reducing environment for many chemical bonds, such as azo, nitro and disulphide bonds [Citation2]. The polymers with disulphide bonds are widely investigated due to their stability in extracellular fluids compared with those of intracellular fluids with glutathione (GSH), which reduces the atmosphere for disulphide linkages [Citation6]. In cancer cells, the GSH concentration is four times higher than that in normal cells. Hence, the introduction of disulphide cross-link in polymers can be a viable alternative strategy in colon cancer drug delivery studies [Citation11]. However, the low reduction reactions of disulphide bonds can still occur in normal cells due to the relatively low-reductive environment. To overcome this challenge, the use of cross-linked nanoparticles containing disulphide bonds as the core will be the most ideal solution to avoid premature drug leakage and toxicity in normal cells [Citation12].
To date, various nanocarriers are used in drug delivery system. Polysaccharide-based nanoparticles, such as alginate, play a vital role due to their qualities and favourable results for several anticancer drugs [Citation13]. The first alginate particles were developed in 1980 for drug encapsulation, and many studies have been conducted on drug delivery since then [Citation14]. Alginate, which originated from brown algae, consists of d-mannuronic acid (M) and l-guluronic acid (G) residues and bonds linearly by 1,4-glycosidic linkages [Citation5,Citation15,Citation16]. It is also biodegradable, biocompatible, non-toxic and possesses mucoadhesive property [Citation16].
Nanotechnology has also become a promising tool in improving therapeutic outcomes by focussing drug delivery to the target sites to minimize drug accumulation at nonspecific sites [Citation17]. New system and technologies should be developed and explored to overcome current limitations in colon-targeted drug delivery system. The therapeutic efficacy of drug carriers can be improved, and adverse effects can be minimized via modification of the nanoparticles’ features [Citation18]. Therefore, the present research aims to develop a novel biodegradable thiolated sodium alginate (TSA) derived nanospheres with modified surface to improve the delivery and release of paclitaxel (PCX) to the targeted site of colonic cancer cells. PCX was selected as an anticancer drug model because it can treat various types of cancers, including colon cancer [Citation17,Citation19].
Materials and methods
Materials
Sodium alginate (SA), sodium borohydride, methyl orange, sodium periodate, hydroxylamine hydrochloride, poly(allylamine hydrochloride) (PAH), poly(4-styrenesulfonic acid-co-maleic acid) sodium salt (PSSCMA) and cysteamine hydrochloride were purchased from Sigma Aldrich (Saint Louis, MO). Sodium chloride and L-cysteine were obtained from R&M Chemicals (Essex, UK), and ethylene glycol was acquired from Bio Basic Inc. (Markham, Canada). PCX was purchased from TCI (Tokyo, Japan). Glutathione, reduced, free acid was obtained from Calbiochem (Tokyo, Japan), and potassium chloride was acquired from Merck (Selangor, Malaysia). Roswell Park Memorial Institute 1640 (RPMI) media, Dulbecco’s modified eagle medium (DMEM) media, foetal bovine serum (FBS) and penicillin-streptomycin were purchased from Gibco® (New York, NY). 3-(4,5-Dimethylthiaol-2-yl)-2,5-diphenyltetrazolium bromide (MTT reagent) was obtained from Promega (Madison, WI). Phosphate buffer saline (PBS) and Triton X-100 were acquired from Invitrogen (New York, NY). All other chemicals were of analytical grade.
Synthesis of partially oxidized SA
Sodium alginate oxidation (OSA) was carried out at room temperature for 24 h in a dark bottle. First, SA was diluted in 1% of deionized water. Afterwards, aqueous sodium periodate solution was added under stirring condition, followed by the addition of 5 mL of ethylene glycol after 24 h to stop the reaction. The resultant solution with precipitate was filtered and washed with sodium chloride and ethanol before drying it in vacuum condition at room temperature [Citation20]. This experiment was repeated in three different feed molar ratios between the repetitive unit of SA and sodium periodate (10:1, 10:2 and 10:3). The degree of oxidation was determined by using hydroxylamine hydrochloride method [Citation21].
Synthesis and characterization of TSA
OSA (0.05 g) was dissolved in 6 mL of deionized water. Afterwards, 4 mL of ethanol was added while stirring. After the mixture was mixed thoroughly, the cysteamine hydrochloride was added dropwise and continuously stirred at room temperature for another 6 h. Then, 0.1 g of sodium borohydride was added to the solution. The pH was adjusted to 7.0 by using HCl (0.1 M). The mixture was further stirred for an hour under nitrogen condition at 4 °C prior to lyophilization [Citation6]. Five samples were syntheszed with different feed molar ratios between the aldehyde group of OSA and amino group of cysteamine (1:0.25, 1:0.5, 1:1, 1:2 and 1:3). The TSA samples were named as TSA1, TSA2, TSA3, TSA4 and TSA5. The samples were characterized by 1H-NMR and FT-IR spectroscopies. The Ellman’s method was used to determine the thiol content in all the thiolated samples [Citation22].
Synthesis and characterization of unloaded disulphide cross-linked nanospheres
Preparation and characterization of unloaded nanospheres
TSA1 (0.1 g) was dissolved in 100 mL of deionized water under the stirring condition for 1 h at 4 °C. The solution was incubated in the dark at room temperature for 24 h. To facilitate the air oxidation reaction in the thiol groups, the solution was sonicated for 3 min. Subsequently, the solution was lyophilzed to obtain nanospheres in powder form [Citation6]. This procedure was repeated for TSA2, TSA3, TSA4 and TSA5. All the synthesized unloaded SA nanospheres were named as P1, P2, P3, P4 and P5.
The amount of thiol groups within the nanospheres was measured with Ellman’s reagent. The mean diameter (MD) and zeta potential of nanospheres were evaluated using a Zetasizer. The sample was diluted with deionized water and filtered with 0.45 µm-pore size filter to ensure that the particle distribution was within the range. The unloaded nanosphere morphology was analysed using TEM and FeSEM analyses [Citation6]. To identify S–S and S–H peaks, all the samples were prepared on glass slides and analysed with Raman spectrometer in the spectrum range of 100–4000 cm−1 [Citation9,Citation23].
Stability study of P1–P5
P1–P5 were placed in pH 7.4 buffer solutions at room temperature for a month. The samples were analysed using Zetasizer to determine any physical change in the nanospheres [Citation11].
Reduction response study of P1–P5
This study was performed at room temperature in a buffer solution of pH 7.4. The samples were exposed to different GSH concentrations. Any changes related to the size distribution of the nanospheres against different GSH concentrations were observed [Citation7]. P1–P5 were divided into three parts consisting of a control (buffer only), buffer with 10 µM and 10 mM of GSH. The nanosphere sizes of all the samples were measured using dynamic light scattering (DLS) method after 1 and 7 days [Citation6].
pH sensitivity study of P1–P5
All the nanosphere suspensions (P1–P5) were divided into several parts according to the pH values, which ranged from pH 1.0 to pH 8.0. The sensitivity of the prepared nanospheres towards different pH environments was identified through measurement with the DLS method in an aqueous medium at room temperature [Citation7]. The pH values were adjusted using HCl (0.1 M) and NaOH (0.1 M). The changes in particle size were also recorded [Citation11].
Synthesis and characterization of drug-loaded disulphide cross-linked nanospheres
The synthesized TSA1–TSA5 (0.1 g) was dissolved in 100 mL of deionized water. First, PCX (10 mg) was dissolved in 10 mL of acetonitrile before its addition to the polymer solution and continuously stirred for 1 h at 4 °C. The solution was incubated for 24 h away from light at room temperature. The drug-loaded nanospheres were collected by high-speed centrifugation at 6000 rpm for 25 min. The samples were washed three times with acetonitrile to remove the free drug. Subsequently, the samples were lyophilized to obtain drug-loaded nanospheres [Citation6]. To determine the encapsulation efficiency (EE, %), the samples were dissolved in acetonitrile and sonicated to extract the PCX from the nanospheres. Afterwards, the samples were stirred overnight and centrifuged; finally, the supernatant was analysed spectrophotometrically [Citation24]. The EE (%) was calculated based on EquationEquation (1)(1)
(1) .
(1)
(1)
where At is the total amount of PCX entrapped inside the pellet and Ai is the initial amount of PCX used for drug loading. All the drug-loaded nanoparticles (P1DL–P5DL) were characterized by DLS measurements (size and zeta potential). P3DL obtained the highest percentage of EE, and it was further analysed with TEM and FeSEM imaging.
In vitro drug release studies
The drug release profile for P1DL was studied by mimicking several pH environments in the stomach (pH 1.0, hydrochloride acid solution), small intestines (pH 7.4, PBS) and colon (pH 6.0, PBS). In colon, two conditions were used: with and without GSH (reductive medium). This study was performed at 37 ± 0.1 °C in a thermostatic rotary shaker at 50 rpm [Citation6].
Two sets of P1DL (10 mg) were placed in the dialysis bag and immersed in 10 mL of pH 1.0 HCl solution medium for 2 h in a beaker. After that, the samples were placed in simulated small intestine media and lasted for another 3 h. Next, both P1DL samples were retained in two different simulated colon media. The sample in medium without GSH acted as the control, and the other one was placed into (pH 6.0, PBS) containing GSH (25 mM) [Citation6]. At predetermined time intervals, 10 µL was withdrawn from the media, and an equal volume of fresh media was replenished [Citation10,Citation24]. The same procedure was applied for P2DL–P5DL. The PCX concentrations for all samples were measured using UV-VIS spectrophotometry at the wavelength of 230 nm [Citation24]. The cumulative drug release for all the samples was calculated as follows in EquationEquation (2)(2)
(2) :
(2)
(2)
where, Mt is the amount of drug release at a time and Mi is the initial amount of drug-loaded in nanospheres, respectively.
Surface modification of the unloaded nanospheres of SA
Layer-by-layer (LbL) self-assembly for unloaded nanospheres
The 4.0 mg of P3 nanospheres were placed in a beaker that contained 2 mL of 20 mg/mL PAH solution. The polyelectrolyte solution was prepared initially in 30 mM of KCl. The sample was sonicated for 1 min prior to incubation for 30 min. Next, the sample was centrifuged for 20 min at 11,000 rpm. The pellet was washed with KCl solution once. The same procedure was repeated to fabricate the second nanosphere layer using PSSCMA [Citation25]. The unloaded fabricated sample was labelled as P3/PAH/PSSCMA.
Stability, reduction response and pH sensitivity studies of P3/PAH/PSSCMA
The methods in section stability, reduction response and pH sensitivity studies for P1DL-P5DL were repeated for P3/PAH/PSSCMA. All the changes related to the nanosphere diameter were recorded [Citation6,Citation11].
Surface modification of drug-loaded nanospheres of SA
LbL self-assembly of drug-loaded nanospheres
Section LbL self-assembly for P3 nanospheres was repeated for P3DL. The fabricated nanospheres were labelled as P3DL/PAH/PSSCMA. The particle size of P3DL/PAH/PSSCMA was analysed using the Zetasizer [Citation25].
Characterization of P3DL/PAH/PSSCMA
P3DL/PAH/PSSCMA was analysed using X-ray photoelectron spectroscopy (XPS) analysis (surface characterisation), Zetasizer, TEM and FeSEM. XPS analysis was conducted to determine the chemical compositions on the surface of nanospheres, and the measurement was taken between 0 eV to 1200 eV with high-resolution spectra (C 1s, O 1s, N 1s and S 2p). The particle size distribution of P3DL/PAH/PSSCMA was evaluated using the Zetasizer. Both TEM and FeSEM analyses were performed for particle imaging purposes [Citation25].
In vitro drug release study for P3DL/PAH/PSSCMA
The drug release profile for P3DL/PAH/PSSCMA was determined according to the method mentioned in the Section “In vitro drug release studies for drug-loaded disulphide cross-linked nanospheres (P1DL-P5DL)”.
Cell culture
Human colon cancer adenocarcinoma cells (HT-29) and human normal colon cells (CRL 1790) were utilized for the cell culture experiments. Both cell lines were maintained in RPMI and DMEM media supplemented with 10% FBS and 1% penicillin-streptomycin, respectively. The cells were incubated in a humidified incubator chamber with 5% CO2 at 37 °C [Citation26].
Cytotoxicity assays
MTT assay was conducted using HT-29 and CRL 1790 cell lines against the samples P3/PAH/PSSCMA, P3DL/PAH/PSSCMA and PCX. All the confluent cells in the culture flask were detached using pre-warmed trypsin. The cells were collected by centrifugation at 1000 rpm for 5 min. The supernatant was discarded, whereas the precipitate cells were gently resuspended with complete medium. Subsequently, 50 µL of the cell suspension was mixed thoroughly with 50 µL of trypan blue. The mixture was placed onto the slide counter. The total cells for both cell lines (HT-29 and CRL 1790) were counted using an automated cell counter.
The HT-29 cells were seeded in 24-well culture plates with a density of 4 × 10⁴ cells per well in RPMI culture medium and incubated for 24 h to allow cell attachment at 37 °C in 5% CO2 humidified incubator [Citation27]. Afterwards, the cells were incubated with the samples for 24 h. All the samples were prepared in serial dilutions of 0.8, 1.6, 3.2, 6.3, 12.5 and 50 (µg/mL). On the next day, the culture medium was removed, and 10 µL of MTT reagent was added into each well and further incubated for 1–4 h. Later, 200 µL of stop reagent was added to stop the reaction between the cells and MTT solution and left for another 2 h.
CRL 1790 cells were seeded in 24-well culture plates with a density of 4 × 10⁴ cells per well by using DMEM culture medium. The cells were left to attach for about 4 h of incubation in 5% CO2 humidified incubator at 37 °C. The cells were incubated with different sample concentrations for 24 h. The culture medium was removed before 10 µL of MTT reagent was added into each well. After the incubation period of 1–4 h, 200 µL of stop reagent was added into each well and left for another 2 h. All the mixtures were agitated prior to measurement. The optical densities (OD) of MTT were measured at 570 nm in a microplate reader [Citation24]. The cell viability was calculated as follows in EquationEquation (3)(3)
(3) :
(3)
(3)
where OD treated is obtained in the presence of the samples and OD control is obtained without the samples, respectively.
Cellular uptake studies for HT-29
Preparation of rhodamine 110-labelled P3DL/PAH/PSSCMA
Briefly, the P3DL/PAH/PSSCMA nanospheres were labelled with rhodamine 110 fluorescence dye to demonstrate the cellular uptake of the nanospheres by colon cancer cells. The P3DL/PAH/PSSCMA (1 mg) was dispersed in 1 mL of PBS. Subsequently, 10 µL of rhodamine 110 (5 mg/mL) was added and stirred overnight in dark condition. The suspension was centrifuged, and the pellet was further washed for three times with ethanol to remove any unbound dye [Citation24].
Fluorescent intensity
The HT-29 cells were seeded in 96-well microplate and incubated for 2 days until a monolayer was formed. P3DL/PAH/PSSCMA was diluted before placing it in the wells of the plate that contained 3 × 10⁴ colon cancer cells per well for 4 h. The cells were washed with PBS to remove any free nanosphere and dye, which were not effectively internalized by the cells [Citation13]. These cells were treated with 100 µL of lysis buffer (0.5% Triton X-100 in 0.2 M NaOH solution) to allow permeabilization of the nanospheres into the cell membrane of the colon cancer cells. The cellular uptake of P3DL/PAH/PSSCMA rhodamine 110 labelled by colon cancer cells was quantified using fluorescent intensity in microplate reader [Citation26]. The cellular uptake (%) of the sample was calculated as follows in EquationEquation (4)(4)
(4) :
(4)
(4)
where FIs is fluorescent intensity in the cells and FIi is original intensity in feed medium, respectively.
Fluorescent imaging
In fluorescence microscopy, the cells (5.0 × 10⁴) were dispensed in a 24-well plate and allowed to spread completely by placing those cells in tissue culture incubator at 37 °C with 5% CO2 for 24 h. Afterwards, the cells were treated with labelled P3DL/PAH/PSSCMA (50 µg/mL) for another 4 h [Citation24]. The cells were washed with PBS to remove any free nanosphere and dye, which were not effectively internalized by the cells [Citation28]. Finally, the cells were viewed under the fluorescence microscope [Citation24].
Statistical analysis
All the conducted experiments were repeated three times independently, and the results were expressed as mean ± standard deviation (SD). The SD values are indicated as error bars in their corresponding graphs [Citation26]. The paired sample t-test was used to analyse the significant difference of thiol content between thiolated and nanospheres samples. In addition, one-way ANOVA and paired sample t-test were performed to analyse the cytotoxicity assay results. One-way ANOVA with post-hoc analysis using Dunnett’s (two-sided) test was used in the statistical analysis for drug release study. All the statistical analysis tests were conducted using IBM SPSS Statistics Version 22.0; IBM Corp, Armonk, New York, USA. The probability of p < .05 was considered statistically significant.
Results and discussion
Synthesis and characterization of TSA
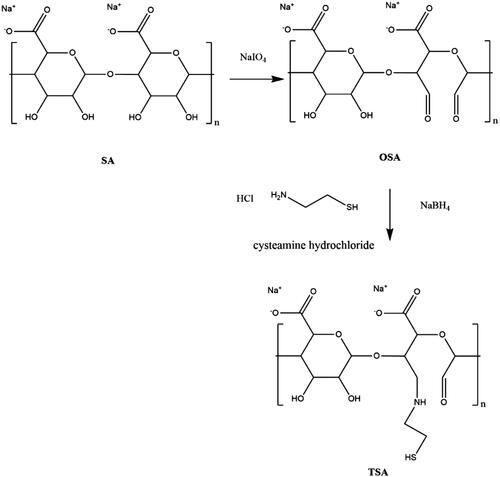
illustrates the synthesis of TSA. SA was oxidized using sodium periodate prior to the addition of cysteamine hydrochloride to modify its backbone. The thiol group in a linear chain of cysteamine was later used to derivatize the nanopolymer formulation. The degrees of oxidation (%) for OSA1, OSA2 and OSA3 were 3.39 × 10⁻³, 6.31 × 10⁻³ and 11.54 × 10⁻³, respectively. OSA3 presented the highest degree of oxidation due to the highest concentration of sodium periodate used in accordance with the feed molar ratio between SA and sodium periodate (10:3).
Figure 1. Synthethic scheme of TSA.
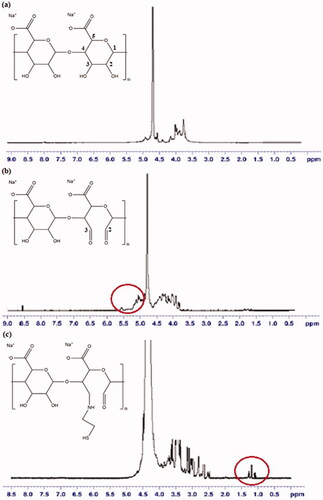
In 1H-NMR analysis (), the molecular formula of SA is (C6H7NaO6)n; therefore, δ = 3.67–4.02 (m, 5H, methine protons of hexuronic acid residues of SA main chains) and 4.09–4.95 (m, 2H, alcohol hydroxyl of hexuronic acid residues of SA main chains) [Citation29]. Most of the peak intensities in OSA, particularly 3.7 ppm, decreased compared with that of SA because of the oxidative environment state of the samples [Citation30]. The protons from newly formed aldehyde in OSA showed at 5.19 and 5.63 ppm which corresponded to hemiacetalic protons formed from aldehyde and neighbouring hydroxyl protons, thereby corroborating with the synthesis of SA modification with the breakage of C2–C3 linkage [Citation12,Citation20,Citation30]. The 1H-NMR spectra for TSA showed the emergence of a new peak at 1.16 ppm, which was not present in SA. The same results were obtained for TSA2–TSA5, which suggested the change in the molecular structure of SA by the presence of thiol peak [Citation11].
Figure 2. 1H-NMR spectra for (a) SA, (b) OSA and (c) TSA.
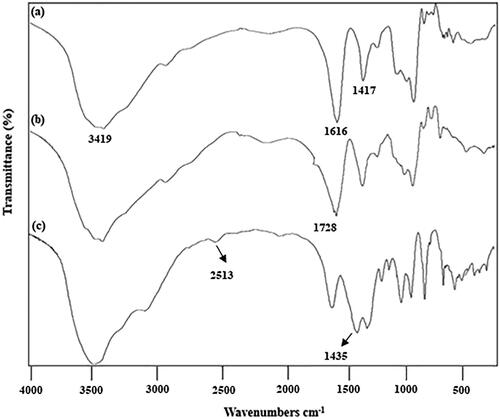
Differences were noted among all the spectra reported in FT-IR (). The FT-IR spectra for SA (KBr) revealed the following: 3650–3200 (OH), 1780–1650 (C = O) and 1428 cm−1 (carboxylate salt ion). Previous study reported peaks at 3429, 1630 and 1428 cm−1 for SA [Citation31]. In comparison with SA, a new peak was observed at 1728 cm−1 for OSA. This band was assigned to the aldehyde group (CHO) in the polymer. Most of the aldehydes from OSA spectra are present in the range of 1720–1740 cm−1 [Citation6,Citation12]. All of the samples (TSA1, TSA2, TSA3, TSA4 and TSA5) showed the appearances of new bands at 2515.2, 2511.7, 2519.0, 2513.2 and 2513.5 cm−1, respectively, which denoted the presence of thiol group (SH) in the compounds [Citation32].
Figure 3. FT-IR spectra of (a) SA (b) OSA and (c) TSA.
Characterization of nanospheres (P1–P5)
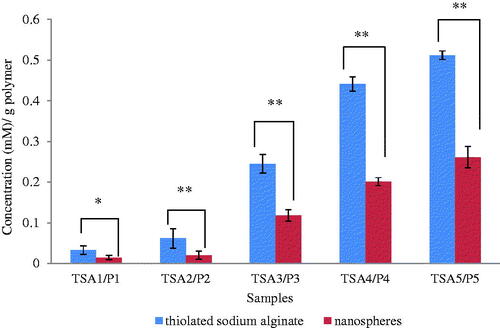
The Ellman’s method was conducted to determine the amount of thiols in modified TSA polymers and disulphide cross-linked nanospheres (P1–P5) [Citation15, Citation21]. Significant difference is observed for the concentration of thiol between TSA and nanospheres (). Low thiol concentration was detected in nanospheres because of the formation of disulphide bond [Citation32]. Thus, the oxidation of thiols was successfully bonded to form disulphide linkage in the core (hydrophobic) of the nanospheres. Furthermore, the inter- and intramolecular hydrogen bonds among the tightly packed TSA backbones also promoted the self-aggregation to shrink and wrap the hydrophobic core tightly [Citation6, Citation11].
Figure 4. The comparison of thiol content between thiolated sodium alginate (TSA1–TSA5) and disulphide cross-linked nanospheres (P1–P5) (mean ± SD, n = 3) with.** p < .01.
The formation of disulphide bonds in the polymers was further proven by Raman analysis [Citation18]. Readings were obtained in the range of 100–3000 cm−1 with an incident laser excitation wavelength of 514.5 nm and output of 20 mW. According to the obtained spectrum, the S–S peak for each nanosphere samples (P1–P5) was identified at 500, 499, 503, 506 and 492 cm−1, respectively, with the range of 490–510 cm−1. However, the S–H peak (2550–2600 cm−1) was not observed in the samples [Citation9,Citation18,Citation23]. This result confirmed the formation of disulphide cross-linked in nanospheres.
As shown in , the average size for all the samples was between 113.0 ± 3.6 and 291.0 ± 3.9. The PDI values were between 0.356 ± 0.060 and 0.423 ± 0.027, which indicated that all the nanospheres were moderately distributed in the solution during the measurements. High absolute value for zeta potential shows high stability of the nanospheres from the strong repelling interaction between the particles [Citation25]. The particles with negative surface charges adhere more easily at inflamed tissue [Citation11]. Results showed that P3 was the smallest nanosphere synthesized with the formulated feed molar ratio between the aldehyde group of OSA and the amino group of cysteamine hydrochloride (1:1). The P5 contained the highest amount of thiol groups. These thiol groups bound with the adjacent thiol groups instead of the opposite thiols within the core of nanospheres. Consequently, P5 possessed the largest average size. In addition, the SA became hydrophobic with the core consisted of disulphide linkages, which was formed by self-assembled oxidation of the thiols. The structure became coiled, which acted as a shield surrounding the hydrophobic core [Citation6].
Table 1. The comparison results between particle sizes distribution and zeta potential for P1–P5, (mean ± SD, n = 3).
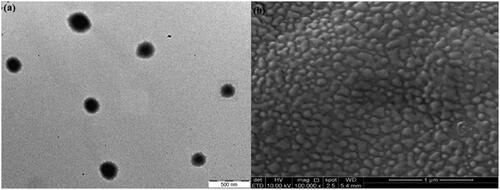
The TEM photograph () in aqueous medium shows that the nanospheres in P3 possessed a spherical core shell configuration with nanosize diameter. The surfaces were smooth without any pore detected. Meanwhile, the FeSEM images were obtained to analyse the morphological properties of disulphide cross-linked nanospheres and provide detailed images on the nanospheres’ surface topography and composition. The image in illustrates the P3 particles in nanometer size with cubic and spherical shapes. No pore was detected which indicates the smooth surface on P3 particles.
Figure 5. TEM and FeSEM images for P3 with magnification of 88,000× and 100,000×, respectively.
Stability, reduction response and pH sensitivity studies of unloaded nanospheres (P1–P5)
Stability study was conducted to evaluate the stability of the nanospheres in buffer solution. Most of the nanospheres changed slightly in size and PDI values. Overall, all the samples (P1–P5) were highly stable with 9–11 nm increase in size after a month. For instance, the average size (nm) of P3 increased from 125.0 ± 3.6 to 134.8 ± 1.1 nm whereas increment from 0.407 ± 0.021 and 0.478 ± 0.053 for the PDI value. The zeta potential (mV) values showed only slight difference between before (−24.6 ± 2.1) and after storage (−25.5 ± 4.1). These findings suggested that the disulphide cross-linked nanospheres are stable with inter- and intramolecular forces in the core [Citation6]. The stable disulphide bonds can prevent drug leakage from the nanospheres before reaching the target site.
Reduction response analysis () was carried out to examine the behaviour of the nanospheres in reductive environment. GSH (10 µM and 10 mM) was used as the reducing agent to cleave the disulphide bonds. All the samples responded to the reduction conditions. The nanospheres were stable in buffer solutions without GSH and slightly increased in size after 7 days. By contrast, remarkable differences were noted in the MDs of the nanospheres at different GSH concentrations (10 µM and 10 mM) after day 1 and 7. P2 showed the least increment in particle diameter, that is, from 172.4 ± 1.6 (1 day) to 179.2 ± 3.3 (7 days). The particles were large with GSH concentration due to the cleavage of the disulphide bonds as a response to the increased reducing agent in the solution [Citation12,Citation33]. In summary, the increase in particle size depended on the concentration of the reducing agent (GSH) and storage time.
Table 2. The comparison particle sizes and distribution of nanospheres (P1– P5) at pH 7.4 with various concentrations of GSH for (a) 1 day and (b) 7 days, (mean ± SD, n = 3).
The pH sensitivity results indicated that the nanospheres showed the maximum diameter at pH 7.0. The size of P1–P5 increased by 97.6, 72.5, 154.8, 65.2 and 52.7% from pH 1 to 7, respectively. Polymers ionize into acidic or basic properties according to their pH surroundings. The pH solutions may lead to the protonation of functional groups in polymer chains [Citation34]. Ionization of carboxyl groups in SA increased from pH 3.0 to 7.0. At this condition, many hydrogen bonds between the carboxyl groups were eliminated, which caused the electrostatic repulsion between these ionized carboxyl groups and the other polymer chain segments. Consequently, the diameter of the particles increased. On the contrary, when the pH increases to 8.0, the effect from counter ions weakens the electrostatic repulsion, which causes the rapid decrease in size [Citation11].
Characterization of drug-loaded disulphide cross-linked nanospheres (P1DL–P5DL)
The highest percentage EE of PCX-loaded nanospheres was observed in the order of P3DL > P2DL > P4DL > P1DL > P5DL with 89.7, 79.7, 75.7, 69.1 and 60.4%, respectively. The hydrophobic interaction between the core (disulphide bonds) of the nanospheres and the drug contributed to high EE. The presence of disulphide bonds assisted the hydrophobic PCX into the self-assembly of nanospheres (). The disulphide bonds can provide stability impact due to the good balance of intermolecular forces within the nanospheres [Citation11,Citation35]. The average size of all the unloaded () and loaded nanospheres () increased due to the presence of the drug.
Figure 6. The self-assembly process of disulphide cross-linked nanospheres.
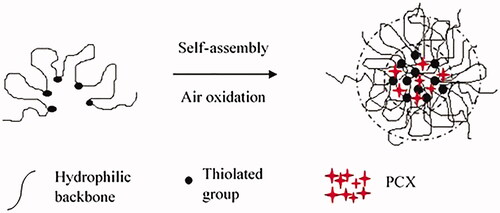
Table 3. The comparisons results between particle sizes and zeta potential of P1DL-P5DL (mean ± SD, n = 3).
In vitro drug release studies for drug-loaded disulphide cross-linked nanospheres (P1DL–P5DL)
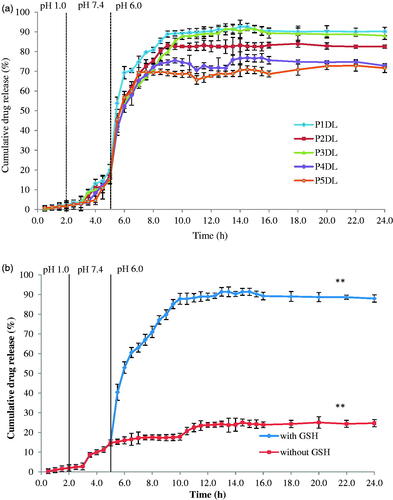
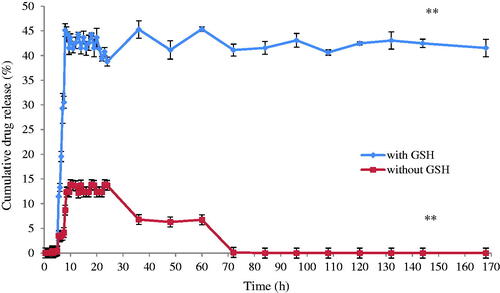
All the drug-loaded nanospheres showed the same drug release profile in . Only minimal cumulative drug release was detected in stomach and small intestine media with approximately 3.0 and 20.0%, respectively. The cumulative drug release reached plateau in the colon media (presence of GSH) beginning at 9 h and remained at the same cumulative drug release for 24 h. The drug release mechanism in this study is based on the breakage of disulphide linkages in the nanospheres and release of PCX. The reduction process occurred in the colon with the assistance of GSH (reducing agent) in the colonic environment. The disulphide bonds were cleaved reversibly in an intracellular reductive environment due to higher GSH concentration intracellularly (2–20 mM) than that extracellularly (2–20 µM) [Citation6]. Furthermore, colon cancer cells possess four times higher concentration of GSH than those of normal cells [Citation11]. This condition helped in the high release of PCX from the nanospheres. The cumulative drug release was in the order of P1DL > P3DL > P2DL > P4DL > P5DL. P3DL exhibited good properties in terms of EE (89.7%) and cumulative drug release (91.4%) (). Hence, P3DL was selected as the most suitable formulation for further characterisation studies and surface modification.
Figure 7. The drug release profile of PCX in simulated gastrointestinal media for (a) P1DL–P5DL (with GSH) and (b) P3DL (with and without GSH), (mean ± SD, n = 3).** p < .01 indicates statistically significant difference at pH 6.0 using paired sample t- test.
TEM and FeSEM analyses for P3DL
The TEM image () of P3DL shows the presence of a membrane surrounding the nanospheres, which indicated that the drug was successfully encapsulated in the nanospheres. Particles exhibited nanosize diameter with mixed cubic and spherical configurations in the FeSEM photograph (). Their surfaces were smooth with no spotted pores.
Figure 8. TEM and FeSEM images of P3DL with magnification 88,000× and 100,000×, respectively.
Synthesis and characterization of P3/PAH/PSSCMA
Surface modification was conducted for P3 using LbL technique in assembling polyelectrolytes with PAH and PSSCMA to enhance the drug release and transit time. Unloaded fabricated P3 showed bigger mean diameter (MD) than unloaded P3 () due to the additional layers of polyelectrolytes on the nanospheres. The same condition was observed with nanosphere thickness in relation to the number of polyelectrolytes used [Citation27,Citation36]. A small gap difference was also observed between the diameter of unloaded PAH with the unloaded PAH/PSSCMA (±15.6 nm) because of the electrostatic interaction attraction between the oppositely charged of polyelectrolytes [Citation37]. These polyelectrolytes form strong electrostatic attraction between the amine (cation) from PAH layer with carboxyl and sulphonate (anion) from PSSCMA layer [Citation38].
Table 4. Comparison of MD for P3 in different conditions: unloaded and fabricated with PAH and PSSCMA (mean ± SD, n = 3).
Stability, reduction response and pH sensitivity studies for P3/PAH/PSSCMA
The stability study on fabricated nanospheres was conducted in a buffer solution for a month with the diameter recorded before and after storage. The MD (nm) of the fabricated nanospheres increased from 189.8 ± 5.7 to 249.6 ± 10.8, whereas the PDI values showed minimal changes with 0.146 ± 0.035 before storage and 0.149 ± 0.025 after storage. However, the zeta potential (mV) recorded a considerable difference from −53.4 ± 5.4 to −29.3 ± 1.8, which suggested that the charge of polyelectrolytes outside the nanospheres was affected after the storage in a buffer solution.
The reduction response study was performed to determine the reaction of the samples in terms of its size after incubation with different GSH concentrations within a stimulated period (). The measured nanosphere diameter in 10 mM GSH was larger than that in 10 µM GSH, and it increased from day 1 to day 7. In 10 mM GSH, the size increased from day 1 to day 7 by 19.4 and 33.0%, respectively, due to the breakage of disulphide cross-linked bonds in the nanospheres by GSH [Citation6,Citation12].
Table 5. The MD and PDI of P3/PAH/PSSCMA at pH 7.4 with various concentrations of GSH for (a) 1 day and (b) 7 days (mean ± SD, n = 3).
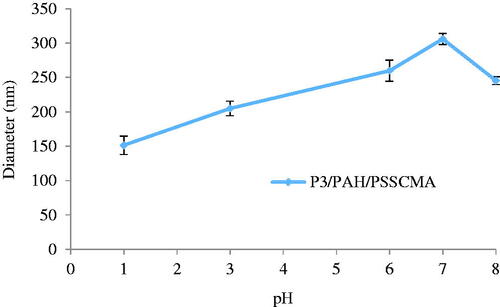
P3/PAH/PSSCMA nanospheres increased by 102.2% from pH 1 to 7 (). With the increased pH, the carboxyl and sulfonic acid groups in the PSSCMA were ionized, which resulted in hydrogen bond elimination. The loss of protons from these groups generated the electrostatic repulsion among the polymer chain segments of PSSCMA and affected the size of the nanospheres. Therefore, the nanospheres displayed large particle sizes. Nevertheless, the nanosphere diameter decreased when the pH changed from 7 to 8 due to the counter ion effect from the environment [Citation11,Citation34].
Figure 9. pH sensitivity study for P3/PAH/PSSCMA (mean ± SD, n = 3).
Characterization of the synthesized P3DL/PAH/PSSCMA
The P3 size increased by approximately 23.5 nm with loaded PCX (). The diameter of fabricated nanospheres, P3DL/PAH and P3DL/PAH/PSSCMA differed by ± 16.0 nm due to the additional layers of polyelectrolytes on the surface. Drug loading and surface modification contributed to the changes in P3 nanospheres MD.
Table 6. The MD of P3 nanospheres in different conditions: unloaded, PCX loaded and fabrication with PAH and PSSCMA, (mean ± SD, n = 3).
The EE values of P3DL/PAH/PSSCMA and P3DL were 77.1 and 89.7%, respectively. The decrease in EE after surface fabrication may be due to the release of the drug (drug loss) during fabrication through sonication [Citation36] or centrifugation. Both methods were conducted to ensure the formation of rigid shell surrounding the nanospheres to avoid any undesired effect of drug leakage [Citation39].
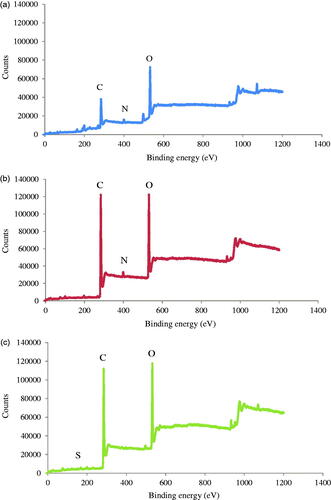
XPS analysis
The XPS analysis () was carried out on P3DL/PAH/PSSCMA to ensure that the polyelectrolytes were assembled into the P3DL nanospheres. Zeta potential was recorded at −36.6 mV for P3DL. Therefore, the first LbL layers were PAH (polycation) and PSSCMA (polyanion) in sequence. Both polyelectrolytes possess distinct characteristics, with PAH containing nitrogen [Citation25] and PSSCMA containing sulphur [Citation36].
Figure 10. The XPS spectra of (a) P3DL, (b) P3DL/PAH and (c) P3DL/PAH/PSSCMA nanospheres.
The binding energy at 401 eV () indicates a protonated amine present in PAH [Citation25]. The intensity of nitrogen peak decreased for P3DL/PAH/PSSCMA and P3DL, which suggested the conjugation of the protonated amine from PAH onto P3DL nanospheres [Citation25]. shows high-resolution S 2p peak at 168 eV, which corresponded to the sulphur element from PSSCMA [Citation36] that was absent in P3DL/PAH. This result proved that PSSCMA was the outermost layer of the nanospheres, and the LbL surface fabrication was successful. The LbL self-assembly can also be confirmed by zeta potential (mV) measurement. The first layer was positive with 45.5 ± 6.05 because of protonated amine groups, whereas the second layer was negative with −58.5 ± 1.25 due to the carboxyl and sulphonate groups from PSSCMA [Citation37,Citation38]. This condition demonstrated that both polyelectrolytes are sequentially deposited onto each other at the nanospheres surface [Citation36].
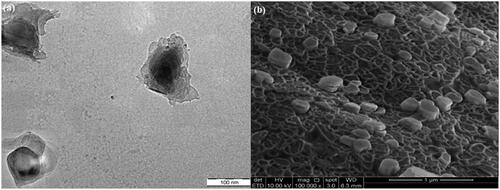
TEM and FeSEM for P3DL/PAH/PSSCMA
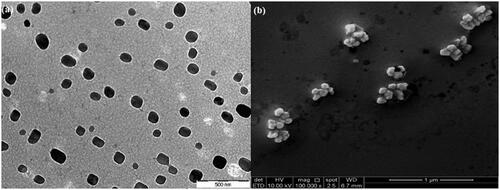
The TEM image for P3DL/PAH/PSSCMA shows the presence of an outer layer around the nanospheres () with a dark core. This layer indicated that the nanospheres were surrounded with the polyelectrolytes layers. The FeSEM image for P3DL/PAH/PSSCMA () shows that the nanoparticles are in spherical and cubic shapes and appeared as rigid structure compared with that of P3DL because of the presence of fabrication layers. The surfaces remained smooth without any pore spotted.
Figure 11. Comparison of high-resolution XPS spectra between P3DL, P3DL/PAH and P3DL/PAH/PSSCMA with (a) C 1s, (b) O 1s, (c) N 1s and (d) S 2p.
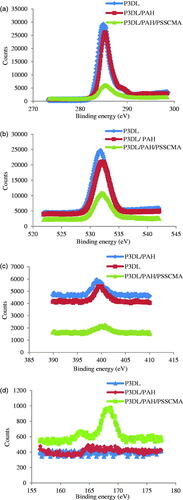
Figure 12. TEM and FeSEM images of P3DL/PAH/PSSCMA with magnification of 110,000× and 100,000×, respectively.
In vitro drug release study for P3DL/PAH/PSSCMA
The drug release study was also conducted for P3DL/PAH/PSSCMA (). The cumulative drug release of PCX was recorded at 45.1% after 8 h in the media and compared to control (without GSH) was 13.8%. GSH plays an important role as a reducing agent to induce cleavage of the disulphide bond to ensure the release of the drug in selective media of pH 6.0 at the colon cancer site in the human body.
Figure 13. The cumulative drug release (%) of P3DL/PAH/PSSCMA for 170 h in simulated gastrointestinal media, (mean ± SD, n = 3).** p < .01 indicates statistically significant difference at pH 6.0 using paired sample t-test.
exhibits that the P3DL/PAH/PSSCMA recorded lower amount of cumulative drug release (45.1%) than P3DL (91.4%) due to the less amount of drug encapsulated in the fabricated nanospheres. Furthermore, the presence of polyelectrolyte layers in P3DL/PAH/PSSCMA resulted in slow drug release. The layers became an obstacle, and they sustained the release of PCX from rapid burst [Citation36,Citation40–42] due to the strong electrostatic attraction between the oppositely charged polyelectrolytes thus decrease the ability to release the drug [Citation36,Citation43].
P3DL graph shows a sudden decrease in cumulative drug release (%) after 24 h because of PCX degradation. The hydrolysis of ester bonds occurred in media solution causes lower amount of cumulative drug release [Citation44]. Therefore, the polyelectrolyte layers deposited on the P3DL/PAH/PSSCMA nanospheres act to preserve and delay the degradation of PCX in the GI tract [Citation36].
Additionally, the surface fabrication of nanospheres can protect the drug along the GI tract until it reaches the colon target site. The pH values fluctuate along the GI tract from an extremely acidic (pH 1.2–3.7) condition in the stomach to nearly neutral (pH 7.4) in the small intestine [Citation45]. Therefore, the degree of ionization from the functional groups of polyelectrolytes must be able to adapt with the rapid changes in pH. The polyelectrolyte nanoparticles must also be able to endure shrinking, swelling and disintegration in response to these extreme conditions [Citation4]. Hence, the use of LbL technique for the surface modification of nanospheres is a promising approach for an efficient drug delivery system.
MTT assay for HT-29 and CRL 1790
The MTT assay result showed as the concentration of samples and drug increased, the cancer cell viability was affected. The lowest P3/PAH/PSSCMA concentration showed a high percentage of cell viability against HT-29 (). The cell viability (%) for some concentrations were statistically significant (p < .05), except for 0.8, 1.6, 3.1 and 6.3 µg/mL, to the untreated. The cell viability (%) for P3/PAH/PSSCMA is significantly higher compared to P3DL/PAH/PSSCMA in all concentrations. Thus, P3DL/PAH/PSSCMA successfully penetrated and killed the cancer cells due to PCX encapsulation [Citation24].
Figure 14. The comparison of cumulative drug release (%) between P3DL and P3DL/PAH/PSSCMA vs. time (h) for 170 h with GSH (mean ± SD, n = 3).** p < .01 indicates both samples statistically significant differences using Tukey-HSD test.
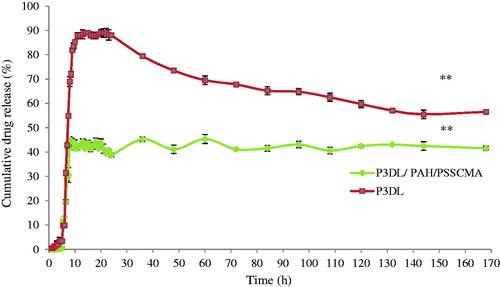
Figure 15. The comparison between P3/PAH/PSSCMA, P3DL/PAH/PSSCMA, PCX and untreated against (a) HT-29, (b) CRL 1790, (mean ± SD, n = 5). Data marked with the same letters show significant difference between the samples, the * indicates p < .05 compared to the untreated.
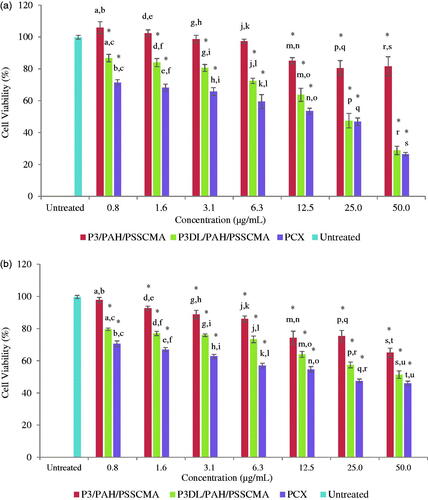
For CRL 1790 (), the lowest concentration of P3/PAH/PSSCMA (0.8 µg/mL) showed no significantly different in cell viability (%) compared to the untreated (p > .05). This result showed that P3/PAH/PSSCMA (0.8 µg/mL) presented no toxicity towards the normal colon cells. In contrast, 51.4% of the cells were viable with P3DL/PAH/PSSCMA at the concentration of 50 µg/mL. The release of PCX also killed the normal colon cells. This result was supported by the decreased cell viability at 46.0% for PCX at 50 µg/mL. PCX cannot distinguish between cancerous or normal cells; hence, PCX will exhibit cytotoxic behaviour against the normal colon cells [Citation24].
Although P3DL/PAH/PSSCMA and PCX were both toxic, stronger toxic effects were shown against HT-29 compared to CRL 1790. Overall, the cell viability values for unloaded fabricated nanospheres (P3/PAH/PSSCMA) at all concentrations were more than 50.0%, thereby indicating mild toxicity of the fabricated sample towards both cell lines. This finding was in agreement with the United States Pharmacopeia (US Pharmacopeia XXXII, 2009), which stated that under Biological Reactivity Test in vitro, the cell relative proliferation rate with more than 50.0% is categorized as mild toxicity of biomaterials for drug delivery study [Citation46].
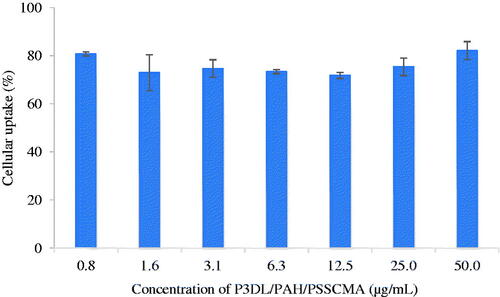
Cellular uptake of P3DL/PAH/PSSCMA
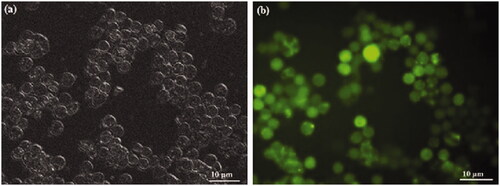
P3DL/PAH/PSSCMA was labelled using rhodamine 110 to demonstrate the cellular uptake in HT-29 cell line. The fluorescent dye conjugated with sample acted as an indicator to illustrate the cell uptake of a sample. Cellular uptake was determined quantitatively by examining the fluorescent intensity of HT-29 after 4 h of treatment with the sample. The rate of nanospheres uptake into any type of cells would reach a saturated point in the range of 4–7 h [Citation47]. The uptake was considered good with cell internalization of more than 70.0% in HT-29 (Figure 16). PSSCMA, as the outer layer of nanospheres, can destabilize the cell membrane, which can result in high (%) cellular internalization [Citation48].
Figure 16. Cellular uptake of rhodamine 110 labelled P3DL/PAH/PSSCMA nanospheres by HT-29 cells (mean ± SD, n = 5).
Fluorescent imaging analysis was conducted to verify the results from the cellular uptake study. The concentration of 50 µg/mL (highest) was selected for visualization under fluorescent microscopy (Figure 17). The uptake of P3DL/PAH/PSSCMA nanospheres by the cells appeared green under the microscope. The strong intensity of green fluorescence indicates high cellular uptake of P3DL/PAH/PSSCMA nanospheres into HT-29 [Citation49]. All the nanospheres were distributed well within the cancer cells. Therefore, P3DL/PAH/PSSCMA exhibited good cell internalization behaviour in both quantitative and qualitative cellular uptake studies.
Figure 17. The cellular uptake of rhodamine 110 labelled P3DL/PAH/PSSCMA nanospheres by fluorescent microscopy imaging after sample treatment with (a) bright field image and (b) fluorescent image detected with 40,000× magnifications.
Conclusion
This project successfully synthesized TSA by applying different ratios of OSA and cysteamine hydrochloride into formulated nanospheres by using self-assembly method. The thiol groups of TSA were oxidized to form disulphide cross-linked in the nanospheres. PCX was used as the chemotherapeutic drug for nanoencapsulation. TEM photograph showed that the nanospheres possessed a spherical core-shell structure. The DLS measurements exhibited that the nanospheres were stable, with a good pH sensitivity response. The size of nanospheres increased when exposed to the reductive environment. The loaded nanosphere, that is, P3DL, was the most ideal formulation based on the highest EE capacity (89.7%) with cumulative drug release of 91.4% for 24 h. Hence, the P3DL surface was further modified to improve and prolong the release of PCX by using PAH and PSSCMA. The successive deposition of the layers was confirmed by XPS and Zetasizer analyses. The EE for P3DL/PAH/PSCCMA was 77.1%, with cumulative drug release of 45.1% in pH 6.0 medium with GSH. The P3DL/PAH/PSSCMA was analysed for cytotoxicity study by using HT-29 and CRL 1790 cell lines. More than 70.0% of P3DL/PAH/PSSCMA nanospheres were detected in HT-29 cells, which showed the successful cellular internalization of the fabricated nanospheres in the cancer cells. This work provides a promising approach of controlling and sustaining drug release as an alternative approach for PCX delivery to colon target sites with reduced toxic effects.
Disclosure statement
No potential conflict of interest was reported by the authors.
Additional information
Funding
Related Research Data
References
- Sreelatha D, Brahma C. Colon targeted drug delivery – a review on primary and novel approaches. J Glob Trends Pharm. 2013;4:1174–1183.
- Saphier S, Haft A, Margel S. Bacterial reduction as means for colonic drug delivery: can other chemical groups provide an alternative to the Azo bond? J Med Chem. 2012;55:10781–10785.
- Butte K, Momin M, Deshmukh H. Optimisation and in vivo evaluation of pectin based drug delivery system containing curcumin for colon. Int J Biomater. 2014;2014:1.
- Deng L, Dong H, Dong A. A strategy for oral chemotherapy via dual pH-sensitive polyelectrolyte complex nanoparticles to achieve gastric survivability, intestinal permeability, hemodynamic stability and intracellular activity. Eur J Pharm Biopharm. 2015;97:107–117.
- Sosnik A. Alginate particles as platform for drug delivery by the oral route: state-of-the-art. ISRN Pharm. 2014;2014:926157.
- Chang D, Lei J, Cui H, et al. Disulfide cross-linked nanospheres from sodium alginate derivative for inflammatory bowel disease: preparation, characterization, and in vitro drug release behavior. Carbohydr Polym. 2012;88:663–669.
- Huang J, Xue Y, Cai N, et al. Efficient reduction and pH co-triggered DOX-loaded magnetic nanogel carrier using disulfide crosslinking. Mater Sci Eng C. 2015;46:41–51.
- Tiwari G, Tiwari R, Wal P, et al. Primary and novel approaches for colon targeted drug delivery – a review. Int J Drug Delivery. 2010;2:1–11.
- Yusuf SNAM, Ng YM, Ayub AD, et al. Characterisation and evaluation of trimesic acid derivatives as disulphide cross-linked polymers for potential colon targeted drug delivery. Polymers 2017;9:1–16.
- Agarwal T, Narayana SNGH, Pal K, et al. Calcium alginate-carboxymethyl cellulose beads for colon-targeted drug delivery. Int J Biological Macromolecules. 2015;75:409–417.
- Gao C, Liu T, Dang Y, et al. pH/redox responsive core cross-linked nanoparticles from thiolated carboxymethyl chitosan for in vitro release study of methotrexate. Carbohydr Polym. 2014;111:964–970.
- Gao C, Tang F, Zhang J, et al. Glutathione-responsive nanoparticles from a sodium alginate derivative for selective release of doxorubicin in tumor cells. J Mater Chem B. 2017;5:2337–2346.
- Martinez A, Miguel MB, Iglesias I, et al. Tamoxifen-loaded thiolated alginate-albumin nanoparticles as antitumoral drug delivery systems. J Biomed Mater Res. 2012;100(6):1467–1476.
- Paques JP, Linden EVD, Rijn CJMV, et al. Preparation methods of alginate nanoparticles. Adv Colloid Interface Sci. 2014;209:163–171.
- Zhao Y, Gao S, Zhao S, et al. Synthesis and characterization of disulfide-crosslinked alginate hydrogel scaffolds. Mater Sci Eng C. 2012;32:2153–2162.
- Hauptstein S, Dezorzi S, Prufert F, et al. Synthesis and in vitro characterization of a novel S-protected thiolated alginate. Carbohydr Polym. 2015;124:1–7.
- Wang C, Ho PC, Yong L. Wheat germ agglutinin-conjugated PLGA nanoparticles for enhanced intracellular delivery of paclitaxel to colon cancer cells. Int J Pharm. 2010;400:201–210.
- Lim V, Peh K, Sahudin S. Synthesis, characterisation, and evaluation of a cross-linked disulphide amide-anhydride-containing polymer based on cysteine for colonic drug delivery. IJMS. 2013;14:24670–24691.
- Szczepanowicz K, Bzowska M, Kruk T, et al. Colloids and surfaces B: biointerfaces pegylated polyelectrolyte nanoparticles containing paclitaxel as a promising candidate for drug carriers for passive targeting. Colloids Surf B Biointerfaces. 2016;143:463–471.
- Gomez CG, Rinaudo M, Villar M. a. Oxidation of sodium alginate and characterization of the oxidized derivatives. Carbohydr Polym. 2007;67:296–304.
- Zhao H, Heindel ND. Determination of degree of substitution of formyl groups in polyaldehyde dextran by the hydroxylamine hydrochloride method. Pharmaceut Res. 1991;8:400–402.
- Bernkop-Schnurch A. Thiolated polymers—thiomers: synthesis and in vitro evaluation of chitosan–2-iminothiolane conjugates. Int J Pharm 2003;260:229–237.
- Lau Y, Lim V. Colon targeted drug delivery of branch ‑ chained disulphide cross‑linked polymers: design, synthesis, and characterisation studies. Chem Cent J. 2016;10:1–19.
- Smitha KT, Anitha a, Furuike T, et al. In vitro evaluation of paclitaxel loaded amorphous chitin nanoparticles for colon cancer drug delivery. Colloids Surf B Biointerfaces. 2013;104:245–253.
- Yu X, Pishko MV. Nanoparticle-based biocompatible and targeted drug delivery: characterization and in vitro studies. Biomacromolecules 2011;12:3205–3212.
- Luo Y, Teng Z, Li Y, et al. Solid lipid nanoparticles for oral drug delivery: chitosan coating improves stability, controlled delivery, mucoadhesion and cellular uptake. Carbohydr Polym. 2015;122:221–229.
- Jain A, Thakur K, Sharma G, et al. Fabrication, characterization and cytotoxicity studies of ionically cross-linked docetaxel loaded chitosan nanoparticles . Carbohydr Polym. 2016;137:65–74.
- Martinez A, Iglesias I, Teijon JM, et al. Enhanced preclinical efficacy of tamoxifen developed as alginate-cysteine/disulfide bond reduced albumin nanoparticles . Int J Pharm. 2012;436:574–581.
- Zheng S, Xie Y, Li Y, et al. Development of high drug-loading nanomicelles targeting steroids to the brain. Int J Nanomed. 2013;9:55–66.
- Tian M, Chen X, Li H, et al. Long-term and oxidative-responsive alginate–deferoxamine conjugates with a low toxicity for iron overload. RSC Adv. 2016;6:32471–32479.
- Latifi AM, Nejad ES, Babavalian H. Comparison of extraction different methods of sodium alginate from brown alga Sargassum sp. localized in the southern of Iran. J Appl Biotechnol Rep. 2015;2:251–255.
- Sharma R, Ahuja M. Thiolated pectin: synthesis, characterization and evaluation as a mucoadhesive polymer. Carbohydr Polym. 2011;85:658–663.
- Hauptstein S, Muller C, Dunnhaupt S, et al. Preactivated thiomers: evaluation of gastroretentive minitablets. Int J Pharm. 2013;456:473–479.
- Kocak G, Tuncer C, Butun V. pH-Responsive polymers. Polym Chem. 2017;8:144–176.
- Wang Y, Liu D, Zheng Q, et al. Disulfide bond bridge insertion turns hydrophobic anticancer prodrugs into self-assembled nanomedicines. Nano Lett. 2014;14:5577–5583.
- Zhou J, Pishko MV, Lutkenhaus JL. Thermoresponsive layer-by-layer assemblies for nanoparticle- based drug delivery. Langmuir 2014;30:5903–5910.
- Ibie C, Knott R, Thompson CJ. In-vitro evaluation of the effect of polymer structure on uptake of novel polymer-insulin polyelectrolyte complexes by human epithelial cells. Int J Pharm. 2015;479:103–117.
- Gribova V, Auzely-Velty R, Picart C. Polyelectrolyte multilayer assemblies on materials surfaces: from cell adhesion to tissue engineering. Chem Mater. 2012;24:854–869.
- Guzmán E, Mateos-Maroto A, Ruano M, et al. Layer-by-Layer polyelectrolyte assemblies for encapsulation and release of active compounds. Adv Colloid Interface Sci. 2017;249:290–307.
- Ariga K, Lvov YM, Kawakami K, et al. Layer-by-layer self-assembled shells for drug delivery. Adv Drug Deliv Rev. 2011;63:762–771.
- Niraj, Srivastava VK, Singh N, et al. Sustained and controlled drug delivery system - as a part of modified release dosage form. Int J Pharma Sci. 2013;2:586–601.
- Liu XQ, Picart C. Layer-by-layer assemblies for cancer treatment and diagnosis. Adv Mater Weinheim. 2016;28:1295–1301.
- Han U, Seo Y, Hong J. Effect of pH on the structure and drug release profiles of layer-by- layer assembled films containing polyelectrolyte, micelles, and graphene oxide. Nat Publ Gr 2016;6:24158–24168.
- Tian J, Stella VJ. Degradation of paclitaxel and related compounds in aqueous solutions II : nonepimerization degradation under neutral to basic pH conditions. J Pharm Sci. 2008;97:3100–3108.
- Fox CB, Kim J, Le LV, et al. Micro/nanofabricated platforms for oral drug delivery. J Control Release. 2015;219:431–444.
- Shen Y, Chen J, Liu Q, et al. Effect of wheat germ agglutinin density on cellular uptake and toxicity of wheat germ agglutinin conjugated PEG-PLA nanoparticles in Calu-3 cells. Int J Pharm. 2011;413:184–193.
- Au L, Zhang Q, Cobley CM, et al. Quantifying the cellular uptake of antibody-conjugated Au nanocages by two-photon microscopy and inductively coupled plasma mass spectrometry. ACS Nano. 2010;4:35–42.
- Banerjee S, Sen K, Pal TK, et al. Poly(styrene-co-maleic acid)-based pH-sensitive liposomes mediate cytosolic delivery of drugs for enhanced cancer chemotherapy. Int J Pharm. 2012;436:786–797.
- Nguyen HN, Thi MNH, Ha PT, et al. Curcumin as fluorescent probe for directly monitoring in vitro uptake of curcumin combined paclitaxel loaded PLA-TPGS nanoparticles. Adv Nat Sci. Nanosci Nanotechnol. 2016;7:1–6.