
 ?Mathematical formulae have been encoded as MathML and are displayed in this HTML version using MathJax in order to improve their display. Uncheck the box to turn MathJax off. This feature requires Javascript. Click on a formula to zoom.
Abstract
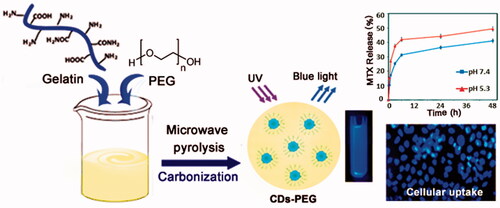
A green and simple process for preparing the polyethylene glycol passivated fluorescent carbon dots (CDs-PEG) have been studied by a microwave pyrolysis method, using gelatin and PEG as starting materials. This method is very effective for development of carbon-based quantum dots from gelatin with high quantum yield (QY). The synthesized CDs-PEG were found to emit blue photoluminescence (PL) with a maximum QY of 34%. At the following research, we investigated the effect of the presence of PEG on PL intensity, and the result showed that CDs-PEG becomes stronger PL properties than pure CDs from gelatin. The synthesized CDs-PEG were characterized by FTIR, TEM, UV–vis, PL, zeta potential and XRD analyses. The anticancer performance of developed CDs-PEG was evaluated by in vitro tests such as MTT assay and fluorescence microscopy analyses. The examination of CDs-PEG as an anti-cancer drug nanocarrier for methotrexate (MTX) illustrated a better antitumor efficacy than free MTX due to its enhanced nuclear delivery in vitro, which resulting in highly effective tumour growth inhibition and improving targeted cancer therapy in clinical medicine.
Graphical Abstract
Introduction
Fluorescent carbon dots (CDs), as one of the most promising carbon nanomaterials, have gained an impressive interest due to their unique optical and electronic properties [Citation1–5]. In comparison with traditional organic dyes and inorganic quantum dots (QDs), CDs are more superior due to a) biocompatibility, b) low toxicity, c) chemical solubility, d) aqueous solubility and e) easy surface modification [Citation6–8]. Their unique properties are being used in various applications including catalysts, optoelectronic devices, bioimaging, biosensing and drug delivery [Citation9–12]. Biocompatible and highly nontoxic fluorescent CDs are generally obtained from synthetic or natural polymeric materials [Citation13]. Among natural polymers, gelatin due to its good pharmacological characteristics (as excellent biocompatibility and degradability to non-toxic products) and low cost, could be an excellent candidate for the synthesis of CDs [Citation14,Citation15]. Commonly techniques have been used to synthesis CDs to include electrochemical synthesis [Citation16,Citation17], chemical oxidation [Citation18], laser ablation of graphite [Citation19], ultrasonic methods [Citation20], hydrothermal [Citation21,Citation22], solvothermal [Citation23] and microwave-assisted pyrolysis [Citation24,Citation25]. However, most of these techniques may involve a) complex reactions, b) time-consuming processes, c) post-treatment procedures and d) an expensive carbon source, which limit the applications of CDs. So, the facile, rapid and environmentally friendly viable synthetic ways for the production of high-quality fluorescent CDs are in high demand. The microwave-assisted method was an effective way for obtained nanoparticles (NPs) [Citation26–29]. Among these conventional methods, the microwave mediated synthesis indications many preferable benefits, such as rapid reaction rate, controllable conditions and non-hazardous [Citation30]. However, the microwave irradiation generally produces CDs with lower quantum yields (QY). Thus, to overcome this disadvantage, surface passivation scheme has been used to increase the fluorescence properties of CDs and also to make them appropriate for biological applications [Citation31]. Among the various organic molecules served as a CDs surface passivation, polyethylene glycol (PEG) has been more concerned, due to excellent biocompatibility, non-toxicity and hydrophilic properties [Citation32–36]. Conjugating PEG onto the surface of CDs (PEGylation) would be an ideal approach to improving the biocompatibility and avoid recognition and clearance of the CDs by the reticuloendothelial system (RES) which increases the circulation halftime of CDs [Citation37,Citation38]. Methotrexate (MTX) has been one of the most commonly applied therapeutic agents in the treatment of lymphomas, breast cancer, choriocarcinoma and lung cancer. MTX is capable to enter cells via a similar transportation system to folic acid (FA), due to the structural similarity of MTX with FA and presence of FA receptor as targeting ligand on the surface of the cancer cells [Citation39,Citation40]. In this study, the polyethylene glycol passivated CD (CDs-PEG) with stronger optical-absorbing ability were synthesized by economical and facile microwave pyrolysis method using gelatin as the carbon source and PEG as the passivator. Then, the CDs-PEG was loaded with MTX, to prepare the MTX/CDs-PEG complexes as an efficient drug delivery nanosystem. The obtained MTX/CDs-PEG were thoroughly characterized by various microscopic and spectroscopic techniques. Finally, the biocompatibility and cytotoxicity effects of the developed nanocarrier were carried out via the evaluating survival rate of human breast epithelial adenocarcinoma cell line (MCF-7) by the MTT assay.
Experimental
Materials and method
Gelatin and PEG-4000 (PEG-4000) were purchased from Merck (Darmstadt, Germany), deionized water was used in all of the experiments where required. UV–vis absorption of the aqueous solutions of CDs-PEG was recorded using a UV-2550 UV–vis spectrophotometer (Shimadzu, Kyoto, Japan). The photoluminescence (PL) emission measurements were recorded using a fluorescence spectrofluorometric, LS45 (PerkinElmer, Waltham, MA). Transmission electron microscope (TEM) image was captured by a CM120 Philips (Magdeburg, Germany) with an accelerating voltage of 100 kV. The surface groups on CDs-PEG were determined with a Fourier transform infrared (FT-IR) spectrometer, Model Tensor 27 (Bruker Instruments, Karlsruhe, Germany) using KBr pellets. The crystal structure of CDs was determined by X-ray diffraction, D-500 XRD (Siemens, Munich, Germany) using Cu-Kα radiation at 35 kV. The average diameter and zeta potentials of the NPs were determined by photo-correlation spectroscopy (Zetasizer ZS, Malvern Instruments, Malvern, UK). The microwave-assisted carbonization reaction was done in a microwave oven with a tunable output power ranging from 100 to 900 W and a 2450-MHz microwave frequency, 1250 W, NN-SD797S Genius (Panasonic, Kadoma, Japan). The QY was calculated by the previously established method [Citation6].
Preparation of CDs-PEG
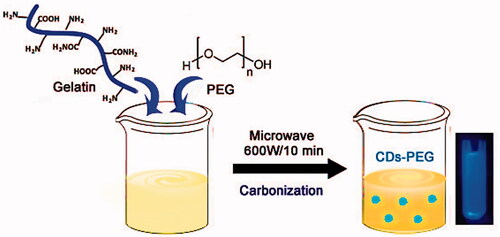
As presented in Scheme 1, in a typical process the CDs-PEG was prepared as follows: an adequate amount of gelatin was diluted with MiliQ water to form an aqueous solution, then PEG was added under stirring. After stirring for 30 min, the mixture was heated for 10 min under 600 W microwave oven. With time, the colour of the solution gradually changed from light yellow to dark yellow. The colour-changed solution was centrifuged at 12,000 rpm for 15 min to eliminate the less-fluorescent deposit. The purified CDs-PEG solution was maintained at 4 °C until needed for further experimentation. The QY of the CDs-PEG was calculated about ∼34%, which was higher than the pure CDs at similar excitation wavelengths.
Scheme 1. A schematic illustration of the preparation procedure of PEG passivated carbon dots (CDs-PEG) through microwave carbonization.
QY measurements
The QY of the CDs-PEG has been calculated using the following formula. Quinine sulphate (QS) was chosen as a reference to determine QY. QS (QY is 0.54) was dissolved in 0.1 M H2SO4 and the CDs-PEG were dissolved in distilled water (η = 1.33).where φ, I, A and η are the QY, measured integrated emission intensity, absorbance and refractive index of the solvent, respectively. The subscript S and R refers to the sample and reference fluorophore of known QY, respectively.
MTX-loading and release
For MTX/CDs-PEG complex formation, 1 mL of the prepared CDs-PEG solution (10 mg mL−1) and 1 mL of MTX solution (1 mg mL−1) were mixed with 2 mL PBS at pH 7.4 under stirring. This solution was then allowed to react for 24 h under dark conditions at ambient temperature. The resultant solution was dialysed using a dialysis membrane (molecular weight cut off 12000 Da) against 20 mL deionized water for 2 h to eliminate any unreacted MTX or CDs. Subsequently, the percentages of loading capacity (LC) and encapsulation efficiency (EE) were calculated using the following formulas, respectively:
The pH-dependent MTX release in vitro experiment was carried out in dark conditions, under stirring at 200 rpm at 24 °C. Briefly, 2 mL aliquots of the MTX/CDs-PEG solution were dialysed using a dialysis bag (molecular weight cut off 12,000 Da) against 20 mL of PBS, in both simulated tumour tissue (pH 5.3, 41 °C) and normal physiological (pH 7.4, 37 °C) conditions. After certain time intervals, adequate amounts of the PBS solutions were removed and the concentration of released MTX was evaluated using UV–vis spectroscopy. The percent of the drug released was calculated by the following formula:
In vitro cell cytotoxicity
The cytotoxicity and biocompatibility of the CDs were assessed against the MCF-7 cell line by comparing the CDs-PEG (without MTX), free MTX and MTX/CDs-PEG with MTT assay. Briefly, the cells were seeded into a 96-well plate at a density of 2 × 10⁴ cells per well and incubated for 24 h at 37 °C under the humidified atmosphere with 5% CO2. Then, the culture medium was removed and 200 mL of growth medium with various concentrations of the free MTX, MTX/CDs-PEG and CDs-PEG was replaced to each well and incubated for 24 and 48 h. Then, the MTT solution (5 mg.mL−1) was added to the wells and stored for an additional 4 h. After aspiration of the medium, MTT-formation was dissolved in 200 μL of DMSO, and the optical density (OD) values were measured at 570 nm using a microplate reader, Elx808 (Biotek, Winooski, VT).
In vitro cell imaging studies
The fluorescence imaging of cells treated with MTX/CDs-PEG was performed by an inverted fluorescence microscope, Bh2-RFCA (Olympus Corporation, Tokyo, Japan). The cells were seeded onto glass coverslips in 6-well plates and cultured in RPMI 1640 medium. After 24 h, the medium was discarded and the seeded cells were washed with PBS buffer. Then, the cells were treated with 2 mL of MTX/CDs-PEG (50 µg . mL−1) for 3 h. After that, the coverslips were put onto the glass microscope slides and the fluorescent images were captured from stained cells.
Results and discussion
Characterization of CDs-PEG
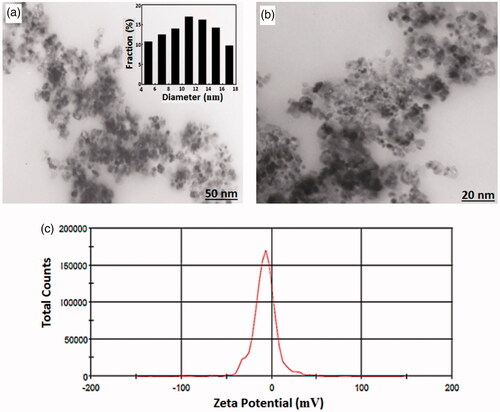
As shown in , FT-IR spectra of the MTX, CDs-PEG and MTX/CDs-PEG have revealed many common characteristics peaks. The most important peaks in the FTIR spectrum of the CDs-PEG can be listed as the stretching vibrations of C=H at 2938 and 2864 cm−1, the stretching vibration of C=O at 1742 cm−1, asymmetric and symmetric stretching vibrations of C=O=C at 1244 and 1162 cm−1, respectively, and the stretching vibration of N=H and O=H bands at around 3430 cm−1. The successful synthesis of CDs with PEG passivation is confirmed by the appearance of new IR peaks around 1732, 1465, 1353 and 1286 cm−1, which attributed to the presence of amide groups. The stretching vibration of C=H and C=O=C groups in the PEG segment is exhibited by the strong absorption bands at around 1105 and 2900 cm−1, respectively [Citation41,Citation42]. The FTIR spectrum of the MTX/CDs-PEG, revealed not only the characteristic bands of CDs-PEG but also the clear characteristic bands of MTX at around 1620 cm−1 (corresponded to the stretching vibrations of =CONH), around 1476–1694 cm−1 (corresponded to the stretching vibrations of aromatic pteridine ring and p-aminobenzoic acid) and at around 3415 cm−1 (corresponded to the N–H stretching vibrations of amine groups). These observations validated the presence of MTX in the product structure. The broad diffraction peak detected in the XRD pattern of CDs-PEG at 2θ = 21.5° representing to amorphous carbon phase in CDs () [Citation3]. The morphology and size of the CDs-PEG were evaluated by TEM and DLS analyses, respectively. The TEM images revealed that the CDs-PEG were well dispersed (without any aggregation) with regular spherical morphology and an average size of 6 nm (). Additionally, the DLS results of CDs-PEG showed a narrow size distribution around 10.6 nm. This distribution and the rather large size of spheres are representing to aggregation of smaller individual dots. The CDs showed the average ZP value of −7.54 mV (), which is characteristic of CDs. This observed result can be representing the presence of carboxyl and oxygen functional groups on the surface of CDs [Citation43].
Figure 1. Fourier transform infrared spectroscopy (FTIR) of the PEG passivated carbon dots (CDs-PEG), MTX loaded CDs-PEG (MTX/CDs-PEG) and free methotrexate (MTX) (a) and X-ray diffraction (XRD) pattern of the CDs-PEG (b).
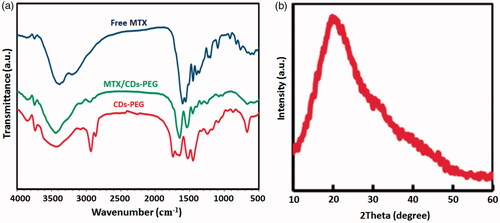
Figure 2. Transmission electron microscopy (TEM) images (inset shows the size distribution) (a,b) and Zeta potential of the CDs-PEG (c).
Spectral characterization of CDs-PEG
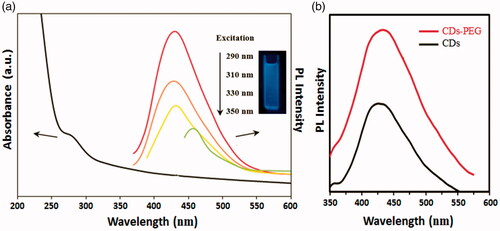
displays the UV–vis absorption and PL spectra of the CDs-PEG. The absorption spectrum showed a characteristic weak absorption peak at 290 nm. When it was excited at 290 nm, the PL spectra exhibited a peak position at 430 nm. In addition, the PL emission of the CDs-PEG is intensely dependent on the excitation wavelength, regularly decreased with the increasing of excitation wavelength. Such an observation is similar to that of QDs, which may be representing the optical selectivity of variously sized NPs (the quantum effect) or various emissive traps on the CDs surface. Moreover, abundant functional groups such as amines and carboxyl acids, which are presented simultaneously during the microwave pyrolysis, may introduce different defects onto the surface of CDs, acting as excitation energy traps and leading to different PL properties [Citation3]. The QY of CDs-PEG solution was calculated at around 34% using QS as a reference. In a parallel control experiment, if the PEG passivation was eliminated, a similar colour change and UV–vis absorption spectrum were detected. However, these non-passivated NPs presented a poor luminescence emission spectrum (). It should be pointed out that the polymeric passivation agent contains no visible or near-UV chromophores and so no emission should be gained at visible wavelengths. Therefore the observed colourful luminescence emission may be owing to the surface-passivated NPs [Citation7].
Figure 3. UV–vis absorption spectra and excitation-dependent photoluminescence (PL) spectra of the PEG passivated carbon dots (CDs-PEG) (a) and the PL spectra of the CDs with and without the adding of PEG (b).
MTX loading and release studies
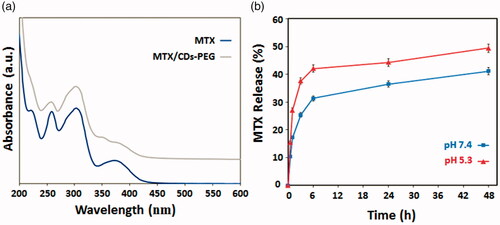
The developed nanocarrier was designed to be responsive to the alterations of the pH and temperature of the environment and MTX as a model anticancer drug was loaded in the nanocarrier. The LC and EE percentages of MTX in nanocarrier were calculated at around 32%. Since the weight of incubated drugs is equal to the nanocarrier weight, so it can be concluded that the LE and EE percentages are the same. As shown in , the states of MTX/CDs-PEG and MTX in solution are obviously detected from the UV–vis spectrum. The MTX solution strongly absorbs UV photons at the wavelengths of 260, 305 and 380 nm owing to the presence of heteroaromatic pterine chromophore. Compared with free MTX, the absorbance spectrum of MTX/CDs-PEG solution displays three shoulders at the mentioned wavelengths with a blue-shift (a slight shift to the right). So, these results proposed that CDs-PEG and MTX molecules formed the complex in the solution [Citation44,Citation45]. The above-mentioned presumption supported the FTIR spectrum in , in which it also exposes the strong loading of MTX onto CDs. The in–vitro pH- and temperature-dependent release behaviours of MTX from MTX/CDs-PEG was determined in PBS under normal physiological environment (pH 7.4, 37 °C) and simulated tumour tissue condition (pH 5.3, 41 °C) (). We detected the highest amount of release for MTX (49%) after 48 h at the cancerous tissue environment condition (pH 5.3) which showed that MTX/CDs-PEG complexes have the capability to selectively release in acidic environments. So, these results illustrated that the developed nanocarrier not only improved the site selectivity of the MTX release but also is favourable to prolonged drug release.
Figure 4. UV–vis absorption spectra of methotrexate (MTX) and MTX loaded PEG passivated carbon dots (MTX/CDs-PEG) (a) and cumulative in vitro release profiles of MTX from MTX/CDs-PEG (data are presented as mean ± standard deviation, n = 3) (b).
In vitro cytotoxicity study
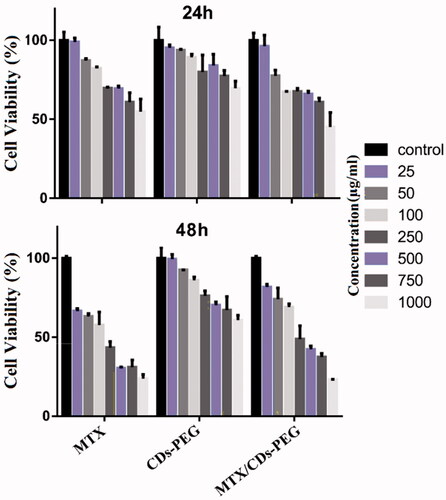
To evaluate the biocompatibility and pharmaceutical activity of CDs-PEG, MTX, MTX/CDs-PEG and MTT cell assay was performed against the MCF-7 cell line () [Citation46]. As the results were shown, the cell viability of nanocarrier was assessed and no noticeable cytotoxicity of blank nanocarrier in MCF-7 cell lines after 24 and 48 h, confirming that this nanocarrier presented good biocompatibility. By comparing the cytotoxicity results of the free form of MTX with MTX loaded CDs-PEG, MTX/CDs-PEG revealed higher cell cytotoxicity than free MTX after 24 and 48 h. As the concentration increased, the free MTX showed greater cytotoxicity. The main reason for this result was that the MTX release from MTX/CDs-PEG was more slowly than free MTX. The increased cell viability of MTX/CDs-PEG might be a result of the controlled release of MTX from MTX/CDs-PEG, so it was good news for us. As we know, the NPs have EPR effect, which makes tumour tissue enrich more NPs than other tissues. We supposed that MTX/CDs-PEG may reduce the side effects than free MTX, due to their small particle size and shielding effects.
Figure 5. The cell viability study of human breast epithelial adenocarcinoma (MCF-7) cell after incubation of methotrexate (MTX), PEG passivated carbon dots (CDs-PEG) and MTX loaded CDs-PEG (MTX/CDs-PEG) at various concentrations (µg/mL) for 24 and 48 h.
In vitro bioimaging study
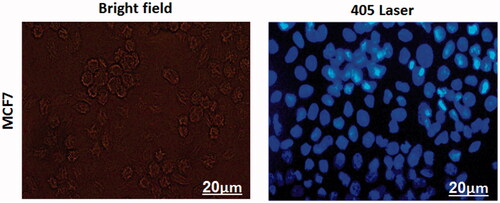
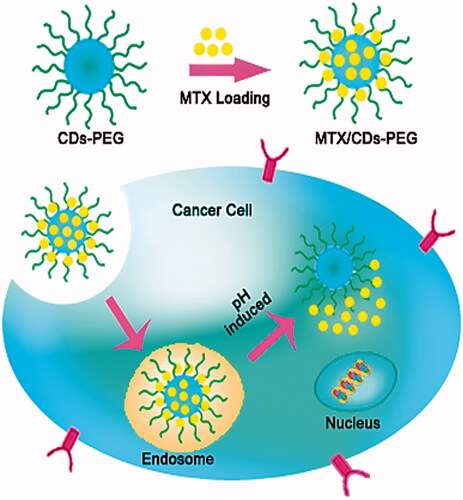
The bioimaging applications of the MTX loaded CDs-PEG was assessed based on the excellent fluorescence properties of the nanocarriers. As shown in , after the MTX/CDs-PEG was incubated with MCF-7 cells for 3 h, the fluorescence image of the cells was taken by fluorescence microscope. Upon laser irradiation, the cells treated with MTX/CDs-PEG revealed strong blue fluorescent intensity, representing that the MTX/CDs-PEG have a potential for bioimaging applications. Clearly, an increase internalize drug-loaded nanocarrier into the cells was due to the presence of MTX on the surface of developed nanocarrier and the similar structure of MTX with FA which can act as a potential ligand for folate receptors. The mechanism of cellular uptake and capabilities of MTX/CDs-PEG for active drug delivery to the cancer tissues are shown in Scheme 2.
Figure 6. Fluorescence microscopy images of treated human breast epithelial adenocarcinoma (MCF-7) cells with the methotrexate (MTX) loaded developed nanocarrier under bright field and 405 nm excitation after 3 h (scale bar = 20 μm).
Scheme 2. Cell uptake mechanism and capabilities of developed nanocarrier for passive and active methotrexate (MTX) delivery to the cancerous tissue by human breast epithelial adenocarcinoma (MCF-7) cells.
Conclusions
This article describes a green, facile and novel process to synthesize the PEG passivated fluorescent carbon dots (CDs-PEG) by the microwave-assisted method to fabricate CDs-PEG without any further chemical modification. The as-synthesized CDs-PEG were found to emit strong blue emission with a maximum QY of 34%. The developed CDs-PEG showed an excellent fluorescence property, water solubility and good stability. These CDs did not impose any significant toxicity to cells and might have potential in more biomedical applications. The in vitro results indicated that MTX-loaded CDs-PEG possessed good biocompatibility, bioimaging function and anticancer effect.
Disclosure statement
No potential conflict of interest was reported by the authors.
Additional information
Funding
References
- Hassan M, Gomes VG, Dehghani A, et al. Engineering carbon quantum dots for photomediated theranostics. Nano Res. 2018;11:1–41.
- Liu J, Lu S, Tang Q, et al. One-step hydrothermal synthesis of photoluminescent carbon nanodots with selective antibacterial activity against Porphyromonas gingivalis. Nanoscale. 2017;9:7135–7142.
- Namdari P, Negahdari B, Eatemadi A. Synthesis, properties and biomedical applications of carbon-based quantum dots: an updated review. Biomed Pharmacother. 2017;87:209–222.
- Farshbaf M, Davaran S, Rahimi F, et al. Carbon quantum dots: recent progresses on synthesis, surface modification and applications. Artif Cells Nanomed Biotechnol. 2018;46:1331–1348.
- Joshi PN, Mathias A, Mishra A. Synthesis of ecofriendly fluorescent carbon dots and their biomedical and environmental applications. Mater Technol. 2018;33:672–680.
- Feng Z, Li Z, Zhang X, et al. Fluorescent carbon dots with two absorption bands: luminescence mechanism and ion detection. J Mater Sci. 2018;53:6459–6470.
- Wang Y, Cui Y, Zhao Y, et al. Fluorescent carbon dot-gated multifunctional mesoporous silica nanocarriers for redox/enzyme dual-responsive targeted and controlled drug delivery and real-time bioimaging. Eur J Pharm Biopharm. 2017;117:105–115.
- Kang EB, Lee GB, In I, et al. pH-sensitive fluorescent hyaluronic acid nanogels for tumor-targeting and controlled delivery of doxorubicin and nitric oxide. Eur Polym J. 2018;101:96–104.
- Shi W, Lv H, Yuan S, et al. Synergetic effect of carbon dots as co-catalyst for enhanced photocatalytic performance of methyl orange on ZnIn2S4 microspheres. Sep Purif Technol. 2017;174:282–289.
- Yang ST, Cao L, Luo PG, et al. Carbon dots for optical imaging in vivo. J Am Chem Soc. 2009;131:11308–11309.
- Qian J, Quan F, Zhao F, et al. Aconitic acid derived carbon dots: conjugated interaction for the detection of folic acid and fluorescence targeted imaging of folate receptor overexpressed cancer cells. Sens Actuators B: Chem. 2018;262:444–451.
- Li H, Yan X, Qiao S, et al. Yellow-emissive carbon dot-based optical sensing platforms: cell imaging and analytical applications for biocatalytic reactions. ACS Appl Mater Interfaces. 2018;10:7737–7744.
- Zhou Y, Sharma SK, Peng Z, et al. Polymers in carbon dots: a review. Polymers. 2017;9:67.
- Nejat H, Rabiee M, Varshochian R, et al. Preparation and characterization of cardamom extract-loaded gelatin nanoparticles as effective targeted drug delivery system to treat glioblastoma. React Funct Polym. 2017;120:46–56.
- Javanbakht S, Nezhad-Mokhtari P, Shaabani A, et al. Incorporating Cu-based metal-organic framework/drug nanohybrids into gelatin microsphere for ibuprofen oral delivery. Mater Sci Eng. 2019;96:302–309.
- Deng J, Lu Q, Mi N, et al. Electrochemical synthesis of carbon nanodots directly from alcohols. Chem Eur J. 2014;20:4993–4999.
- Wang CI, Wu WC, Periasamy AP, et al. Electrochemical synthesis of photoluminescent carbon nanodots from glycine for highly sensitive detection of hemoglobin. Green Chem. 2014;16:2509–2514.
- Dong Y, Pang H, Ren S, et al. Etching single-wall carbon nanotubes into green and yellow single-layer graphene quantum dots. Carbon. 2013;64:245–251.
- Hu SL, Niu KY, Sun J, et al. One-step synthesis of fluorescent carbon nanoparticles by laser irradiation. J Mater Chem. 2009;19:484–488.
- Zhang Y, Park M, Kim HY, et al. A facile ultrasonic-assisted fabrication of nitrogen-doped carbon dots/BiOBr up-conversion nanocomposites for visible light photocatalytic enhancements. Sci Rep. 2017;7:45086.
- Yang L, Jiang W, Qiu L, et al. One pot synthesis of highly luminescent polyethylene glycol anchored carbon dots functionalized with a nuclear localization signal peptide for cell nucleus imaging. Nanoscale. 2015;7:6104–6113.
- Zhang ZC, Ma QL, Li JL. Preparation of gold nanoparticles and carbon dots by hydrothermal reaction of bovine haemoglobin with chloroauric acid and energy band bending in carbon dots. J Exp Nanosci. 2017;12:239–246.
- Li M, Yu C, Hu C, et al. Solvothermal conversion of coal into nitrogen-doped carbon dots with singlet oxygen generation and high quantum yield. Chem Eng J. 2017;320:570–575.
- Choi Y, Thongsai N, Chae A, et al. Microwave-assisted synthesis of luminescent and biocompatible lysine-based carbon quantum dots. J Ind Eng Chem. 2017;47:329–335.
- Li H, Shao FQ, Zou SY, et al. Microwave-assisted synthesis of N, P-doped carbon dots for fluorescent cell imaging. Microchim Acta. 2016;183:821–826.
- Li LL, Ji J, Fei R, et al. A facile microwave avenue to electrochemiluminescent two‐color graphene quantum dots. Adv Funct Mater. 2012;22:2971–2979.
- Zhu S, Zhang J, Wang L, et al. A general route to make non-conjugated linear polymers luminescent. Chem Commun. 2012;48:10889–10891.
- Vanessa H, Wenshuo W, Cornelia D, et al. Microwave-assisted one-step synthesis of white light-emitting carbon dot suspensions. Opt Mater. 2018;80:110–119.
- Edison TNJI, Atchudan R, Sethuraman MG, et al. Microwave assisted green synthesis of fluorescent N-doped carbon dots: cytotoxicity and bio-imaging applications. J Photochem Photobiol B. 2016;161:154–161.
- Liu H, He Z, Jiang LP, et al. Microwave-assisted synthesis of wavelength-tunable photoluminescent carbon nanodots and their potential applications. ACS Appl Mater Interfaces. 2015;7:4913–4920.
- Tu X, Ma Y, Cao Y, et al. PEGylated carbon nanoparticles for efficient in vitro photothermal cancer therapy. J Mater Chem B. 2014;2:2184–2192.
- Fan RJ, Sun Q, Zhang L, et al. Photoluminescent carbon dots directly derived from polyethylene glycol and their application for cellular imaging. Carbon. 2014;71:87–93.
- Veronese FM, Pasut G. PEGylation, successful approach to drug delivery. Drug Discov Today. 2005;10:1451–1458.
- Shimizu T, Lila ASA, Fujita R, et al. A hydroxyl PEG version of PEGylated liposomes and its impact on anti-PEG IgM induction and on the accelerated clearance of PEGylated liposomes. Eur J Pharm Biopharm. 2018;127:142–149.
- Karakoti AS, Das S, Thevuthasan S, et al. PEGylated inorganic nanoparticles. Angew Chem Int Ed. 2011;50:1980–1994.
- Sachdev A, Matai I, Kumar SU, et al. A novel one-step synthesis of PEG passivated multicolour fluorescent carbon dots for potential biolabeling application. RSC Adv. 2013;3:16958–16961.
- Bunker A, Magarkar A, Viitala T. Rational design of liposomal drug delivery systems, a review: combined experimental and computational studies of lipid membranes, liposomes and their PEGylation. Biochim Biophys Acta. 2016;1858:2334–2352.
- Suk JS, Xu Q, Kim N, et al. PEGylation as a strategy for improving nanoparticle-based drug and gene delivery. Adv Drug Deliv Rev. 2016;99:28–51.
- Nezhad-Mokhtari P, Arsalani N, Ghorbani M, et al. Development of biocompatible fluorescent gelatin nanocarriers for cell imaging and anticancer drug targeting. J Mater Sci. 2018;53:10679–10691.
- Zhao J, Zhang X, Sun X, et al. Dual-functional lipid polymeric hybrid pH-responsive nanoparticles decorated with cell penetrating peptide and folate for therapy against rheumatoid arthritis. Eur J Pharm Biopharm. 2018;130:39–47.
- Shen J, Zhu Y, Yang X, et al. One-pot hydrothermal synthesis of graphene quantum dots surface-passivated by polyethylene glycol and their photoelectric conversion under near-infrared light. New J Chem. 2012;36:97–101.
- Ghorbani M, Hamishehkar H. Redox and pH-responsive gold nanoparticles as a new platform for simultaneous triple anti-cancer drugs targeting. Int J Pharm. 2017;520:126–138.
- Yuan Y, Guo B, Hao L, et al. Doxorubicin-loaded environmentally friendly carbon dots as a novel drug delivery system for nucleus targeted cancer therapy. Colloids Surf B. 2017;159:349–359.
- An J, Gou Y, Yang C, et al. Synthesis of a biocompatible gelatin functionalized graphene nanosheets and its application for drug delivery. Mater Sci Eng C. 2013;33:2827–2837.
- Khodadadei F, Safarian S, Ghanbari N. Methotrexate-loaded nitrogen-doped graphene quantum dots nanocarriers as an efficient anticancer drug delivery system. Mater Sci Eng C. 2017;79:280–285.
- Ghorbani M, Mahmoodzadeh F, Nezhad-Mokhtari P, et al. A novel polymeric micelle-decorated Fe3O4/Au core–shell nanoparticle for pH and reduction-responsive intracellular co-delivery of doxorubicin and 6-mercaptopurine [10.1039/C8NJ03310B]. New J Chem. 2018;42:18038–18049.