
 ?Mathematical formulae have been encoded as MathML and are displayed in this HTML version using MathJax in order to improve their display. Uncheck the box to turn MathJax off. This feature requires Javascript. Click on a formula to zoom.
Abstract
With the purpose of improving the water solubility and oral bioavailability, ursolic acid nanoparticles (UANs) were prepared by the emulsion solvent evaporation method, and the nanosuspension was freeze-dried into powder. The optimal conditions for preparing nanoparticles were screened out using single-factor experiment. Take advantage of the optimal conditions, UA nanoemulsion had mean particle size (MPS) of 69.7 ± 15.6 nm and polydispersity index value (PI) of 0.005. The MPS of UA nanosuspension was gained at 100.2 ± 12.1 nm (PI = 0.005), after the organic solvent was removed by rotary evaporator. Finally, UANs possessing an MPS of 157.5 ± 28.0 nm (PI = 0.005) and zeta potential of 20.33 ± 1.67 mV were obtained after freeze-dried. UANs were investigated using SEM, XRD, DSC, TGA and further explored their equilibrium solubility, dissolution rate, solvent residue analysis, cellular antioxidant activity and oral bioavailability. All the results above showed that UA in UANs was in the amorphous state. The result of solubility test figured that the equilibrium solubility of UANs was 13.48 times in simulated gastric fluid (SGF), 11.79 times in simulated intestinal fluid (SIF) and 23.99 times in deionized water than raw UA. Accordingly, the dissolution rate of UANs in SGF and SIF had an apparent enhancement. The oral bioavailability of UANs increased 2.68 times than raw UA. UANs improved antioxidant activity toward cells compared with raw UA, and EC50 of UANs reduced 37.5 times than raw UA. The residual contents of trichloromethane and ethanol were separated up to the mustard of the ICH limit for class III and class II solvents. The results above indicated that UANs possesses a value of application on enhancement oral bioavailability.
Introduction
Ursolic acid (UA) is a pentacyclic triterpenoid. It is widely distributed in nature, such as in the leaves and fruit of bearberry of Ericaceae, leaves of Paulownia tomentosa Steud of Scrophulariaceae and leaves of Ligustrum lucidum Ait of Oleaceae [Citation1]. UA is one of the active ingredients of many Chinese herbal medicines. Pharmacological studies have shown that UA has a wide range of pharmacological effects, for instance anti-hepatitis [Citation2],anti-bacterial [Citation3], anti-tumor [Citation4], anti-ulcer [Citation5], decreasing blood sugar effects [Citation6] and so on, still showing much less toxicity and adverse effect [Citation7]. So, UA has good development prospects. Although the effects of UA are remarkable, there has not been prescribed preparations clinically yet. The main reason for this is hydrophobic nature and poor membrane permeability of UA [Citation8]. The conditions are attracting more and more attention to explore, such as preparing self-microemulsifying [Citation9], liposome [Citation10], solid dispersion [Citation11], inclusion compound [Citation12] of UA, and these methods achieve certain effects. But these preparations still have some defects, which need high-level equipment and complex process. What is more, there is no significant elevation of the solubility and bioavailability by these ways.
The nanoparticle system has a great potential to enhance the new preparation of drugs, specific performance of increasing the pharmacodynamics, improving the stability and solubility of drugs, reducing its toxicity and maintaining sustained release function. The preparation methods of nanoparticles are divided into bottom-up method and top-down method [Citation13]. The bottom-up method is a method in which a poorly soluble drug is dissolved in a suitable organic solvent, and then injected into the aqueous phase, and the solubility of the drug in the system is reduced abruptly because of the effect of the anti-solvent, sequentially, obtaining nanosuspension. The other is top-down method, the drug is dispersed in the aqueous phase, and the coarse dispersion system involving the drug is prepared into micro-sized to nano-sized suspended particles by grinding and homogenizing [Citation14,Citation15]. In 2012, Yang and Sun prepared UANs by using super-critical anti-solvent process [Citation16], which achieved a mean particle size (MPS) of 139.4 ± 19.4 nm. Pi [Citation17] used the high-pressure homogenization method on UA nanocrystals in 2016 with an MPS of 291.7 ± 7.5 nm and also the 2.56 times increase in oral bioavailability of UA nanocrystals.
In the case of this study, making use of emulsion solvent evaporation (ESE) method to prepare UANs has not been delivered in literature until now. During the process of preparation of UANs, first of all, based on the MPS, single-factor experiment method could be usefully employed in ensuring optimize conditions. Also, the morphology of UANs powder obtained was presented by scanning electron microscope (SEM). X-ray diffraction (XRD), differential scanning calorimetry (DSC) and thermal gravimetric analysis (TGA) are used to estimate whether and how the UANs changes in surface chemical character and physical structure. In the end, equilibrium solubility study, dissolution test, cellular antioxidant activity in vitro and oral bioavailability in vivo were conducted on raw UA and UANS to make a comparison.
Materials and methods
Materials
UA (purity ≥98%) was purchased from Xi’an Baichuan Hi-Tech Industry Co., Ltd. (Xi’an, PR China). Foetal bovine serum was purchased from CLARK Bioscience LLC., San Diego, CA. Poloxamer 188 was obtained from Wuhan Yuancheng Chemical Co., Ltd. (Wuhan, PR China). 2,7-Dichlorofluorescin diacetate (DCFH-DA), 2,2′-Azobis (2-amidinopropane) dihydrochloride (AAPH), glucose, ethanol, trichloromethane, methanol, acetonitrile, hydrochloric acid, KH2PO4, NaOH, and glutamine were purchased from Sigma-Aldrich Co. LLC. (St. Louis, MO). Among them, methanol and acetonitrile were of high-performance liquid chromatography grade.
UANs preparation
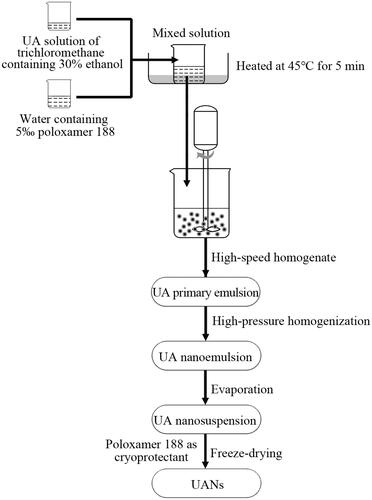
ESE method is used to prepare UANs that is accompanied by freeze-drying. The preparation of UANs is illustrated in . Briefly, accurately raw UA powders were weighed, and then added to trichloromethane containing 30% (v/v) ethanol, the final concentration was 6 mg ml−1. Transfer the solution to a beaker filled with deionized water involving a certain proportion of poloxamer 188. After that, put the mixed solution in 45 ± 0.5 °C water bath and heated for 5 min. Then the obtained drug solution was intensively stirred by an Adjustable High-Speed Homogenizer Stirrer (Guichi Technology Co., Ltd., Shenzhen, China) at room temperature. Following that, using a high-pressure nano homogenize equipment (AH-100D, ATS Engineering Inc., Brampton, Canada) to homogenize the desired UA primary emulsion, achieving the nanoemulsion. Next step was to remove the organic phase with a rotary evaporator at 55 °C (RE301, Xi’an Antai Instrument Technology Co., Ltd., Xi’an, China). The obtained nanosuspension was freeze-dried into powder using a vacuum freeze dryer (LGJ-10, Beijing Songyuan Huaxing Biotechnology Co., Ltd., Beijing, China) at −50 °C for 72 h with poloxamer 188 as cryoprotectant, whose amount is four times as the amount of UA. The desired UANs were successfully prepared. What is more, according to the proportion of the raw UA and the excipient in the UANs, we prepared the physical mixture of raw UA and excipient (MIX-UA). Using a comparison task between raw UA and MIX-UA in characterization and equilibrium solubility, verified the impacts of excipient improvement the particle size and solubility.
Figure 1. Diagram of the experimental processes.
Optimization of the preparation process
In the preliminary experiment, the proportion of trichloromethane to ethanol was confirmed by some trails on account of the solubility of raw UA in several organic phases. Based on the result, we choose the mixed solvent of 30% ethanol and 70% trichloromethane as the organic solvent. According to the preliminary experiment, the following six main parameters having significant influences on particle size were picked out, included the concentration of poloxamer 188, volume ratio of organic to water phase, homogenate speed and homogenate time, besides homogenization pressure and cycles. The concentration of poloxamer 188 was ranged from 0.5 to 6 ‰. The volume ratios of organic to water phase was from 1:2 to 1:8. The homogenate speeds tested ranged from 5000 to 11,000 rpm, and the homogenate time ranged from 0.5 to 10 min. The homogenization pressures increased from 200 to 800 bar. Set up the homogenization cycles from 2 to 14 times. All corresponding parameters value and MPS are shown in .
Table 1. Corresponding parameters and mean particle size in single-factor method.
Characterization of UANs
Morphology
SEM was used to evaluate the morphology of samples (Quanta 200, FEI, The Netherlands). The measured samples were deposited on the aluminium stubs, respectively. Also, the samples were sputter coated with a thin layer of gold on the surface as a reflecting layer.
MPS and zeta potential (ZP) analysis
The MPS and ZP of the achieved suspensions and nanoparticles were performed by Dynamic light scattering technique (ZetaPALS, Brookhaven, NY). UANs powder were dispersed definitely in deionized water before detected, then UA nanosuspension and UANs were added to the sample cell. All steps were repeated in triplicate, and the result was derived from the average of three dates.
XRD analysis
The use of XRD patterns ensures the crystal forms of raw UA, UANs, MIX-UA and poloxamer 188, which were recorded to employ a Cu target tube. The XRD patterns were collected at 30 mA and 40 kV by an X-ray diffractometer (Philips, Xper t-Pro, Amsterdam, The Netherlands), and XRD analysis was done at a scanning speed of 5° min−1. The samples were continuously scanned ranging from 5 to 60° with a step size of 0.02°.
DSC analysis
DSC (TA Instruments, DSC 204, New Castle, DE) was operated on raw UA, UANs, MIX-UA and poloxamer 188. Every sample (5 mg) was heated in aluminium pool at a scanning rate of 10 °C min−1 from 50 to 300 °C at N2 atmosphere.
Thermogravimetric analyzer (TGA) analysis
A thermogravimetric analyzer (Diamond TG/DTA, Waltham, MA) was used to characterize the thermal stability of raw UA, UANs, MIX-UA and poloxamer 188 obtained under N2 atmosphere. Detection was carried out at a heating rate of 10 °C min−1. Approximately, 5 mg of samples were heated from 50 to 600 °C.
Residual solvent determination
The residual amounts of trichloromethane and ethanol in the UANs were separated on capillary column (30.0 m × 250 mm × 0.25 mm, nominal) using an Agilent 7890 A gas chromatograph (Agilent, Santa Clara, CA) with a G1540N-210 FID detector. About 50 mg of UANs were dissolved in 0.5 ml of dioxane under the condition of ultrasonic for 30 s, and then centrifuging at 10,000 g for 5 min. We could obtain quantitative data through peaks areas. The detecting conditions were the following: the initial temperature of oven was 40 °C (10 min of equilibrium time), and heated at 4 °C min−1, the temperature was up to 90 °C where it was kept for 4 min, following the heating rate was set at 20 °C min−1, until the temperature was 210 °C and maintained for 4 min at last. The temperatures of injector and the detector were adjusted to 200 °C and 250 °C, respectively. High-purity nitrogen carrier gas was flown at 25 ml min−1. When all was in order, we used the split mode to analyse. About 2 µL samples were injected manually, and the split ratio of H2 and air was 20:1 with a flow rate of 30 and 400 ml min−1 separately.
HPLC condition
The HPLC condition was described by Huang [Citation18] with some adjustment. The drug concentration was performed by a Waters HPLC at 216 nm. The LC system was Waters HPLC (Waters Corporation, Milford, MA) equipped with a UV detector (Waters 2478 Tunable Absorbance Detector) and HPLC pump (Waters 1525 binary). The analytical column employed was DIKMA Diamonsil C18 column (5 mm × 4.6 mm × 150 mm). Temperature was thermostatically controlled at 30 °C with a flow rate of 1.0 ml min−1. The mobile phase consisted of 93% acetonitrile and 7% deionized water containing 0.5% glacial acetic acid.
Equilibrium solubility analysis
The method on raw UA, UANs and MIX-UA adopted the USP apparatus (II) paddle technique [Citation19]. Simulated gastric fluid (SGF) and simulated intestinal fluid (SIF) were chosen as solvents. SGF was compounded by 1000 ml acidized water (5 ml 37% hydrochloric acid) [Citation20], SIF was made up by 6.8 g l−1 KH2PO4, adjusted to pH 6.8 by NaOH and deionized water [Citation21,Citation22], both of them were without enzymes. Raw UA (15 mg), UANs (15 mg) and MIX-UA (15 mg) were added to 3 ml SGF, SIF and deionized water for 48 h, respectively. The stirring speed was 100 r/min maintaining at 37.0 ± 0.5 °C. About 1 ml samples were removed from three vials, respectively, after 48 h and centrifuged at 10,000 g for 10 min, the supernatant was diluted with equivalent ethanol. And then they were vortexed for 30 s and under an ultrasonic bath for 5 min to adequately mix. The solutions were passed through 0.22 μm filters prior to injecting into the HPLC system to assay for the concentration of UA. The experiment was repeated three times.
Dissolution rate analysis
The dissolution rate of raw UA, UANs was evaluated by using dialysis diffusion technique [Citation23]. The beakers were placed in thermostatic water bath at 100 rpm, 37.0 ± 0.5 °C. Dissolution medium was SGF and SIF. Raw UA (3.2 mg in SGF; 6.3 mg in SIF) and UANs (16.7 mg in SGF; 33.3 mg in SIF) containing an equal amount of UA were, respectively, dropped in the same four dialysis bags, and they were hermetically sealed and enclosed in the 5 ml dissolution medium, then bags were put into homologous dissolution medium (250 ml). At predetermined time intervals of 15, 30, 60, 90, 120,180, 240, 360, 480, 720, and 1440 min, 1 ml samples were removed from dissolution medium, then supplemented with the same volume of dissolution medium immediately to maintain a constant volume. The samples were diluted with equivalent ethanol. The solutions were vortexed for 30 s and under an ultrasonic bath for 5 min to adequately mix. And then they were centrifuged at 10,000 g for 10 min. The supernatant were analyzed by HPLC and assayed the UA concentration. The analysis conditions were identical to 2.4.8. The experiment was conducted in triplicate.
In vitro antioxidant experiment
Cell culture
The HepG2 cells were obtained from the Cell Bank of Type Culture Collection of the Chinese Academy of Sciences (Shanghai, China). The cells were grown in medium (DMEM containing 4 mM L-glutamine, 4.5 g l−1 glucose, 10% foetal bovine serum) and were maintained at 37 °C under a 5% CO2, and the medium was changed every 2 d.
Cellular antioxidant activity (CAA) experiment
In vitro cellular antioxidant activity assay was performed by adopting cell model established by Liu et al. [Citation24,Citation25]. The main principles are as follows: DCFH-DA is as fluorescent probe, and it is loaded into HepG2 cells. When AAPH enter the cells, the living radical will be generated, and DCFH-DA is oxidized to DCF which has green fluorescent. The fluorescence intensity is detected by fluorescence microplate (BioTek, Vermont, VT).
Therefore, the exponential growth-phase HepG2 cells were counted and seeded in 96-well culture plates. The cell density was up to 6 × 10⁴ in every well under the condition of adding 100 µl medium. After cultured in a 5% CO2 incubator at 37 °C for 24 h, the medium was removed and cleaned each well using the saline. Following, different qualities of raw UA and UANs were dispersed into 1 ml DCFH-DA (25 µ mol ml−1), respectively, the concentration gradient of raw UA was 1.5, 3, 6, 9 and 12 mg ml−1, the concentration gradient of UA in UANs is 0.05, 0.1, 0.2, 0.4 and 0.8 mg ml−1, in turn. Also, 100 µl of sample was added into the well. Besides, the control group and the blank group only added DCFH-DA and did not add samples. All of the above samples were provided with five parallel wells. The cells continued to be cultured in a 5% CO2 incubator at 37 °C for 1 h. Next, removed the drugs and DCFH-DA and rinsed every well using saline. About 100 µl of AAPH (1 m mol mL−1) was joined to each well of the sample group and the control group. The 96-well plate was placed on the fluorescence microplate for scanning. The detecting condition was as follows: the excitation wavelength was 485 nm, the emission wavelength was 538 nm, and the measurement was conducted every 5 min, test lasted for 1 h.
Calculation of CAA
To calculate the integral area of the curve of cell fluorescence intensity and time using Origin 8.0, the CAA evaluation method of references was used. CAA was computed on the basis of the following formula: CAA = (1-/
)×100.
Among the formula, represented the integral area of the curve of cell fluorescence intensity after drug disposing and time,
represented the integral area of the curve of control group cell fluorescence intensity and time.
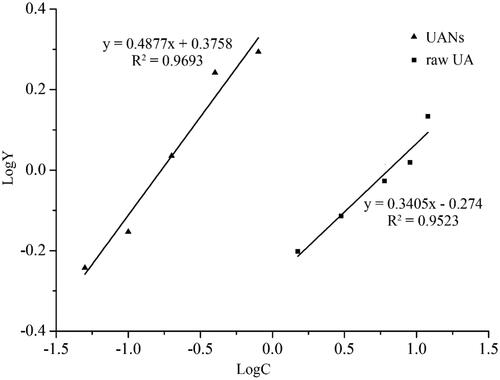
Medium effective concentration (EC50) defined, when the free radicals were effectively removed reaching 50%, the corresponding molarity of antioxidants. EC50 was confirmed by the linear relationship of logY and logC. In this experiment, EC50 of UA was calculated by transforming into the equation with CAA. So, Y defined that Y = CAA/(100 − CAA).
Oral bioavailability study
Animals and treatment
In this study, 12 Sprague–Dawley female rats weighing 220–250 g were obtained from Harbin Medical University (Harbin, Heilongjiang, PR China). All animals were randomly divided into two groups of six rats each. Prior to the experiment, animals were housed in a room with proper temperature (22 ± 1 °C), humidity (60 ± 5%), and light, and with free access to food and water. After acclimatization for at least 1 week, the rats could be administrated drugs. Fasting for 12 h before administration, but the animals can drink freely. The operations on animals conformed to the provisions of Laboratory Animal Administration ordinance, and all experiments on rats were reviewed and approved by the ethics committee of the Harbin Medical University.
Raw UA and UANs were dispersed into 6 ml deionized water, each rat was administered 1 ml using lavage needle. Two groups of female rats (n = 6) were administered at the same oral dose of 100 mg kg−1. Blood samples from retro-orbital sinus were collected immediately, the time points for taking samples of blood were at 15, 30, 60, 90, 120, 180, 240, 360, 480, 720 and 1440 min after oral administration. The plasma was separated by centrifuged at 3000 g for 10 min immediately and obtained serum were flash frozen at –40 °C until analysis.
Preparation of plasma sample
The steps of extracting UA from plasma protein are as follows: a volume 100 µL plasma sample was extracted by 1 ml ethyl acetate. Subsequently, the tube was vortexed for 3 min and placed into an ultrasonic bath for 5 min, centrifuged at 10,000 g for 10 min, 800 µL of the supernatant was carefully transferred to another neat tube and evaporated at 40 °C under nitrogen flow. The residue was redissolved by 100 µl methyl alcohol, vortex-mixed for 3 min and ultrasonic treatment for 5 min, then centrifuged at 10,000 g for 10 min, an aliquot of 10 µL supernatant was injected into HPLC analysis. The analysis conditions had been described above. The oral bioavailability of UA is presented by the area under the plasma concentration–time curve (AUC) and relevant pharmacokinetic parameters were confirmed by using Drug and Statistics ver2.0.
Results and discussion
Optimization result
Improving the oral bioavailability of drugs could be by means of reducing the particle size of drug powder [Citation26]. So particle size can be used as the basis for optimization experiment. Through the preliminary experiments, we screened out six factors having significant influences on the MPS of UA emulsions to implement single factor experiment: the concentration of poloxamer 188; volume ratio of organic to water phase; homogenate speed and time besides homogenization pressure and cycles. The results were determined by the average of the three trials.
Concentration of poloxamer 188
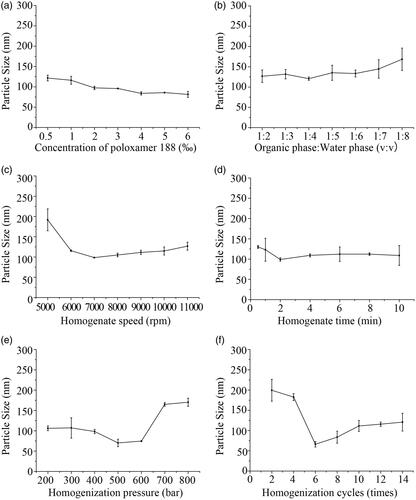
What to be considered at first was the concentration of surfactant in aqueous phase. Based on the preliminary experiment, poloxamer 188 was the best choose to be surfactant. Not only because poloxamer 188 is a kind of materials, which is non-toxic and non-irritant to body [Citation27]. It can stabilize the UANs and prevent reunion phenomenon. Poloxamer 188’s LD50 (rat, oral) is 9.4 g kg−1 in the acute animal toxicity experiments [Citation28]. demonstrates the impact of the concentration of poloxamer 188 on MPS. In the course of the concentration of poloxamer 188 increased from 0.5 ‰ to 6 ‰, the MPS reduces with the increase of volume ratio of surfactant subsequently. However, the MPS of UA emulsions decreased from 121.7 ± 7.0 to 81.4 ± 7.5 nm slightly. With a variation of the concentration of poloxamer188, there is no significant change on the MPS and the count is much small. So, to reduce the amount of excipients, the optimum volume ratio of poloxamer 188 was selected to be 0.5 ‰ when the yield was considered.
Figure 2. Effect of six main factors on the MPS of UA emulsions. (a) Concentration of poloxamer 188; (b) the volume ratio of organic to water phase; (c) homogenate speed; (d) homogenate time; (e) homogenization pressure; (f) homogenization cycles.
Ratio of organic to water phase
The effect of volume ratio of organic to water phase is shows in . The ratios were tested to be in the range of 1:2–1:8. As shown in the figure, the MPS of UA emulsions had little change with the reducing volume ratio of organic to water phase from 1:2 to 1:4, then the MPS increased as the decrease of volume ratio of organic to water phase from 120.7 ± 4.2 to 168.6 ± 27.51 nm. Therefore, the optimal volume ratio of organic to water phase was determined at 1:4.
Homogenate speed and time
From , it can be clearly seen that when the homogenate speed increase from 5000 rpm to 7000 rpm, the MPS of UA emulsions decreased significantly from 191.8 ± 27.0 to 98.7 ± 0.9 nm. When the homogenate speeds were tuned from 8000 rpm to 11,000 rpm, the MPS began to increase gradually. Under the homogenate speed was 7000 rpm, the two phases can be adequately mixed up. Finally, 7000 rpm was selected as the optimal homogenate speed.
shows the range of 0.5–10 min to explore the effect of homogenate time. It can be noted that the MPS decreased significantly from 130.0 ± 3.7 to 99.0 ± 4.2 nm with the homogenate time increasing from 0.5 to 2 min. Following the homogenate time extended to 10 min, the MPS started to grow. It is said that a longer time was not useful, because it may destroy the stability between emulsion droplets at a certain extent, leading to the increase in the particle size [Citation29]. Ultimately, 2 min of homogenate time was selected as optimum.
Homogenization pressure and cycles
After high-speed homogenate, the particles diameter of UA emulsions had been small, but as a whole, it was not uniform. Homogenization can make the UA emulsions turn to stable and uniform [Citation30]. According to the optimal conditions obtained above, samples were prepared to examine the optimum of homogenization pressure and cycles on MPS. As it is shown in , we investigated homogenization pressures from 200 to 800 bar. With the homogenization pressure increasing from 200 to 500 bar, the MPS of UA emulsions fluctuated between 106.2 ± 5.9 and 70.2 ± 9.2 nm. The increase of homogenization pressure had benefits on enhancing the stability of UA primary emulsion and preventing the agglomeration of droplets. Since the homogenization pressure exceeded 500 bar, the MPS became larger by degrees. Therefore, when the homogenization pressure was excessive, emulsion droplets would be damaged [Citation31]. Finally, 500 bar was proved as the optimal homogenization pressure.
To explore the effect of homogenization cycles on the MPS, the cycles of 2–14 times were controlled to prepare UA emulsions. In , it indicated that the MPS of UA emulsions decreased from 199.4 ± 26.9 to 66.2 ± 6.6 nm as the homogenization cycles increased from 2 to 6 times, the MPS of UA emulsions increased as homogenization cycles were in excess of six times. It can be seen that long-time homogenization did not have a significant effect on acquiring smaller particle of UA emulsions. Ultimately, six times were determined as the optimal number for preparation the UANs.
Validation of the optimal conditions
Based on the optimal conditions: poloxamer 188 concentration (0.5 ‰), volume ratio of organic to water phase (1:4), homogenate speed (7000 rpm), homogenate time (2 min), homogenization pressure (500 bar) and times (6), which we obtained by using single-factor experiments. UA nanoemulsions were prepared with MPS of 69.7 ± 15.6 nm (PI = 0.005). The solvent of UA nanosuspension was removed by rotary evaporation, and then the MPS became 100.2 ± 12.1 nm (PI = 0.005). The MPS increased after rotary evaporation, which was most likely that the UA of nanoparticles occurred agglomeration in the process of oil phase removing [Citation32]. After freeze-drying, the MPS of UANs was 157.5 ± 28.0 nm (PI = 0.005) and ZP of 20.33 ± 1.67 mV. The samples in the following trials were completely produced under these conditions.
Characterization of UANs
Morphology
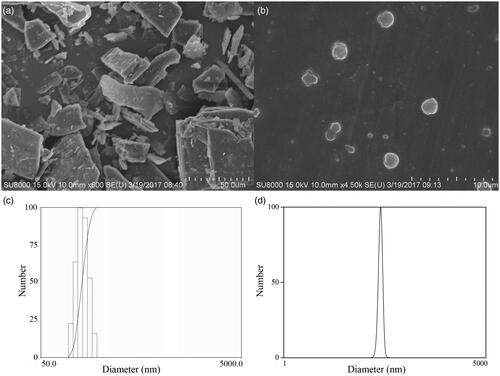
shows the surface morphology of the SEM images of UA and UANs. The raw UA presented as irregular blocks, with broad particle size distribution from 20 to 100 μm (). As is shown in , UANs presented a nearly spherical shape and separated from each other. reveals the histogram of particle size distribution of UANs. The normal distribution curves of freeze-dried UANs are shown in with the MPS of 157.5 ± 28.0 nm (PI = 0.005). Qi [Citation10] prepared UA liposome with the MPS of 223.7 ± 68.4 nm. Pi [Citation17] used antisolvent precipitation and high-pressure homogenization to prepare UA nanocrystals, and gained the MPS of 334.5 ± 2.6 and 291.7 ± 7.5 nm. Broadly speaking, we prepared the UANs of smaller particle size with uniform distribution by the ESE method. The ZP of UANs was 20.33 ± 1.67 mV. Generally speaking, nanosuspension is essentially stable when the ZP value is 20 mV [Citation21].
Figure 3. SEM pictures of (a) raw UA and (b) UANs; the histogram of particle size distribution (c) and the normal distribution curves (d) of UANs.
Physical structure characterization
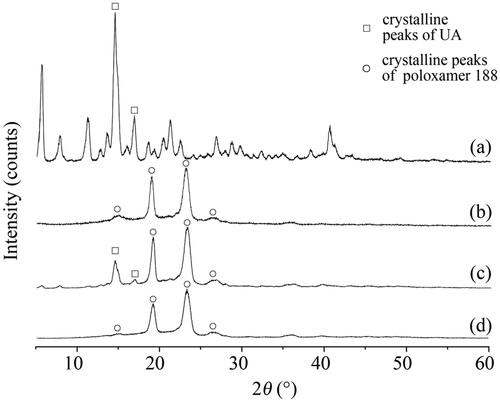
To further investigate the crystalline state of raw UA, UANs, MIX-UA and poloxamer 188, XRD was implemented. The analysis of samples is shown in . shows several intense peaks for raw UA and poloxamer 188, which indicated that they were presented in a crystalline form. shows that the MIX-UA exhibited both characteristic diffraction peaks of UA and poloxamer 188. What’s more, in , the UANs only presented crystalline peaks which were the same as those of poloxamer 188 as shown in , suggesting that UANs were no longer present as a fully crystalline state, and that had been converted into a typical amorphous state.
Figure 4. XRD patterns of (a) raw UA; (b) UANs; (c) MIX-UA; (d) poloxamer 188.
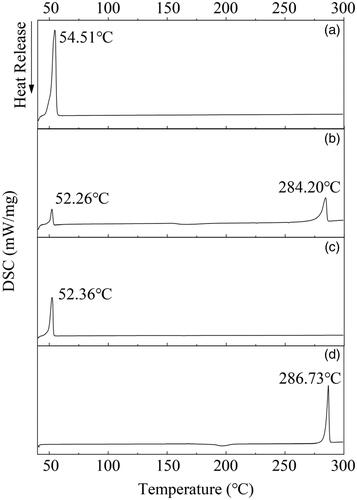
The DSC analysis is performed to verify the result of XRD. shows the results of four UA powers. According to , raw UA and poloxamer 188 both performed sharp endothermic melting peaks at 286.73 °C and 54.51 °C, respectively. These peaks distinctly presented crystal characteristics. In , MIX-UA not only had a melting peak at 284.20 °C but halo ad one at 52.26 °C, which was in accordance with the melting points of raw UA and poloxamer 188 crystals. shows that there were no distinctly endothermic melting peaks in the curve of UANs where the raw UA was performed, UANs exhibited a peak at 52.36 °C and it should be manifested by poloxamer 188. This peak indicated that UA in the UANs entirely appeared as an amorphous state, and the part of poloxamer 188 in the UANs was in the crystalline form. The results had no difference with the XRD.
Figure 5. DSC thermograms of (a) raw UA; (b) UANs; (c) MIX-UA; (d) poloxamer 188.
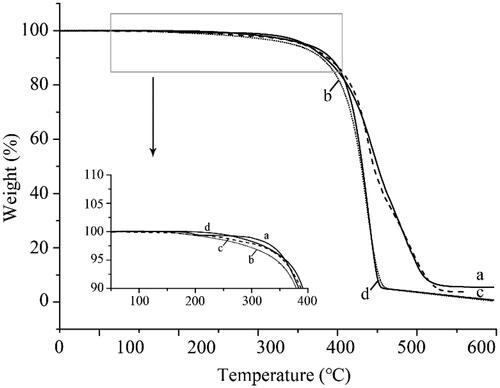
The TGA analysis was performed on raw UA, UANs, MIX-UA and poloxamer 188. TGA curve is shown in . Both the UANs and MIX-UA showed obvious thermal weight losses when the temperature reached 180 °C as in , but UANs melted faster than MIX-UA. However, the raw UA did not lose weight until 260 °C as in , the results agreed with the DSC. As shown in , poloxamer 188 began to lose weight at 220 °C. When the temperature was raised up to 400 °C, UANs lost more weight than raw UA. It can be speculated that when the particle size becomes smaller, UA will obtain a higher surface energy, which results in easier vaporization and faster thermal decomposition [Citation16]. Generally speaking, UANs only need much less energy when the nanometre particles melt than raw UA. It means that the melting point of the UANS decreased already.
Figure 6. TGA thermograms of (a) raw UA; (b) UANs; (c) MIX-UA; (d) poloxamer 188.
Solvent residue analysis
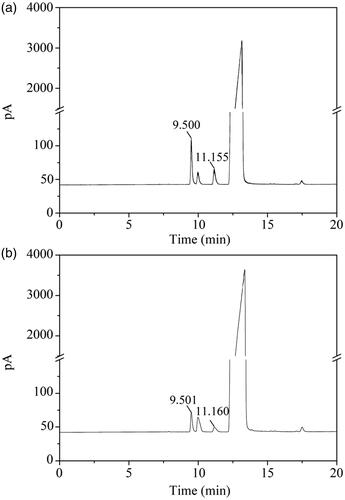
As for pharmaceutical products, the influence of solvent residues was worth to considering. shows the chromatograms of trichloromethane and ethanol standard solutions. The retention time of trichloromethane was 9.500 min, and the retention time of ethanol was 11.155 min. A regression equation between peak area (y1) and trichloromethane(x1)was y1 = 28,589x1 + 126.57, (R2 = 0.9995). In , according to the regression equation, the residual trichloromethane content in UANs was 0.00472%. Since the International Conference on Harmonization (ICH) limit for trichloromethane in class III solvents is 60 ppm or 0.006%, the UANs followed up with the requirement. Another regression equation between peak area (y2) and ethanol(x2)obtained by GC was y2 = 31,595x2 + 26.346 (R2 = 0.9998). Using the equation, we can calculate that the residual content ethanol was 0.00253% in . The ICH limits for ethanol in class II solvents are 5000 ppm or 0.5%, therefore, the UANs absolutely less than the ICH requirements. Above all, the UANs conformed to ICH requirements and were suitable for pharmaceutical use.
Figure 7. Gas chromatograms of (a) trichloromethane and ethanol standard solution; (b) UANs solution.
Equilibrium solubility
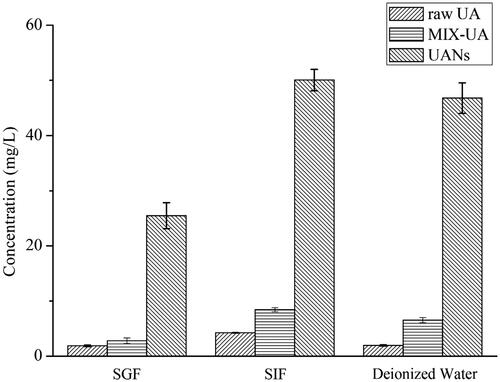
shows the result of the equilibrium solubility of raw UA, UANs and MIX-UA. The obtained solubilities of raw UA, MIX-UA and UANs were 1.89 ± 0.16, 2.80 ± 0.51 and 25.48 ± 2.36 mg l−1 in SGF, 4.24 ± 0.06, 8.42 ± 0.36 and 50.02 ± 1.94 mg l−1 in SIF and 1.95 ± 0.13, 6.52 ± 0.45 and 46.79 ± 2.78 mg l−1 in deionized water, respectively. In addition, the equilibrium solubility of MIX-UA was 1.48 times and 1.99 times that of the raw UA in SGF and in SIF, and these in deionized water is 3.34 times. Relevantly, the equilibrium solubility of UANs was 13.48 times in SGF, 11.79 times in SIF and 23.99 times in deionized water than raw UA. The result shows that though poloxamer 188 contributed to improve the equilibrium solubility to certain extent, UANs in these three kinds of medium were significantly higher compared with MIX-UA. Through the analysis, the high solubility of UANs definitely depends on the reduction of particle size and increase of the surface area, as well the change of amorphous structure of UA by the ESE method [Citation21,Citation22]. Therefore, the particle size of nanoscale will be of great importance in improving the solubility of drugs.
Figure 8. Equilibrium solubility of raw UA, MIX-UA and UANs in SGF, SIF and deionized water.
Dissolution analysis
The dissolution results of raw UA and UANs in SGF and in SIF are shown in . UANs displayed a significant dissolution rate enhancement in two dissolution mediums. As for raw UA, shows that the dissolution percentages just not be up to 1%, after dissolving in the both media 24 h later. This demonstrated that raw UA is extremely hydrophobic and does not dissolve in water. The results are in accordance with the existed conclusion from Jin et al. [Citation33,Citation34]. From , over the first 6 h, UANs presented a fast release rate in SGF, during longer time, the release process began to slow and cumulative dissolution only was 5% between 6 and 36 h. As in , the dissolution rate of sample exhibited a burst of augment from 1 to 1.5 h, and the drug was approximately 80% dissolved for UANs at 12 h in SIF. There is a significant difference in dissolution characteristic between raw UA and UANs, the dissolution rate of UANs showed more superiority than raw UA in the two mediums; meanwhile, the dissolution percentage of UANs in SIF was nearly five times of that in SGF. In Pi’s experiment [Citation17], the dissolution of UA nanocrystals also improved, which is 1.8 times in HCl and 3.3 times in PBS. Nevertheless, the dissolution rate of UANs prepared by ESE method has been up to 14.7 times in SGF and 74.3 times in SIF.
Figure 9. Dissolution rate of (a) UANs in SIF; (b) UANs in SGF; (c) raw UA in SIF; (d) raw UA in SGF.
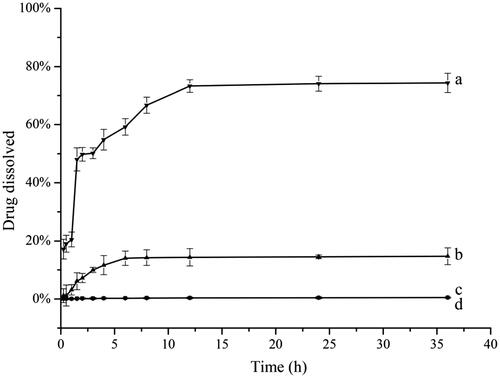
The dissolution results of UANs were in accordance with the Noyes–Whitney equation. In terms of Noyes–Whitney equation, it has a positively correlated relationship between the drug dissolution rate and the contact area in the dissolution medium [Citation35,Citation36]. Because of the obvious reduction of particles size of UANs, the specific surface area of the drugs increased accordingly, consequently, with an increase of the surface area of the solid drugs exploring to the dissolution medium, the dissolution of the drugs also improved accordingly. On the other hand, we know that UANs are in the amorphous state according to XRD, the amorphous state generates a higher surface disorder, which is contributed to a higher equilibrium solubility and dissolution rate in comparison with crystalline materials [Citation37]. In this study, we prepared UANs with amorphous structure, which get a faster dissolution rate and a better solubility eventually. From the above, amorphous state of drugs with smaller particle size could get an appreciable enhancement on dissolution rate and exert better bioactivity at short notice.
Cellular antioxidant activity capacity
shows the curve that the fluorescence intensity varied with time by different concentrations of raw UA and UANs. From the kinetic curves, UA could effectively inhibit DCF generation. With an increase in the concentration, the fluorescence intensity decreased. shows logarithm regression curves of dose–response of inhibiting ROS-induced DCFH oxidation by UA and UANs. We can calculate EC50 according to , the raw UA is 6.38 mg·ml−1 and UANs are 0.17 mg·ml−1. As we can see, UANs are reduced 37.5 times than raw UA. Emilli developed poly (lactic acid) nanoparticles containing UA by the ESE method [Citation38]. In his antioxidant assay, UA-loaded nanoparticles presented the same efficacy of raw UA, there was no relative improvement. Dissimilarly, UANs, with small particle size, possessed a higher cellular antioxidant ability.
Figure 10. Fluorescence intensity varied with time by different concentrations of raw UA (a) and UANs (b).
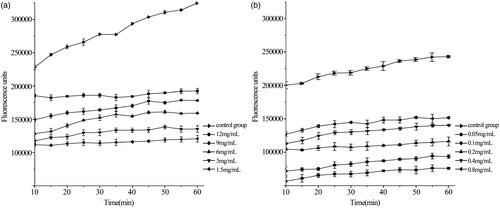
Figure 11. The logY to logC standard curve. The definition of Y to see 2.5.3, C is defined as antioxidant concentration.
Oral bioavailability analysis
shows the blood plasma concentration time curves on oral administration of UA suspension and UANs suspension to rats. The corresponding pharmacokinetic parameters are shown in . The UA concentration in rat plasma of the UANs group exhibited a significant enhancement compared with the raw UA group. With a single dose (100 mg·kg−1) of raw UA and UANs groups, both reached maximum concentrations at 0.5 h after taking drugs, attaining the peak concentration of 1.01 ± 0.07 and 3.17 ± 0.06 mg·l−1, respectively. AUC is an important pharmacokinetic parameter to access the exposure and circulating time of the drug. The ratio of the AUC values for the formulated UANs are 16.785 mg·l−1 h−1 but for raw UA, it is 6.27 mg·l−1 h−1. AUC of UANs increases 2.68 times than raw UA. The results are indicative of an obviously improvement in bioavailability of UA when it is in the form of nanoparticles. On reducing of the size of the particle, UANs had advantages on equilibrium solubility and dissolution rate comparing to raw UA [Citation39,Citation40]. We had prepared UANs by the ESE method, absorbed more rapidly and completely, and had higher bioavailability than Pi’s preparation method, whose relative bioavailability was 2.56 times improvement than raw UA [Citation17]. This increase correlated to the smaller particle sizes and amorphous state, which fits the inferences of the dissolution result and above characterization experiments.
Figure 12. Concentration–time curves of (a) UANs; (b) raw UA.
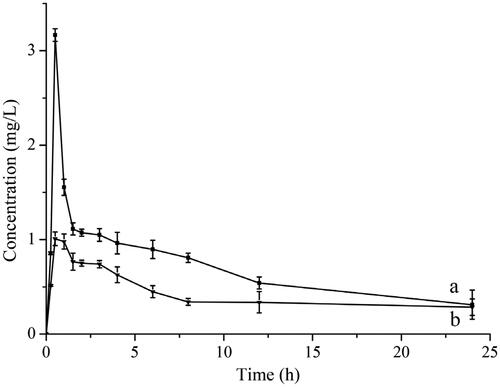
Table 2. The pharmacokinetics parameters of UA by oral administration (n = 6).
Conclusion
Discrepancy in drug solubility is because of the preparations that have different dissolution rates in the body, and directly affects whose absorption, distribution, excretion and metabolism in the body. In the end, the effects of bioavailability lead to the drug’s differences in clinical efficacy. In this study, we spare no efforts to prepare UANs by the ESE method, followed by freeze-drying to improve the solubility and oral bioavailability. In preparation, poloxamer 188 was the only auxiliary materials, which was selected as surfactant and cryoprotectant. We used single-factor experiment to screen out the optimal conditions for preparing nanoparticles. The best operating conditions are that: 0.5 ‰ of poloxamer 188, 1: 4 of volume ratio of organic to water phase; 7000 rpm of homogenate speed for 2 min and 500 bar of homogenization pressure for six times. Under the optimal conditions, the MPS of UANs was gained at 100.2 ± 12.1 nm. SEM showed that UANs were nearly spherical with uniform particle size distribution. By the XRD, TGA and DSC, we could acquaint UANs had no difference with the raw UA in chemical structure but had been amorphous state. Solubility and dissolution test figured the enhancement of the dissolubility of UANs. The equilibrium solubility of UANs was 23.99 times in deionized water than raw UA. UANs also improved in antioxidant activity toward cells. The oral bioavailability of UANs was 2.68 times higher than that of raw UA. In other words, the UA prepared by the ESE method had a significant enhancement on the water solubility and the bioavailability. Furthermore, the residual trichloromethane and ethanol are less than the ICH limits for class III and class II solvents.
In general, this study indicates that the emulsion solvent evaporation method has an array of valued on improving water solubility and oral bioavailability of drugs, and UANs by ESE will be very much developing around clinical application.
Disclosure statement
No potential conflict of interest was reported by the authors.
Additional information
Funding
References
- Shanmugam MK, Dai X, Kumar AP, et al. Ursolic acid in cancer prevention and treatment: molecular targets, pharmacokinetics and clinical studies. Biochem Pharmacol. 2013;85:1579–1587.
- Kazmi I, Afzal M, Gupta G, et al. Antiepileptic potential of ursolic acid stearoyl glucoside by GABA receptor stimulation. CNS Neurosci Ther. 2012;18:799–800.
- Li WG, Zhao XH, Sun XL, et al. Evaluation of antioxidant ability in vitro and bioavailability of trans-cinnamic acid nanoparticle by liquid antisolvent precipitate. J Nanomater. 2016;2016:9518362.
- Wang QQ, Zhao TT, Liu YP, et al. An evaluation of anti-tumor effect and toxicity of PEGylated ursolic acid liposomes. J Nanopart Res. 2016;18:155–167.
- Shanmugam MK, Nguyen AH, Kumar AP, et al. Targeted inhibition of tumor proliferation, survival, and metastasis by pentacyclic triterpenoids: potential role in prevention and therapy of cancer. Cancer Lett. 2012;320:158–170.
- Xiong B, Lei ZY, Chen H. Research progress of ursolic acid pharmacology. Foreign Med Sci Sect Pharmacy. 2004;31:133–136.
- Gao Y, Li Z, Xie X, et al. Dendrimeric anticancer prodrugs for targeted delivery of ursolic acid to folate receptor-expressing cancer cells: synthesis and biological evaluation. Eur J Pharm Sci. 2015;70:55–63.
- Qiu L, Zhao XH, Zu YG, et al. Preparation, characterization, and dissolution characteristics of ursolic acid nanoparticles prepared by emulsion solvent evaporation method. Chin Tradit Herbal Drugs. 2018;49:2387–2393.
- Ou XX, Wang ZM, Feng L. Preparation and bioavailability of ursolic acid self-microemulsion. Chin J ETMF. 2012;18:36–39.
- Qi N, Liu G, Liao Y, et al. Preparation and in vivo release behavior investigation of ursolic acid liposome. Chin J ETMF. 2013;19:28–31.
- Eloy JO, Saraiva J, Albuquerque S, et al. Preparation, characterization and evaluation on the in vivo trypanocidal activity of ursolic acid-loaded solid dispersion with poloxamer 407 and sodium caprate. Braz J Pharm Sci. 2015;51:101–109.
- Zong W, Zhang H, Yuan WL, et al. Study on the preparation of ursolic acid-β-cyclodextrin inclusion complex by ultrasonic wave and its characteristic. China Acad J Electronic. 2011;32:237–239.
- Soukoulis C, Torsten B. A comprehensive overview on the micro and nano technological encapsulation advances for enhancing the chemical stability and bioavailability of carotenoids. Crit Rev Food Sci Nutr. 2018;58:1–36.
- Ain-Ai A, Gupta PK. Effect of arginine hydrochloride and hydroxypropyl cellulose as stabilizers on the physical stability of high drug loading nanosuspensions of a poorly soluble compound. Int J Pharm. 2008;351:282–288.
- Gao L, Zhang DR, Chen MH. Drug nanocrystals for the formulation of poorly soluble drugs and its application as a potential drug delivery system. J Nanopart Res. 2008;10:845–862.
- Yang L, Sun Z, Zu Y, et al. Physicochemical properties and oral bioavailability of ursolic acid nanoparticles using supercritical anti-solvent (SAS) process. Food Chem. 2012;132:319–325.
- Pi JX, Liu ZD, Wang H, et al. Ursolic acid nanocrystals for dissolution rate and bioavailability enhancement: influence of different particle size. CDD. 2016;13:1358–1366.
- Huang H, Zhang BF. Determination of ursolic acid and oleanolic acid in different varieties of kuding tea. China Acad J Electronic Publishing House. 2012;40:243–245.
- Zhao XH, Deng YP, Zhang Y, et al. Silymarin nanoparticles through emulsion solvent evaporation method for oral delivery with high antioxidant activities, bioavailability, and absorption in the liver. RSC Adv. 2016;6:93137–93146.
- Hu J, Ng WK, Dong Y, et al. Continuous and scalable process for water-redispersible nanoformulation of poorly aqueous soluble APIs by antisolvent precipitation and spray-drying. Int J Pharm. 2011;404:198–204.
- Li Y, Zhao X, Zu Y, et al. Preparation and characterization of micronized ellagic acid using antisolvent precipitation for oral delivery. Int J Pharm. 2015;486:207–216.
- He W, Lu Y, Qi J, et al. Food proteins as novel nanosuspension stabilizers for poorly water-soluble drugs. Int J Pharm. 2013;441:269–278.
- Zhao X, Wang W, Zu Y, et al. Preparation and characterization of betulin nanoparticles for oral hypoglycemic drug by antisolvent precipitation. Drug Deliv. 2014;21:467–479.
- Wolfe KL, Kang XM, He XJ, et al. Cellular antioxidant activity of common fruits. J Agric Food Chem. 2008;56:8418–8426.
- Wolfe KL, Liu RH. Cellular antioxidant activity (CAA) assay for assessing antioxidants, foods, and dietary supplements. J Agric Food Chem. 2007;55:8896–8907.
- Ahuja BK, Jena SK, Paidi SK, et al. Formulation, optimization and in vitro-in vivo evaluation of febuxostat nanosuspension. Int J Pharm. 2015;478:540–552.
- Collins JM, Despa F, Lee RC. Structural and functional recovery of electropermeabilized skeletal muscle in-vivo after treatment with surfactant poloxamer 188. Biochim Biophys Acta. 2007;1768:1238–1246.
- Raymond CR, Paul JS, Marian EQ. Handbook of pharmaceutical excipients. 6th ed. Pharmaceutical Press; 2009.
- Zu Y, Meng L, Zhao X, et al. Preparation of 10-hydroxycamptothecin-loaded glycyrrhizic acid-conjugated bovine serum albumin nanoparticles for hepatocellular carcinoma-targeted drug delivery. Int J Nanomed. 2013;8:1207–1222.
- Zu YG, Sun W, Zhao XH, et al. Preparation and characterization of amorphous amphotericin B nanoparticles for oral administration through liquid antisolvent precipitation. Eur J Pharm Sci. 2014;53:109–117.
- Zu YG, Yu XY, Zhao XH, et al. Nanocrystallization of the pharmaceutically active agent Genipin by an emulsion solvent evaporation method. Int J Nanomed. 2014;2014:1–13.
- Zhang Y, Li Y, Zhao XH, et al. Preparation, characterization and bioavailability of oral puerarin nanoparticles by emulsion solvent evaporation method. RSC Adv. 2016;6:889–901.
- Jin IJ, Ko YI, Kim YM, et al. Solubilization of oleanolic acid and ursolic acid by cosolvency. Arch Pharm Res. 1997;20:169–175.
- Ge ZQ, Du XY, Huang XN, et al. Enhanced oral bioavailability of ursolic acid nanoparticles via antisolvent precipitation with TPGS1000 as a stabilizer. J Drug Deliv Sci Technol. 2015;29:210–217.
- Dong Y, Ng WK, Hu J, et al. A continuous and highly effective static mixing process for antisolvent precipitation of nanoparticles of poorly water-soluble drugs. Int J Pharm. 2010;386:256–261.
- Mosharraf M, Nystrom C. Apparent solubility of drugs in partially crystalline systems. Drug Dev Ind Pharm. 2003;29:603–622.
- Kim S, Ng WK, Dong Y, et al. Preparation and physicochemical characterization of trans-resveratrol nanoparticles by temperature-controlled antisolvent precipitation. J Food Eng. 2012;108:37–42.
- Emilli A, Osmar dRAJ, Isis SdA, Najeh Mk, Rubiana MM. Poly(lactic acid) nanoparticles loaded with ursolic acid: characterization and in vitro evaluation of radical scavenging activity and cytotoxicity. Mater Sci Eng C. 2017;71:156–166.
- Hecq J, Deleers M, Fanara D, et al. Preparation and characterization of nanocrystals for solubility and dissolution rate enhancement of nifedipine. Int J Pharm. 2005;299:167–177.
- Brough C, Williams RO. Amorphous solid dispersions and nano-crystal technologies for poorly water-soluble drug delivery. Int J Pharm. 2013;453:157–166.