
Abstract
Since proliferation and differentiation of spermatogonial stem cells (SSCs) in culture system provide successful transplantation in this study, culture of human SSCs was compared to SACS (soft agar culture system), gelatin and control groups. The cells were isolated from seminiferous tubules of non-azoospermia patients (NOA) and cultured in DMEM for 3 weeks. The presence of SSCs in culture system was confirmed by immunocytochemistry of GFR-α1 and ITGα6 antibodies. The proliferated cells were cultured in three mentioned groups in the presence of retinoic acid and Sertoli cells conditioned medium for another 2 weeks. The number of colonies in the SACS group was significantly higher than two other groups. Before 2 weeks of culture, only Oct4 expression was observed in testicular cells (2.32 ± 0.25). After 2 weeks, the expression of Oct4 in the gelatin group was higher than that of the SACS group on day 7. The maximum expression of Stra8 was observed in SACS and gelatin groups after 7 days, but its expression was significantly decreased after 14 days of culture (p < .05). The expression of Scp3 and Acrosin genes were higher after 14 days in the SACS group compared to other groups. SACS has positive effects on proliferation and differentiation of hSSCs.
Introduction
Spermatogenesis occurs in seminal tubules and is regulated by a microenvironment surrounding the spermatogonial stem cells (SSCs), which is called niche [Citation1,Citation2]. Stem cells that leave the niche are more likely to go to an environment that promotes their differentiation to other specific cells [Citation3].
Sertoli cells are the most important somatic cells present in the niche due to the production of growth factors and cytokines and their presence in the blood-testis barrier. During spermatogenesis, Sertoli cells secrete growth factors and cytokines in order to regulate the proper self-renewing and differentiation of SSCs, meiosis of spermatocytes and conversion of round spermatid to spermatozoa [Citation4]. Since the number of Sertoli cells determines the size of the testis, it is assumed that each Sertoli cell supports a predetermined number of germ cells [Citation5]. Many interactions between Sertoli cells and germ cells at each developmental stage have an autocrine/paracrine nature [Citation6–8].
Retinoic acid (RA) is a small polar molecule that spreads throughout the tissues and acts through a link with RA nuclear receptors (RARs). They also undergo heterodimer with nuclear retinoid X receptors. Some RARs and RXRs are expressed by germ cells at an appropriate stage of development. RA as an active derivative of vitamin A controls the entrance of germ cells into meiosis stage. In addition, RA can induce conversion of undifferentiated spermatogonia to differentiating spermatogonia [Citation9].
According to previous studies, the response of cells in three-dimensional culture system is very similar to the behavior of cells in vivo compared to two-dimensional culture system. In a 3D culture, the cells communicate with each other, an extracellular matrix (ECM) and the surrounding microenvironment. These interactions in 3D structures affect proliferation, differentiation, cell morphology, gene and protein expression and cell responses to external factors [Citation10]. In 3D culture systems, the cells form assemblages or spheroids between matrixes or in a suspension medium [Citation11–13]. The 3D Soft Agar Culture System (SACS) represents in vivo conditions that mimic some of the natural aspects of the 3D environment [Citation14].
Among 2D culture systems, gelatin is a type of extracellular matrix (ECMs) that acts as a substrate for coating the culture dish [Citation15]. The culture of mammalian SSCs has been done in some conventional 2D system using culture dishes or flasks [Citation2]. The physical support for SSCs in a 2D culture is varied from natural microenvironment of the seminiferous tubule.
Since the proliferation and differentiation of spermatogonial cells in culture system provide successful transplantation of these cells to testes tissue and also, most studies have investigated the effects of two-dimensional and three-dimensional culture systems on animal’s models, so this study proliferation and differentiation of human SSCs was compared in SACS, gelatin-coated plates and control groups. In fact, the new protocol needs to be tested in human species for transfer of results to the clinic, so these techniques should be repeated successfully in humans for treatment of disease. In this study, human spermatogonial cells isolated from testis of non-obstructive azoospermia patients and cultured in DMEM in the presence of 10% fetal bovine serum (FBS) for 3 weeks. The presence of SSCs in culture system was confirmed by immunocytochemistry of GFR-α1 and ITGα6 antibodies. Then, the cells were cultured on SACS, gelatin-coated plates and control groups in 10– 6 M retinoic acid and Sertoli cells conditioned medium from OA patients for 2 weeks. To investigate the effect of culture system on SSCs differentiation, the expression of pluripotent (Oct4), pre-meiotic (Stra8), meiotic (Scp3) and post-meiotic (Acrosin) germ cells specific genes was investigated by real-time PCR before culture and on days 7 and 14 after culture in 3 groups.
Materials and methods
Isolation of human spermatogonial cells and Sertoli cells
Human testis biopsies were obtained from non-obstructive azoospermia (NOA) men referred to the Infertility Clinic of Khatam Alanbia and Parsian Hospital (n = 14, aged 21–41 years, average 32 years) during 2016–2017. Analysis of semen was done according to WHO criteria and biopsy of testis was only prepared in cases where sperm could not be detected in any of the semen samples collected during the year. The experimental protocol and use of human testicular biopsy sample were authorized by the Ethical and National Research Council guidelines of Shahid Beheshti University (Tehran, Iran).
The small pieces of testis weighing approximately 100–200 mg were placed into a medium and transferred to the laboratory within 40 min. After three times washing with PBS (phosphate buffered saline) supplemented with 1% pen/strep, they were placed in Dulbecco’s Modified Eagle Medium (DMEM; Thermo fisher scientific, Waltham, MA, USA) which consisted of 0.5 mg/ml collagenase IV, 0.5 mg/ml trypsin, 0.5 mg/ml hyaluronidase and 0.05 mg/ml DNase (with shaking and a little pipetting), at 37 °C for 30 min. During this time, tissues were mechanically dissected using two insulin needles and separated in the enzymatic digestion solution (all enzymes from Sigma (St Louis, MO, USA). Then, the obtained cells and spermatogenic tubules were centrifuged at 112 g for 5 min. After three washes in DMEM and removal of most of the fibroblast, interstitial and endothelial cells, second digestion step (5 min at 37 °C) was done by adding a fresh mixture of enzymes and DMEM to the residual seminiferous tubule fragments. The clumps of cells were gently agitated by repeated pipetting with a pipette tip for a minute. Subsequently, the cells were centrifuged at 542 g for 5 min in order to separate the cells from the residual tubular fragments.
The obtained cells suspension (a mixture of spermatogonial cells and Sertoli cells) were filtered through a 70 µm nylon filter and cultured for three weeks at 37 °C, in the presence of 10% fetal bovine serum (FBS; Thermo Fisher scientific),1% Pen/Strep and 5% CO2, in a humidified atmosphere [Citation16]. After 3 weeks, the cells were dissociated by (EDTA)–trypsin treatment (0.02% EDTA–0.1% trypsin) at 37° C for 5 min and the presence of spermatogonial stem cells in culture system was confirmed by immunocytochemistry of GFR-α1 and ITGα6 antibodies. Then, the cell suspension was cultured on SACS, gelatin-coated plates and control groups for another two weeks. In this study, the secretions of Sertoli cells were extracted from obstructive azoospermia (OA) patients and used as a conditioned medium for culturing the germ cells of non-obstructive azoospermia (NOA) patients in three groups. The number and diameter of colonies were evaluated on days 3, 7, 10 and 14 after culture using an inverted microscope (Olympus IX71, EXFO 120 Xenon-Hg excitation light). The expression of Oct4, Stra8, Scp3 and Acrosin genes was also evaluated before and after 2 weeks of culture by quantitatively real-time PCR. The Y chromosome microdeletions (including SRY, ZFY, sY84, sY86, sY127, sY134, sY254 and sY255) were investigated in NOA patients by multiplex PCR technique.
The preparation of conditioned medium from OA patients
The small pieces of testis were prepared from obstructive azoospermia (OA) patients (n = 8, aged 21–43 years, Tehran, Iran), transferred to the lab and enzymatic digestion method was performed as earlier mentioned for NOA patients. Some culture flasks were coated by 5 μg/ml of Datura stramonium agglutinin (DSA; Sigma, Gimson weed, thorn apple, USA) in PBS at 37 °C for 1 h. The obtained cell suspension was added to the flasks and incubated at 37 °C in the presence of 10% FBS and 5% CO2, in a humidified atmosphere. To isolate Sertoli cells, the non-adhering germ cells were collected and discarded after leaving overnight. The remaining cells were cultured for 4–5 days in DMEM accompanied by 10% FBS and the medium was changed everyday for increasing the purity of Sertoli cells. Then, the cell was detached by treatment with EDTA-trypsin in PBS (calcium and magnesium free) at 37°C for 5 min, washed with fresh DMEM and centrifuged at 645 g for 5 min. Then, the cells were counted and adjusted to desired densities into 3 cm culture dishes and cultured for 10 days and the medium was collected every three days and filtered through a 0.22 µm nylon filter. This medium was considered as conditioned medium and subsequently stored in −80 °C freezer until further use.
Immunocytochemical evaluation for confirmation of Sertoli cells
The Sertoli cells were evaluated with FSH receptors as a marker by immunocytochemistry technique [Citation17]. For this purpose, Sertoli cells were cultured on the glass slides and fixed for 20 min in 4% paraformaldehyde at room temperature. Following permeabilisation by 0.2% Triton X-100 (MPbiomed Inc, Ottawa, Ontario, Canada) for 1 h, which facilitates antibody penetration, they were incubated overnight at 4°C with the rabbit polyclonal anti-FSH receptor antibody (diluted 1: 200; Abcam, Boston, MA, USA) which has been described as a marker for Sertoli cells [Citation17]. After washing with PBS, the cells were incubated with the secondary antibody (Goat FITC-conjugated anti-rabbit IgG) ((diluted 1:100; Abcam, USA) for 2 h. The control slides were under similar conditions except for the removal of the first antibody.
To culture of human spermatogonial stem cells (hSSCs) on gelatin-coated plates
A total of 24 well plates were coated with 0.1% gelatin. Then, the obtained cells from NOA patients were cultured on them in the presence of 15% FBS accompanied by 50% conditioned medium in addition to 50% low-glucose DMEM supplemented by 1 µM retinoic acid (RA) for two weeks. The medium was changed every three days until 14 days after culture.
Culture of hSSCs on SACS and control groups
To make certain concentrations of agar, at first 0.7% (w/v) and 1% (w/v) agar were dissolved in distilled water separately. Then, these solutions were mixed with the same volume of low-glucose DMEM to the final concentrations of 0.35 and 0.5% in order to prepare the upper and lower phases, respectively. The gel phase of agar was added on top of the lower layer after solidification. The lower layer (solid agar base) contained low-glucose DMEM, 20% (v/v) FBS and 0.5% (w/v) agar only [Citation18]. Tubular cells with a final volume of 500 ml were cultured in the upper layer of the soft agar medium (0.35% agar + low glucose DMEM + 20% (v/v) FBS in 24-well plates [Citation14].
Cell suspensions and DMEM were mixed prior to adding the agar at 37 °C to preclude premature agar coagulation and cellular stress probably caused by heat. All cell culture plates were incubated for 2 weeks at 37 °C in the presence of 15% FBS, 50% conditioned medium, in addition to 50% low-glucose DMEM supplemented by 1 µM RA. Every three days, the medium was changed until 14 days after culture.
For the control group, the obtained cells from NOA patients were cultured on 24-well non-coated plates in the presence of 15% FBS accompanied by 50% conditioned medium in addition to 50% low-glucose DMEM supplemented by 1 µM retinoic acid (RA) for 2 weeks.
To evaluate the diameter and number of colonies in three different culture system
The diameter and number of colonies were evaluated on days 3, 7, 10 and 14 after culture using an inverted microscope (Olympus IX71, EXFO 120 Xenon-Hg excitation light). Colonies were counted separately in whole fields in each well of three groups. The diameter of the colonies was measured using Image J Software.
The evaluation of some specific genes expression by real-time PCR
The differentiation of spermatogonial cells was evaluated by the expression of Oct4, Stra8, Scp3, and Acrosin genes during different days of culture through real-time PCR. For this purpose, the cultured cells were isolated with trypsin-EDTA and collected by centrifugation in gelatin-coated plates and control groups. Pick up of colonies were performed in SACS group at days 7 and 14 after culture. Total RNA was extracted using Trizol (Life technologies, CA, USA; 15596–026) according to the manufacturer’s protocol and DNase treatment was applied by RNase-Free DNase Set “DNase I”, Qiagen, Mainz, Germany. cDNA was generated from 500 ng total RNA using Thermo Scientific RevertAid First Strand cDNA Synthesis Kit (# 1622). For quantitative PCR, 4 μl 5x HOT FIREPol® EvaGreen® qPCR Mix Plus (Solis BioDyne, Tartu, Estonia) was added to each well of the PCR plate (10 μl of water, 1 μl of primers and 5 μl of cDNA), based on the following procedure: 50 cycles at 95 °C for 30 s, 57.4–65 °C for 30 s and 72 °C for 30 s. Based on the ΔΔCt method, the threshold of cycle values was normalized against the threshold value of the β-actin housekeeping gene (as an internal control). Extracted cells from normal testis were considered as a positive control. The primers of genes are: Oct4; Forward: GGGCTCTCCCATGCATTCAAA
Reverse: CACCTTCCCTCCAACCAGTTGC; Stra8 (as a pre-meiotic gene) Forward: CAGCGCTCTTCAACAACCTC and Reverse: ACCTGCCACTTTGAGGCTATG; Scp3 (as a meiotic gene) Forward: GGAAGGAGTTGGAGTTGACAT and Reverse: ATCCCACTGCTGAAACAAAGTC; Acrosin (as a post-meiotic gene) Forward: ATCACCCCTCCCATTTCGTG Reverse: AGTCCAGGTCGATGAGATCC; β-actin (as a housekeeping gene) Forward; AGGCGGACTATGACTTAGTTGCGTTACACC and Reverse; AAGTCCTCGGCCACATTGTGAACTTTG.
Scanning electron microscopic study of SACS colonies
The ultrastructure images of cell cultured in SACS group was investigated by Scanning electron microscopy (SEM). For this purpose, the cultured cells in soft agar were fixed in 2.5% glutaraldehyde in 0.1 M phosphate buffer, accompanied by 2% paraformaldehyde 14 days after culture. They were further washed with 0.1 M phosphate buffer (pH = 7.4). Specimens were then dehydrated to 100% ethanol using an increased ethanol-water series and then dried. The samples were mounted on aluminum stubs with sticky carbon tabs. A Gatan ion beam coater was used to coat the agar with a layer of Au/Pd. Images were obtained using Philips XL 30 SEM scanning electron microscope (Amsterdam, The Netherlands).
Data analysis
All statistical analysis was performed using SPSS software version 22 (CA, USA) and merged to calculate the mean ± standard error of the mean (SEM). The Shapiro–Wilk test was done to determine whether the data were normally distributed. The parametric and non-parametric data were analyzed by independent one-way ANOVA and Kruskal–Wallis test, respectively. Repeated measures test was done for timeframe analysis per group. Probability values <.05 were considered statistically significant.
Results
In this study, the human testicular cells were isolated from small biopsies of the testis of NOA patients. Since the size of biopsies was small, following that, the small number of cells was obtained from the digestion process. Therefore, before the culture of cells on SACS, gelatin and control group, the cell suspension was proliferated for three weeks to increase the cell population.
Two groups of cells were identified in the cell suspension based on size and morphology. The first group had a diameter of 8–9 micrometers, with irregular edges and round transparent appearance. These cells were proliferated and formed a layer at the bottom of the plate, which was considered as a feeder layer. The second group of the cells was larger than the first one and had a diameter of 15–17 micrometers and their appearance was spherical and had two or three nucleoli outside the center. These cells were proliferated and several colonies with different numbers and diameters appeared in the culture system, so that the average number of colonies was 13.3 ± 0.7 and the average diameter of colonies was 157.8 ± 16.7. In this study, the presence of FSH receptor as a marker on the surface of Sertoli cells was confirmed by immunocytochemistry method. These cells appeared green color ().
Figure 1. The morphology of isolated cells from NOA testis. (a) Two types of cells are visible. The thick arrow represents the stem cells of the spermatogony. The thin arrow represents the Sertoli cells. (Scale bar: 50 µm). (b) The Sertoli cells attached to the plate and formed spindle-like shape (Scale bar: 200 µm). (c) The present of FSH receptor in Sertoli cells was confirmed by imunocytochemistry technique (Scale bar: 100 µm). (d) The control group without the primary antibody and stained with PI (Scale bar 100 µm).
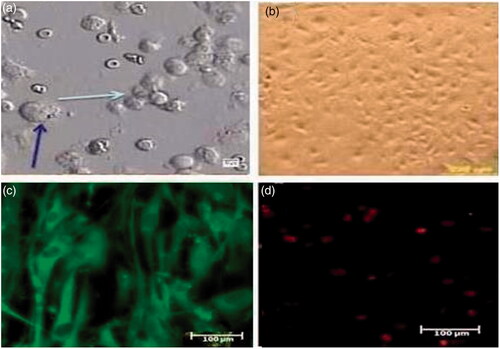
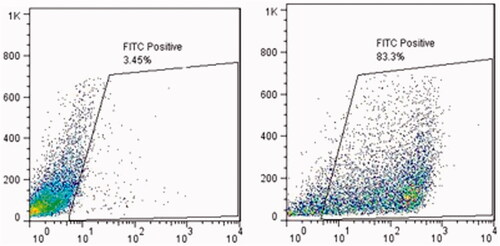
The nature of Sertoli cells was also proven by flow cytometry technique to test the intermediate filament of vimentin inside the Sertoli cells. Our results indicated a high percentage of positive vimentin cells in the culture system ().
Figure 2. The efficiency of Sertoli cells enrichment was quantitatively assessed by flow cytometry. Attached Sertoli cells were detached by EDTA–trypsin treatment and labeled with mouse monoclonal anti-vimentin antibody overnight at 4 °C. The cells were incubated with FITC-conjugated anti-mouse antibody for 1 h. Negative control was incubated only with FITC-conjugated goat anti-mouse antibody. The results showed Vimentin positive characteristic in attached layer.
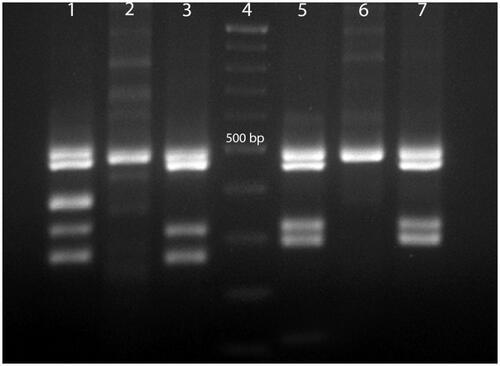
In this study, investigation of Y chromosome microdeletions in NOA patients showed that the three NOA patients had microdeletion in AZFc (sY254, sY255) region and were excluded from the study ().
Figure 3. Multiplex PCR from normal man, woman and NOA patients with AZFc microdeletions. Line 1, normal men, multiplex 1; line 2, normal woman, multiplex 1; line 3, NOA patient with AZFc microdeletions in sY254 region, multiplex1; line 4, Gene RulerTM (DNA Ladder,100 bp, Fermentase # SM0333); line 5, normal men, multiplex 2; line 6, normal woman, multiplex 2; line 7, NOA patient with AZFc microdeletions in sY255 region, multiplex 2. Multiplex 1 included SRY: 427 bp, sY254: 400 bp (AZFc), sY86: 320 bp (AZFa), sY127: 274 bp (AZF b). Multiplex 2 included SRY: 472 bP, sY84: 326 bp (AZFa), sY134: 301 bp (AZFb), sY255: 126 bp (AZFc).
Confirmation of SSCs in the culture system
After 3 weeks’ culture of testicular cells, an immunocytochemistry reaction was performed on the cells by two antibodies of GFR-α1 and ITGα6 for confirmation of SSCs in culture. The results showed that a large percentage of cells showed a positive reaction for these antibodies. The expression of some genes (Oct4, Stra8, Scp3, Acrosin) was also studied in these cells, after 3 weeks of culture, using real-time PCR technique. The results showed that Oct4 expression was only observed in these cells (2.32 ± 0.25) and the expression of Stra8, SCP3, and Acrosin genes was not observed 3 weeks after culture.
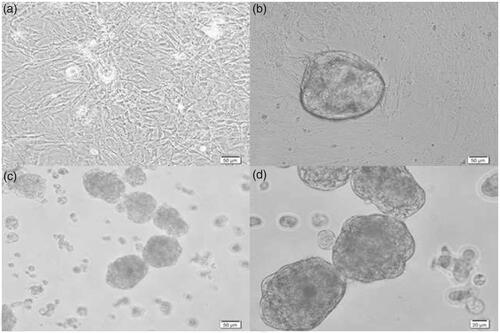
After 3 weeks of proliferation, the cells were isolated and divided between three groups (SACS, gelatin-coated plates and control groups). Since the separation and counting of cells in agar (SACS) culture system was difficult, in order to evaluate the ratio of the cell growth in 3 groups based on constant condition, the number and diameter of colonies appeared in the experimental and control groups was evaluated on days 3, 7, 10 and 14 after culture. The results showed that in the control group, no colony was observed at any time and only small clusters were seen (). These clusters were not counted in this study. The colonies in the gelatin-coated plates group were heavily compacted and exhibited a round shape with sharp edges (). The colonies in the SACS group were less dense and showed single cells and small groups of cells in loose contact with the colony ().
Figure 4. The SSCs colonies in the control, gelatin and SACS groups on day 14 after culture. (a) Control group, (b) gelatin group and (c,d) SACS group. As seen, no colonies were observed in the control group and only single cells and small clusters of SSCs were observed in this group. Magnification: 50 and 20 micrometers.
The number of colonies in the 3rd, 7th, 10th and 14th days after culture was higher in the SACS group rather than gelatin group. There was a significant difference between two groups on day 3 (p < .05) and on days 7, 10 and 14 after culture (p < .01). The mean ± SEM of the SACS and gelatin groups were 31.25 ± 7.06 vs. 1 ± 0.57, 21.5 ± 3.28 vs. 1.3 ± 0.83, 20.16 ± 3.92 vs. 1.33 ± 0.83, 12.37 ± 2.0 vs. 1.5 ± 0.76, respectively ().
Figure 5. The comparison of the number and diameter of colonies in SACS and gelatin-coated plate groups (*p < .05), (**p < .01). As it is observed in the figure, there is no significant difference in diameters of colonies between two groups during 14 days.
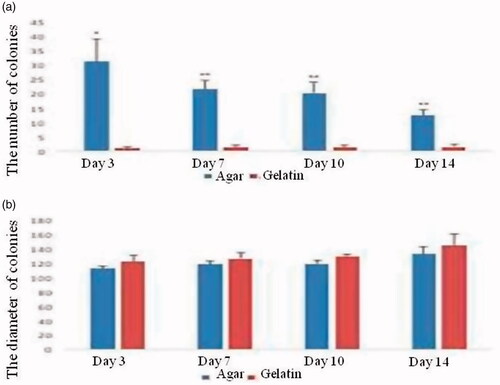
The maximum diameter of colonies was shown in gelatin-coated plate group on day 14 of culture but no significant difference was noted between this group and SACS on different days of culture. Despite the significant difference between the number of colonies in SACS and gelatin-coated plates on all days, no difference was noted among the two groups for diameter of colonies on days 3, 7, 10 and 14, as far as the diameter of colonies is concerned (p>.05) () (112.39 ± 3.79 vs. 121.60 ± 9.76, 118.28 ± 4.68 vs. 125.83 ± 8.62, 118.74 ± 4.99 vs. 128.68 ± 3.64, 132.52 ± 10.60 vs. 144.33 ± 15.93 SACS and gelatin-coated plates on days 3, 7, 10 and 14, respectively) ()
In this study, the expression rate of some specific genes (Oct4, Stra8, Scp3, Acrosin) was evaluated on days 7 and 14 after culture in all three groups of SACS, gelatin and control by quantitative real-time PCR. The results showed that a significant difference was noted in the expression of the Oct4 gene on day 7 after culture between SACS and gelatin groups (p < .01). The expression of this gene on day 7 after culture in gelatin group was higher than that of the SACS group (the mean expression in the gelatin group was 1.06 ± 0.07 versus 0.35 ± 0.1 in the SACS group). There was no significant difference between SACS and control groups and between gelatin and control groups on day 7 after culture (p > .05). ().
Figure 6. The relative fold change of Oct4, Stra8, Scp3 and Acrosin genes expression in spermatogonial cells that cultured in SACS, gelatin-coated plate and control groups. Notes: Values are mean ± SEM. *indicated statistically significant difference (p < .05), **indicated statistically significant difference (p < .01).
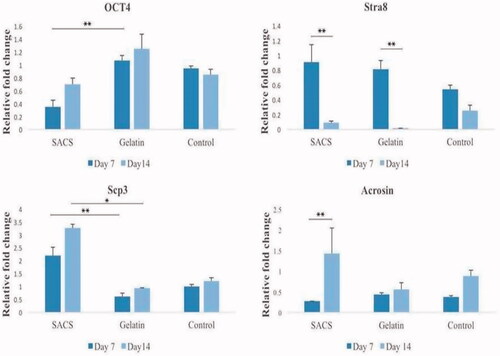
The results showed that the expression of Stra8 in different culture groups was significantly different between days 7 and 14 in SACS and gelatin groups (p < .01). The average expression of this gene on day 7 after the culture is higher than that of day 14 in three groups. The mean of Stra8 expression in the control group was higher on day 7 in comparison to day 14 after culture, however, it was not significantly different (p>.05) ().
In this study, the expression rate of the meiotic gene of Scp3, as a marker of synaptonemal complex formation in the meiosis process, was investigated in three groups. The results showed that on day 7 after culture, the highest expression of this gene was observed in the SACS group, which is significantly higher than the gelatin group (p < .01), but there was no significant difference between the SACS and control groups as well as the gelatin and control groups on day 7 after culture. Also, on the 14th day after culture, the expression of this marker was significantly higher in the SACS group rather than gelatin group (p < .05). The mean expression of Scp3 gene on day 14 in the SACS group was 3.26 ± 0.16 and in gelatin group was 0.94 ± 0.01 ().
The results of expression of post-meiotic genes of Acrosin in all three groups showed that, in the SACS group, the expression of this gene increased rather than the other two groups on the 14th day after culture. The expression of this gene in the SACS group increased on day 14 after culture compared to day 7 (p < .01). The highest expression of Acrosin gene was observed after 14 days of culture in the SACS group compared to other two groups. However, there is also an increase in the expression of this gene in control and gelatin groups, but the increase of this gene expression in the SACS group is more pronounced after 14 days of culture (.
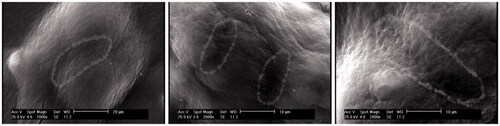
In this study, spermatogonial stem cell colonies on the gel phase of SACS were also examined by SEM. The results showed that spermatogonial cells were located in a three-dimensional arrangement and stem cells connection was clearly visible in the colonies of these cells ().
Figure 7. Connection between stem cells in SSCs colonies in SACS group. The dashed lines in the image show the connection of two cells in the colony.
Discussion
As indicated in the study, after isolation of cells from testicular tissue of non-obstructive azoospermia patients, they were cultured in DMEM in the presence of the 10% fetal bovine serum,1% Pen/Strep and 5% CO2 in a humidified atmosphere for 3 weeks to increase the number of cells. In this course, several colonies with different numbers and diameters appeared in the culture system. Positive immunocytochemistry reaction for two antibodies of GFR-α1 and ITGα6 confirmed the presence of SSCs in the culture system.
The expression of Oct4 was only observed in these cells by real-time PCR technique, but the expression of Stra8, SCP3, and Acrosin genes was not observed 3 weeks after culture. This indicates that the cells were not differentiated after three weeks of culture and most of them were spermatogonial stem cells. On the other hand, according to the study of Aponte et al. (2006), during the first week of culture, many, probably differentiating A spermatogonia entered apoptosis while others formed pairs and chains of A spermatogonia. The colonies started to appear that increased in size with time after 1 week of culture. Numbers of single (As) and paired (Apr) spermatogonia were significantly higher in culture system on days 15 and 25 and the ratio of As to Apr and spermatogonial chains (Aal) was also higher indicating enhanced self-renewal of the SSCs [Citation17]. Koruji et al. (2006) also showed that during different passages, most of the differentiated testicular cells that were at different stages of differentiation will be removed by changing the culture medium. So, the remaining cells are undifferentiated spermatogonial stem cells [Citation18].
After three weeks of culture, the cells were isolated and cultured in three different groups (SACS, gelatin and control) in the presence of 15% FBS accompanied by 50% conditioned medium in addition to 50% low-glucose DMEM supplemented by 1 µM retinoic acid (RA) for 2 weeks. Then, the colony formation and differentiation of spermatogonial stem cells of non-obstructive azoospermia patients were investigated in three groups. Various studies have reported the differentiation of spermatogonial cells in mice, but the functional characteristics of these cells in other mammalian species have not yet been determined.
In this study, for the first time, the number and diameter of human SSCs colonies was compared in three groups, under induction of RA, conditioned medium of OA patients and secretion of Sertoli cells on days 3, 7, 10 and 14 after culture. The nature of Sertoli cells was proven by immunocytochemistry of FSH receptor in the Sertoli cells. In agreement with previous studies, our results indicated that the Sertoli cells were positive for FSH receptor [Citation19]. Vimentin is a cytoskeleton filament which is found in epithelial cells. It is expressed in Sertoli cells from the 14th day of the fetus [Citation20]. Our results indicated a high percentage of positive vimentin cells in Sertoli cells.
Geens et al. (2011) identified that the conditioned medium of Sertoli cells included inductive factors that can represent an origin for in-vitro differentiation of germ cells [Citation21]. Based on the study of Ma et al. [Citation4], the mRNA expression of SCF, GDNF and BMP4 was significantly lower in Sertoli cells of NOA patients compared with OA patients.
Microarray analysis also showed that there were lower levels of expression of numerous genes (fold change), including ACAN (aggrecan), AIM1 (absent in melanoma), ANO4 (anoctamin 4), ATRNL1 (attractin-like 1), BDKRB1 (bradykinin receptor B1), CLIC2 (chloride intracellular channel 2), EMB (embigin), EPB41L3 (erythrocyte membrane protein band 4.1-like 3), FGL2 (fibrinogen-like 2), FLJ16171, HSPB8 (heat shock 22 kDa protein 8), IL7 (interleukin 7), MAP2(microtubule-associated protein 2), PAPPA2 (pappalysin 2) and SMC2 (structural maintenance of chromosomes 2) in Sertoli cells of NOA patients compared with OA patients.
In their study, protein expression of SCF, BMP4 and GDNF was also compared in OA and NOA patients. Immunofluorescence revealed that SCF, BMP4 and GDNF proteins were expressed at lower levels in Sertoli cells of NOA patients compared to Sertoli cells of OA patients. Furthermore, Western blots demonstrated that SCF, BMP4 and GDNF proteins were expressed at significantly lower levels in Sertoli cells of NOA patients.
Based on the previous studies, SCF, GDNF and BMP4 regulated the self-renewal and differentiation of SSCs in vitro and in vivo [Citation22,Citation23]. It has been demonstrated that SCF induces a mouse spermatogonial cell line to differentiate into meiotic spermatocytes and haploid round spermatids, as demonstrated by the formation of a synaptonemal complex and acrosome-like structure, respectively [Citation4].
Generally, the significantly lower or loss of transcripts and proteins of SCF, GDNF and BMP4 may cause abnormal SSC self-renewal and differentiation and eventually contribute to the deficient niche of SSCs in NOA patients. Therefore, in the present study, the conditioned medium of testicular cells belonging to OA patients was used for colony formation and differentiation of NOA SSCs in culture systems.
According to the results of this study, the number of colonies in SACS group was significantly higher than gelatin-coated plates group, which further corroborates the superiority of 3D over 2D culture systems is concerned [Citation24,Citation25]. One possible explanation is that there are many pores in soft agar system that mimic the testis environment and provide a basal, intraepithelial, and adluminal compartment to develop male germ cells. It possibly has better performance in imitating germ-Sertoli cells contact. It stimulates colony formation of SSCs during culture. These results are in agreement with those of Lee et al. that showed the re-aggregation of testicular cells in 3D collagen gel matrix reestablished close contact between germ cells and Sertoli cells [Citation26]. In other words, spermatogenesis requires complicated autocrine and paracrine regulation, as well as direct cell to cell interactions [Citation27].
In this study, a concentration of 10−6 M RA was used to stimulate the proliferation and differentiation of spermatogonial cells. According to previous studies, retinoids play an important role in the proliferation of germ cells. Retinoids are dose-dependent materials and a concentration of 10−6 M RA is needed to maintain spermatogenesis. RA with higher concentrations of 10−6 M inhibits cell proliferation and reduces meiosis process quantitatively [Citation28]. In fact, the expression of Stra8, which is essential for spermatogenesis, is directly related to the presence of RA [Citation29].
In contrast to our study, the study of Eslahi et al. (2013) showed that the number of mouse SSCs colonies significantly decreased in the first and third weeks of culture when cultured on poly-l-lactic acid (PLLA) nanofiber in comparison with the control group [Citation30]. In the study of Navid et al. (2017), the number of mouse spermatogonial colonies significantly increased in SACS culture system compared to two-dimensional culture system. Increasing the number of colonies in our study is in agreement with the study of Navid et al. [Citation31].
This study demonstrated that the diameter of colonies in SACS group was not significantly higher than the gelatin-coated plate group. One possible explanation is that SACS has only an important effect on increasing colony numbers in this timeframe; if agar concentration changes, the size of the pore in soft agar may change and the colonies may have more space to increase their diameter. It also might be that increasing the timeframe has a positive effect on the diameter of the colonies. In contrast, the results of Elhija et al. (2012) confirmed the presence of mouse spermatogonial cell colonies at different sizes on days 14 and 28 after culture on SACS group [Citation24]. In the study of Navid et al., the diameter of colonies significantly increased in SACS culture system compared to two-dimensional culture system [Citation32].
In this study, the expression of some genes was also evaluated after the culture. The results showed that Oct4 gene expression as a nuclear marker of undifferentiated cells was significantly lower in SACS group on day 7 after the culture compared to gelatin group. This decrease was observed on the 14th day after culture in the SACS group compared to the other two groups.
In previous studies, it has been shown that retinoic acid (RA) has a direct or indirect effect on the transcription of Oct4 gene. There is the relationship between induced differentiation of RA and down-regulation of Oct4 in the embryonic cell (EC) and early stem cell (ES) [Citation32–34]. Since, in this study, the retinoic acid as a differentiation factor has been added to all groups, the low-level expression of Oct4 in the SACS group may be explained that RA is more effective in this group and like the in vivo condition, the cells responded to this factor faster. Subsequently, the expression of Oct4 decreased in this group 7 days after the culture in comparison to gelatin and control groups. After 14 days of culture, the cells more self-renewed, proliferated and the expression of Oct4 increased in this group. Increasing of Oct4 in the SACS group is lower than the other two groups. It may be that in this group, the cells are removed from pluripotency and go toward differentiation. Comparison of differentiation genes between three groups can be a clear explanation of this issue.
According to previous studies, Stra8 gene promotes the entrance of spermatogonial cells to prophase I of meiosis during spermatogenesis [Citation34]. Considering the similarity of expression pattern and homology of amino acid sequences between mice and humans, probably human Stra8 also plays similar roles in human spermatogenesis [Citation35,Citation36]. In this study, the highest expression of Stra8 gene was observed in the SACS group 7 days after the culture. This is due to the effect of RA on spermatogonial cells in a 3D culture system, similar to in vivo condition, in which many cells start meiosis. This study was in agreement with the study of Snyder et al. (2010) that showed RA increases the expression of known differentiation factors (Stra8, Kit) and reduces the expression of Oct4 that associated with undifferentiated germ cells [Citation37]. The results of this study showed that on the 14th day after culture, the expression of Stra8 significantly decreased in two groups of SACS and gelatin. It may indicate that after 7 days of culture, the cells may start to enter into meiosis phase. Thus, on the 7th day, Stra8 expression increased in both SACS and gelatin groups, but on the 14th day after culture, the number of meiotic cells increased, so stra8 expression in these two groups decreased and the cells can be prepared for the next stage of meiosis. It can conclude that most of the cells are likely to enter the meiosis until the 14th day after culture and the expression of Stra8 decreases. It is also observed in the control group, although it is not significant compared to day 7.
The results of this study showed that the expression rate of Scp3 gene on the 7th and 14th day after culture was higher in the SACS group rather than gelatin and control groups. There is a significant difference in the SACS group in comparison to the gelatin group. This means that the speed of meiosis division is higher in the SACS group and following that, more cells are rapidly entering the next stages of primary spermatocyte divisions (pachytene, dipoltene and diakinesis). The expression of Scp3 gene on day 14 after culture was significantly higher in SACS group rather than gelatin group. It can be argued that the cells in the three-dimensional SACS culture system have more efficiency for starting meiosis division between days 7 and 14.
Acrosin is a serine protease that is used as a marker for spermatogenesis and it is in the acrosome of sperm as an enzyme passive zymogen. Acrosin gene is expressed in both pachytene spermatocyte and round spermatid [Citation38]. In this study, the highest expression of Acrosin gene was observed on day 14 after culture in SACS group, which was significantly higher than that of day 7. Although the expression of Acrosin was higher on day 14 after culture in both gelatin and control groups than day 7, there was no significant difference between two days in two groups. The study of Ventela et al. (2000) showed that low expression of Acrosin in mice was seen in pachytene spermatocytes and after meiosis completion, Acrosin is aggregated in the cytoplasm and lead to strong expression in round spermatid [Citation39]. So, higher expression of Acrosin in SACS group is probably related to a higher number of round spermatid on day 14.
In fact, it can be concluded that the cells in the SACS group started to develop faster during the time of this study. The high expression of Acrosin on this day in the SACS group may be due to the fact that the 3D culture system is more appropriate than other two groups for differentiation of spermatogonial stem cells. The results obtained in this study are in line with the results of Goharbakhsh et al. (2013), which showed that two-dimensional gelatin cannot support spermatogonial stem cell clusters in long-term culture [Citation40]. It can be concluded that, with the support of a medically conditioned medium derived from Sertoli cells of obstructive azoospermic patients, RA and the three-dimensional SACS (due to its greater similarity to the testicular structure in the body), a higher level of SSCs differentiation is observed compared to other studied groups.
Acknowledgements
I appreciate all co-authors who had full access to all of the data in the study and took responsibility for the integrity of the data and the accuracy of the data analysis.
Disclosure statement
No potential conflict of interest was reported by the authors.
Related Research Data
References
- Ning L, Goossens E, Geens M, et al. Spermatogonial stem cells as a source for regenerative medicine. Middle East Fertil Soc. 2012;17:1–7.
- Kubota H, Avarbock MR, Brinster RL. Growth factors essential for self-renewal and expansion of mouse spermatogonial stem cells. Proc Natl Acad Sci USA. 2004;101:16489–16494.
- De Rooij DG. The spermatogonial stem cell niche. Microsc Res Tech. 2009;72:580–585.
- Ma M, Yang S, Zhang Z, et al. Sertoli cells from non-obstructive azoospermia and obstructive azoospermia patients show distinct morphology, Raman spectrum and biochemical phenotype. Hum Reprod. 2013;28:1863–1873.
- Griswold MD. Interactions between germ cells and Sertoli cells in the testis. Biol Reprod. 1995;52:211–216.
- De Kretser D, Loveland K, Meinhardt A, et al. Spermatogenesis. Hum Reprod. 1998;13:1–8.
- Skinner MK. Cell-cell interactions in the testis. Endocr Rev. 1991;12:45–77.
- Huleihel M, Lunenfeld E. Regulation of spermatogenesis by paracrine/autocrine testicular factors. Asian J Androl. 2004;6:259–268.
- Yang S, Ping P, Ma M, et al. Generation of haploid spermatids with fertilization and development capacity from human spermatogonial stem cells of cryptorchid patients. Stem Cell Rep. 2014;3:663–675.
- Reijo R, Alagappan RK, Page D, et al. Severe oligozoospermia resulting from deletions of azoospermia factor gene on Y chromosome. The Lancet. 1996;347:1290–1293.
- Lee J-H, Gye MC, Choi KW, et al. In vitro differentiation of germ cells from nonobstructive azoospermic patients using three-dimensional culture in a collagen gel matrix. Fertil Steril. 2007;87:824–833.
- Edmondson R, Broglie JJ, Adcock AF, et al. Three-dimensional cell culture systems and their applications in drug discovery and cell-based biosensors. Assay Drug Dev Technol. 2014;12:207–218.
- Kim JB. Three-dimensional tissue culture models in cancer biology. Semin Cancer Biol. 2005;15:365–377.
- Khaitan D, Chandna S, Arya M, et al. Establishment and characterization of multicellular spheroids from a human glioma cell line; implications for tumor therapy. J Transl Med. 2006;4:12.
- Huleihel M, AbuElhija M, Lunenfeld E. In vitro culture of testicular germ cells: regulatory factors and limitations. Growth Factors. 2007;25:236–252.
- Mirzapour T, Movahedin M, Tengku Ibrahim T, et al. Evaluation of the effects of cryopreservation on viability, proliferation and colony formation of human spermatogonial stem cells in vitro culture. Andrologia. 2013;45:26–34.
- Aponte Pedro M, Soda T, van de Kant HJG, et al. Basic features of bovine spermatogonial culture and effects of glial cell line-derived neurotrophic factor. Theriogenology. 2006;65:1828–1847.
- Koruji M, Movahedin M, Mowla SJ, et al. Colony formation ability of frozen thawed spermatogonial stem cell from adult mouse. Iran J Reprod Med. 2006;5:109–115.
- Lakpour MR, Aghajanpour S, Koruji M, et al. Isolation, culture and characterization of human sertoli cells by flow cytometry: development of procedure. J Reprod Infertil. 2017;18:213.
- Scarpino S, Morena AR, Petersen C, et al. A rapid method of Sertoli cell isolation by DSA lectin, allowing mitotic analyses. Mol Cell Endocrinol. 1998;146:121–127.
- Geens M, Sermon KD, Van de Velde H, et al. Sertoli cell-conditioned medium induces germ cell differentiation in human embryonic stem cells. J Assist Reprod Genet. 2011;28:471–480.
- Nagano M, Ryu BY, Brinster CJ, et al. Maintenance of mouse male germ line stem cells in vitro. Biol Reprod. 2003;68:2207–2214.
- He Z, Kokkinaki M, Dym M. Signaling molecules and pathways regulating the fate of spermatogonial stem cells. Microsc Res Tech. 2009;72:586–595.
- Elhija MA, Lunenfeld E, Schlatt S, et al. Differentiation of murine male germ cells to spermatozoa in a soft agar culture system. Asian J Androl. 2012;14:285.
- Khajavi N, Akbari M, Abolhassani F, et al. Role of somatic testicular cells during mouse spermatogenesis in three-dimensional collagen gel culture system. Cell J. 2014;16:79.
- Lee J, Kanatsu-Shinohara M, Inoue K, et al. Akt mediates self-renewal division of mouse spermatogonial stem cells. Development. 2007;134:1853–1859.
- Siu MK, Cheng CY. Dynamic cross‐talk between cells and the extracellular matrix in the testis. Bioessays. 2004;26:978–992.
- Travers A, Arkoun B, Safsaf A, et al. Effects of vitamin A on in vitro maturation of pre-pubertal mouse spermatogonial stem cells. PLoS One. 2013;8:e82819.
- Zhou Q, Nie R, Li Y, et al. Expression of stimulated by retinoic acid gene 8 (Stra8) in spermatogenic cells induced by retinoic acid: an in vivo study in vitamin A-sufficient postnatal murine testes. Biol Reprod. 2008;79:35–42.
- Eslahi N, Hadjighassem MR, Joghataei MT, et al. The effects of poly L-lactic acid nanofiber scaffold on mouse spermatogonial stem cell culture. Int J Nanomedicine. 2013;8:4563
- Navid S, Abbasi M, Hoshino Y. The effects of melatonin on colonization of neonate spermatogonial mouse stem cells in a three-dimensional soft agar culture system. Stem Cell Res Ther. 2017;8:233.
- Schöler H, Hatzopoulos AK, Balling R, et al. A family of octamer‐specific proteins present during mouse embryogenesis: evidence for germline‐specific expression of an Oct factor. EMBO J. 1989;8:2543–2550.
- Okamoto K, Okazawa H, Okuda A, et al. A novel octamer binding transcription factor is differentially expressed in mouse embryonic cells. Cell. 1990;60:461–472.
- Bowles J, Koopman P. Retinoic acid, meiosis and germ cell fate in mammals. Development. 2007;134:3401–3411.
- Miyamoto T, Sengoku K, Takuma N, et al. Isolation and expression analysis of the testis-specific gene, STRA8, stimulated by retinoic acid gene 8. J Assist Reprod Genet. 2002;19:531–535.
- Pieri N, Souza A, Mançanares A, et al. Immunolocalization of proteins in the spermatogenesis process of canine. Reprod Dom Anim. 2017;52:170–176.
- Snyder EM, Small C, Griswold MD. Retinoic acid availability drives the asynchronous initiation of spermatogonial differentiation in the mouse. Biol Reprod. 2010;83:783–790.
- Kashiwabara S-i, Arai Y, Kodaira K, et al. Acrosin biosynthesis in meiotic and postmelotic spermatogenic cells. Biochem Biophys Res Commun. 1990;173:240–245.
- Ventelä S, Mulari M, Okabe M, et al. Regulation of acrosome formation in mice expressing green fluorescent protein as a marker. Tissue Cell. 2000;32:501–507.
- Goharbakhsh L, Mohazzab A, Salehkhou S, et al. Isolation and culture of human spermatogonial stem cells derived from testis biopsy. Avicenna J Med Biotechnol. 2013;5:54.