
Abstract
In terms to investigate the effect of low-intensity pulsed ultrasound (LIPUS) for differentiation of bone marrow mesenchymal stem cells (BMSCs) and the feasibility of simultaneously inducing into osteoblasts and vascular endothelial cells within the cell culture medium in which two inductive agents are added at the same time with or without LIPUS. Cells were divided into a non-induced group, an osteoblast-induced group, a vascular endothelial-induced group, and a bidirectional differentiation-induced group. Each group was further subdivided into LIPUS and non-LIPUS groups. The cell proliferation in each group was measured by MTT assay. Cell morphological and ultrastructural changes were observed by inverted phase contrast microscopy and transmission electron microscopy. The differentiation of BMSCs was detected by confocal microscopy, flow cytometry and quantitative RT-PCR. Results demonstrated that both osteoblast and vascular endothelial cell differentiation markers were expressed in the bidirectional differentiation induction group and early osteogenesis and angiogenesis appeared. The cell proliferation, differentiation rate and expression of osteocalcin and vWF in the LIPUS groups were all significantly higher than those in the corresponding non-LIPUS group (p < .05), suggesting LIPUS treatment can promote the differentiation efficiency and rate of BMSCs, especially in the bidirectional differentiation induction group. This study suggests the combination of LIPUS and dual-inducing agents could induce and accelerate simultaneous differentiation of BMSCs to osteoblasts and vascular endothelial cells. These findings indicate the method could be applied to research on generating vascularized bone tissue with a shape and function that mimics natural bone to accelerate early osteogenesis and angiogenesis.
Introduction
Large size bone defects, which can be caused by trauma and tumour resection, etc. affect millions of people. Treatment methods for bone defects can be categorized as autograft, allograft and xenograft [Citation1]. However, all these methods have some disadvantages [Citation2]. Therefore, researchers began to pay attention to the artificial bone as a substitute [Citation3,Citation4]. However, artificial bone has poor mechanical properties and conductivity and a single function [Citation5], unlike the properties (e.g. mechanical strength and microstructure) and functions of natural bones. The lack of blood vessels in engineered tissues can lead to spatiotemporal gradients in oxygen and nutrients, accumulation of waste products and negative biological events at the core of the scaffold [Citation6]. Therefore, the construction of stable blood vessels is a fundamental challenge for tissue engineering in regenerative medicine [Citation7]. Recently, many strategies have been applied to enhance the establishment of vascularization within engineered bones, such as directing cell behavior through growth factor delivery [Citation8], applying co-culturing systems [Citation9], mechanical stimulation [Citation10], microfabrication techniques with biomaterials [Citation11] and 3D printing [Citation12]. However, challenges remain due to the inability to reproduce an engineered bone replacement that truly mimics natural bone with well-formed and stable blood vessels [Citation1]. Therefore, it is necessary to find a new scenario for constructing vascularized tissue-engineered bone.
Thus, we performed this study. First, in agreement with the opinion of Barabaschi [Citation6], we believe that cell-based approaches offer a more biologically relevant strategy for the formation of vascularized bone tissues. So, the bone marrow mesenchymal stem cells (BMSCs) were chosen as the preferred seed cells in this study. Second, the induction of BMSCs was changed from single osteogenesis induction to simultaneous osteogenesis and vascular endothelium bidirectional induction. BMSCs are common precursor cells of each cell line in the bone marrow stroma and they are affected by the totipotent development programme as embryonic stem cells (ESCs). For in vitro differentiation experiments, differentiated cells of different germ layers are often present at the same time [Citation13,Citation14]. In this study, we utilized this feature to simultaneously induce the differentiation of BMSCs into osteoblasts and vascular endothelial cells. To achieve this goal, we added vascular endothelial growth factor (VEGF), which plays a fundamental role in promoting angiogenesis when BMSCs are induced to form bone tissues. Finally, low-intensity pulsed ultrasound (LIPUS) was used to promote the simultaneous bidirectional differentiation of BMSCs. It has been reported that the differentiation rate of BMSCs to osteoblasts is low [Citation15,Citation16], which may be one of the reasons that treatment of bone defects using BMSCs alone is not always successful. So, the feasible induction conditions in vitro should be established and the induction efficiency should be improved for clinical application [Citation17]. LIPUS may be a new and effective method. LIPUS is used to promote bone healing, which mechanisms perhaps by promoting different processes from several aspects during each phase of the healing process [Citation18]. One most important mechanism is LIPUS can promote the differentiation of stem cells into osteoblasts [Citation19–21] through increases in alkaline phosphatase (ALP), osterix (OSX), receptor activator of nuclear factor-kappa B ligand (RANKL), and runt-related transcription factor 2 (RUNX2), and decreases in osteoprotegerin (OPG) [Citation22]. BMP signaling pathway is showed to stimulate enhanced osteogenic differentiation of stem cells [Citation23]. In the meantime, the angiogenesis enhancement effects of LIPUS was reported [Citation24]. Can LIPUS have synergy with an induced condition added with an osteogenic and endothelial inductive agent? The problem will resolve with this study. LIPUS was applied to promote the efficiency and rate of BMSCs differentiation into osteoblasts and vascular endothelial cells simultaneously.
This study focused on the possibility of simultaneous bidirectional differentiation of BMSCs and evaluated whether the synergy of LIPUS and dual inducing agents can effectively improve the efficiency of BMSCs differentiation in order to find a viable new method for the future generation of vascularized engineered bones.
Methods
Cell culture
BMSCs derived from 3–6 weeks Sprague Dawley (SD) rat bone marrow were purchased from the stem cell bank of Chinese Academy of Sciences (Beijing, China). The primary BMSCs were seeded in a 75 T culture flask (NEST) at a concentration of 3–4 × 10⁵/ml and were cultured in complete modified eagle medium supplemented with 10% foetal bovine serum (FBS) at 37 °C under an atmosphere containing 5% CO2. Culture medium was changed every 2–3 days and the cells were passaged every 3–4 days. The cells were used for experiments after being passaged twice. The osteogenic induction agents were dexamethasone, L-ascorbic acid and sodium beta-glycerophosphate, which were purchased from Sigma Co. (St. Louis, MO, USA), while the vascular endothelial inducible factor was VEGF (Perpotech Inc, NJ, USA). When cell confluence reached 80%, the cells were trypsinized and seeded in six-well plates or confocal microscope chambers at a concentration of 5 × 10⁴/well. Cells in LC and NLC groups were used as controls, without induction agent treatment. Cells in LO/NLO, LV/NLV, and LD/NLD groups were treated with osteogenic induction factor (10−8 mol/l dexamethasone, 50 μmol/L L-ascorbic acid and 0.01 mol/l β-Glycerophosphate disodium), VEGF (50 ng/mL), and osteogenic induction factor + VEGF, respectively. The images of each group were acquired from four randomly selected wells in the group. All the test items were repeated 3 times.
LIPUS treatment
Based on previous studies [Citation25,Citation26] and our pilot experiment, the cells in the LIPUS treated groups (LC, LO, LV and LD) were treated with low-intensity pulsed ultrasound (Chongqing Haifu Medical Technology Co., Ltd., Chongqing, China), setting the frequency at 0.6 MHz, repeat frequency at 1 kHz, duty cycle at 20% and intensity at 30 mW/cm2. The cells were exposed to 30 mW/cm2 treatment for 20 min everyday and for 13 consecutive days. The cells in the non-LIPUS groups (NLC, NLO, NLV, and NLD groups) were exposed to the same method but the power was off.
Inverted phase contrast microscopy
Samples were randomly selected for morphological observation everyday and images were taken using an Olympus IX-70 inverted phase contrast microscope (Olympus Co., Tokyo, Japan). Four wells of each group of cells were randomly selected for observation. The differentiation of each group of cells was analyzed through cell morphological changes.
Transmission electron microscopy
At the 5th, 9th and 13th day, cells in each group (1 × 10⁶ cells) were collected and prefixed with 4% glutaraldehyde at 4 °C overnight. The cells were then post-fixed with 1% osmium acid for 1 h at 4 °C. Then, the cells were dehydrated with a gradient of acetone. After being embedded, sliced and dyed, the changes of cell ultrastructure were observed by a Hitachi-7500 transmission electron microscopy (Hitachi Ltd., Tokyo, Japan).
MTT assay
The samples were randomly selected for MTT assays on the 0, 1st, 3rd, 5th, 7th, 9th, 11th and 13th day. Four wells of each group of cells were randomly selected to receive 100 μL MTT solution (5 mg/mL in PBS, pH = 7.4) and further incubated for 4 h. Then, the supernatant was discarded and 1500 μL DMSO was added to each well and vibrated for 10 min. The OD value of each well was measured by a Bio-Tek ELX800 automatic plate reader (BioTek Instruments, Inc.,Vermont,Vermont, USA), and cell growth curves were plotted.
Laser confocal microscopy
On the 5th, 9th and 13th day, four wells of each group of cells were randomly selected for image acquisition. Immunofluorescence staining was performed and samples were observed by a LEICA TCS SP2 laser scanning confocal microscope (Leica, Wetzlar, Germany) to determine their differentiation. Osteocalcin, which showed green fluorescence, was chosen as the osteogenic differentiation marker. Von Willebrand factor (vWF), which showed red fluorescence on the cell membrane, was chosen as the marker of vascular endothelial differentiation. DAPI, which showed blue fluorescence, was chosen as the nuclear marker. The method is as follows: the cells were rinsed with PBS for 3 times, 3 min each time, fixed with 4% paraformaldehyde for 15 min and rinsed with PBS for 3 times, 3 min each time. Then, the cells were treated with 0.5%Triton X-100 solution buffered by PBS for 20 min at room temperature. The cells were rinsed again with PBS for 3 times, 3 min each time and treated with 5% bovine serum albumin BSA at room temperature for 10–20 min. The next step was the cells were incubated in first primary antibody (Osteocalcin, rabbit antigen and vWF, goat antigen) at 4 °C for 12 h, then rinsed 3 times with PBS and for 3 min each time and incubated in secondary antibody (FITC, goat antigen and CY3, rabbit antigen) at 37 °C for 30 min, then rinsed 3 times with PBS and for 3 min each time. The last step was the calls were treated with DAPI for 5 min and rinsed 3 times with PBS and for 5 min each time. After the above steps, the cells could be observed under the laser scanning confocal microscope.
Flow cytometry
On the 5th, 9th and 13th day, flow cytometry was performed to detect surface antigens. Approximately 1 × 10⁶ cells were collected for each sample. Positive expression of the osteogenic differentiation marker osteocalcin showed green fluorescence, while positive expression of the vascular endothelial differentiation marker vWF showed red fluorescence. Cell differentiation rate = the number of fluorescent cells/the total number of detected cells × 100%.
Quantitative Real-Time PCR
On the 5th, 9th and 13th day, quantitative RT-PCR was performed to analyze expression of the osteocalcin and vWF genes. Approximately, 1 × 10⁶ cells were collected for each sample. The primers were as follows: osteocalcin, forward primer 5′CGGCGCTACCTCAACAATGGAC-3′ and reverse primer 5′CGTCCATACTTTCGAGGCAGAGA-3′; and, vWF, forward primer 5′CCGCACGCCAACCTCAAAC-3′ and reverse primer 5′CCGCACGCCAACCTCAAAC-3′.
Statistical analysis
The statistical analysis was performed with the statistical software SPSS (Version 19.0, IBM, Armonk, NY, USAVersion 19.0, IBM, Armonk, NY, USA). Experiments were repeated three times. All data were expressed as the mean ± standard deviation. A one-way analysis of variance (ANOVA) was used for comparison among the eight groups. The F value was significant and the least significant difference method was used for comparison between two groups. The p < .05 indicates a significant difference.
Results
Cell grouping
In this study, BMSCs were divided into eight groups: LC and NLC groups, where L represented LIPUS, and NL represented non-LIPUS (same as below); LO and NLO groups, where O represented complete medium with osteogenic induction factor; LV and NLV groups, where V represented complete medium with VEGF; LD and NLD groups, where D represented complete medium with osteogenic induction factor and VEGF at a 1:1 ratio (referred to as bidirectional inducer below). Cells in the LC and NLC groups were used as controls, without induction agent treatment.
Cell proliferation and differentiation initiation time
To determine the proliferation and differentiation initiation time of BMSCs, MTT assessment was performed to plot the growth curve of cells. The cell proliferation of LIPUS groups (LC, LO, LV, and LD groups) was significantly higher than that of non-LIPUS groups (NLC, NLO, NLV, and NLD groups) (p < .05) for some time, such as from 3 days to 11 days (LC vs. NLC), from 3 days to 9 days (LO vs. NLO), from 3 days to 9 days (LV vs. NLV) and from 3 days to 7 days (LD vs. NLD) (). The cell proliferation in all LIPUS groups reached a plateau after 7 days (except the LC group). The proliferation tended to be stable and cells began to differentiate. On the other hand, cell proliferation in the non-LIPUS groups plateaued after 9 days (). This finding suggests that the cell differentiation time of the LIPUS group was earlier than that of the non-LIPUS group.
Figure 1. MTT assays to evaluate the proliferation of BMSCs. (A–D) show the growth curves and comparisonof the LC and NLC groups, LO and NLO groups, LV and NLV groups and LD and NLD groups, respectively. *p < .05 and **p < .01.
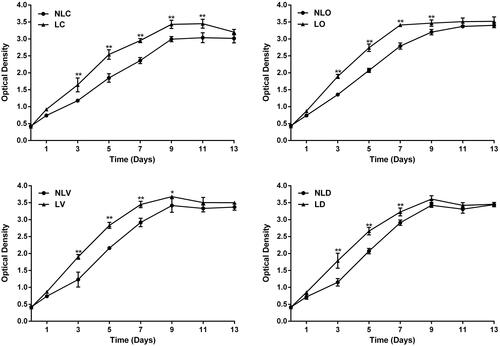
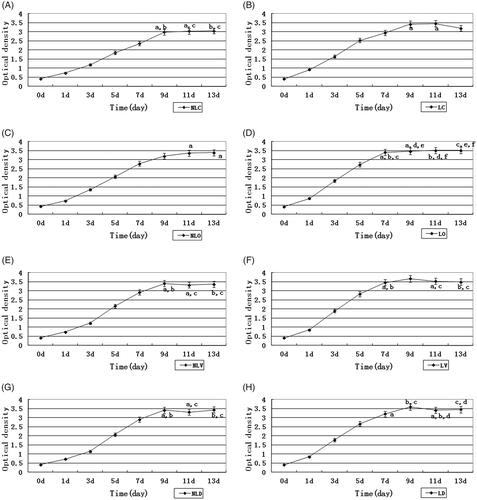
Figure 2. MTT assays to detect the proliferation of BMSCs. (A–H) show the growth curves of the NLC, LC, NLO, LO, NLV, LV, NLD and LD groups, respectively. Comparison of OD value between 2 days in every group was taken. We would mark the same character at the side of OD value if there was not a significant difference between two days, p >.05. No significant difference means that BMSCs proliferation slows down and BMSCs might reach a plateau.
Morphological and ultrastructural changes
To trace the morphological and ultrastructural changes of the BMSCs, the cells were observed by inverted microscope and transmission electron microscope, respectively ( and Citation4). In the LC group, cell accumulation appeared and the ultrastructure of cells showed myeloid bodies and matrix vesicles on the 9th day. However, little cell accumulation and few myeloid bodies appeared in the NLC group on the 13th day. In the LO group, myeloid bodies appeared in cells on the 5th day, then cells accumulated and calcified to form a "rod-like" structure on the 9th day and the "rod-like" structures interconnected with each other to form a porous trabecular bone-like structure on the 13th day. However, in the NLO group, myeloid bodies were found on the 9th day. Only a small amount of "rod" accumulation was observed on the 13th day, but the porous trabecular bone-like structure was not observed. In the LV group, W-P bodies were found on the 9th day. The cell groupings formed "ring-like" structures, as observed under the microscope on the 13th day. On the other hand, desmosomes were found in the cells of the NLV group on the 13th day, but no "ring-like" cell population was observed.
Figure 3. Morphological changes of BMSCs in each group were observed by inverted phase contrast microscope (40×; the scale bar represents 50 µm). The arrows in LC group at day 9 and day 13 indicate cell accumulation. The arrows in NLO (day 9 and day 13), LO (day 9), NLD (day 9 and day 13) and LD (day 9) groups indicate “rod-like” structures. The arrows in LO (day 13) and LD (day 13) groups indicate porous trabecular bone structures, suggesting BMSCs differentiate into osteoblasts. The arrows in LV (day 13) group indicate “ring-like” cell populations, suggesting BMSCs differentiate into vascular endothelial cells and have a tendency to form microvascular structures.
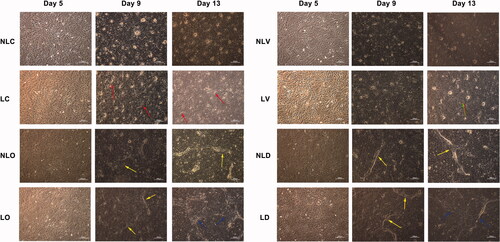
In the LD group, desmosomes were found on the 5th day and the cells were tightly connected, and "rod-like" cell accumulations were observed on the 9th day under the microscope. On the 13th day, W-P bodies and dilated endoplasmic reticulum were found in some cell and the porous trabecular bone-like structure was observed, but no "ring-like" cell population was observed. Meanwhile, in the NLD groups, little dilated endoplasmic reticulum and few myeloid bodies were observed in the cells on the 5th day. Desmosomes connections and "rod-like" accumulations appeared on the 9th day. On the 13th day, microvilli were found, but no trabecular structures were observed. The results showed that marked ultrastructural changes of BMSCs towards osteogenic and vascular endothelial cells occurred and the differentiation of the LIPUS group was earlier than that of the non-LIPUS group. Compared to the LD and NLD groups, the marked structures of osteogenic and vascular endothelial differentiation presented simultaneously when bidirectional inducer was added. This observation demonstrates that BMSCs can partially differentiate into osteoblasts and partially differentiate into vascular endothelial cells at the same time. Although the morphological changes of BMSCs appeared later, the shapes and appearance time of bone-like trabecular structures were similar to those of the LO group after LIPUS treatment.
Expression of osteocalcin and vWF
A laser scanning confocal microscope was used to observe the expression of osteogenic markers (osteocalcin, green), vascular endothelial markers (vWF, red) and nuclear staining (DAPI, blue) in BMSCs () There was only green fluorescence in the LC and NLC groups. Cell accumulation appeared in the LC group on the 13th day. The cells of the LO and NLO groups expressed green fluorescence. In the LO group, cell accumulation appeared on the 9th day and the green fluorescent-positive cells aggregated to form a regular "lamellar-like" structure on the 13th day. Cell accumulation did not appear in the NLO group. The cells of the LV and NLV groups expressed red fluorescence. On the 13th day, the red fluorescent-positive cells in the LV group aggregated to form a “ring-like” structure, but no such phenomenon was observed in the NLV group. In the LD group, yellow fluorescence was observed on the 5th day, which indicates the simultaneous expression of osteogenic and vascular endothelial markers. Cell accumulation appeared on the 9th day and increased on the 13th day; red fluorescent “ring-like” structure was observed on the 13th day. In the NLD group, partly yellow fluorescence expression and cell accumulation were observed on the 13th day. These results further confirmed that BMSCs showed different differentiation directions in a cell culture medium when stimulated by different inducing agents. LIPUS could initiate BMSCs differentiation earlier and promote rapid formation of bone-like tissue and microvascular structure.
Differentiation efficiency of BMSCs
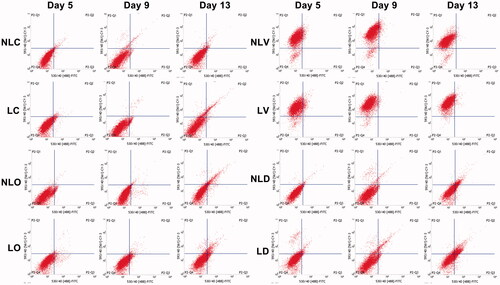
To determine the differentiation of BMSCs, flow cytometry was performed. The cell differentiation rates of all LIPUS groups were higher than those of non-LIPUS groups at all detection times and the difference has statistical significance (p < .05, and Citation7). The differentiation rate of each group increased with time. On the 13th day, the increase in the differentiation rate of the LD group was 10.02% more than that of the NLD group.
These results indicated that LIPUS could promote the differentiation of BMSCs. Especially in the bidirectional differentiation group, the promoting effect was the most significant (p < .05).
Expression of osteocalcin and vWF genes
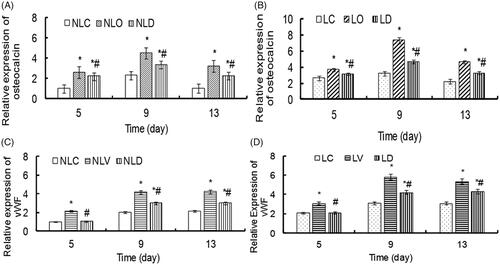
To determine the effects of bidirectional induction and LIPUS on the gene expression of BMSCs, quantitative PCR was used to measure the expression of osteocalcin and vWF genes. Except a comparison between the LIPUS and non-LIPUS groups showed that there was no statistical significance for the expression differences of vWF in the LO and NLO groups or those of osteocalcin in the LV and NLV groups on the 5th day (p > .05). The expression levels of the osteocalcin and vWF genes were significantly higher in all LIPUS groups than in the corresponding non-LIPUS groups (all p < .05, ).
Analysis of the osteogenesis-inducing groups (LO, NLO, LD and NLD) and the vascular endothelial-inducing groups (LV, NLV, LD and NLD) showed that the expression differences of osteocalcin among all groups had statistical significance at all detection times (p < .05), while the expression differences of vWF had statistical significance among all groups (p < .05) except between the NLC and NLD groups and the LC and LD groups on the 5th day (p > .05). The relative expressions (relative to the NLC group) levels of osteocalcin in the LD groups and vWF in the LV groups, which were higher than those in other groups, reached a peak on the 9th day ().
These results suggest that the combination of the two inducing agents with LIPUS could alter the differentiation efficiency and rate of BMSCs.
Discussion
In this study, the BMSCs differentiations within the cell culture medium in which two inductive agents are added at the same time and the effect of LIPUS to BMSCs differentiation were detected.
The myeloid bodies, dilated endoplasmic reticulum, and matrix vesicles in BMSCs were observed in the cells of the bidirectional induction group under the electron microscope, indicating that the cells were differentiated into osteoblasts. Meanwhile, W-P bodies and desmosomes etc. were found in the same specimen (), suggesting that the cells were differentiated into vascular endothelium and formed microvessels at the early angiogenesis stage. The confocal microscope images also showed that cell accumulation and red "ring-like" structures appeared at the 13th day in the bidirectional induction group (). The cell accumulation was the mineralized bone matrix, while the red "ring-like" structures might be new microvessels. These results agree with the reported results that biomarkers of osteoblasts and vascular endothelial cells [Citation27,Citation28] appeared when BMSCs were induced to differentiate alone, confirming our hypothesis that construction of a bidirectional induction cell culture medium for BMSCs culture can achieve bidirectional differentiation simultaneously. In the fluorescence quantitative PCR experiment, the expression peak of osteocalcin in the bidirectional induction group was detected on day 9 and that of vWF was detected on day 13 (). This finding is consistent with the laser confocal microscope results, indicating osteogenic differentiation may be earlier than vascular endothelial differentiation in the bidirectional induction of BMSCs. Previously, investigators have constructed animal models of bone defects that deliver osteogenesis-inducing agents and vascular endothelial-inducing agents simultaneously or sequentially to animals [Citation29,Citation30]. However, incubating BMSCs with two inducing agents simultaneously has not been reported. The results of this study can further explain the cytological mechanisms of these animal experiments.
Figure 4. The ultrastructural changes of BMSCs were detected by transmission electron microscopy (10000×). The arrows in the LC (day 9 and day 13), NLO (day 9 and day 13), and LO (day 5, day 9 and day 13) groups indicate myeloid bodies. The arrows indicate matrix vesicles and the arrows indicate the dilated endoplasmic reticulum, suggesting BMSCs differentiated into osteoblasts. The circled regions were zoomed in on at the bottom left corner (square box). The arrows in the NLV (day 13), NLD (day 9) and LD (day 5) groups indicate desmosome connections. The arrows in the LV (day 9 and day 13) and LD (day 13) groups indicate W–P bodies. The arrows in the NLD (day 13) group indicate microvilli. The arrows in LD (day 9) indicate tight connections, suggesting BMSCs differentiated into vascular endothelial cells and formed microvascular-like structures.
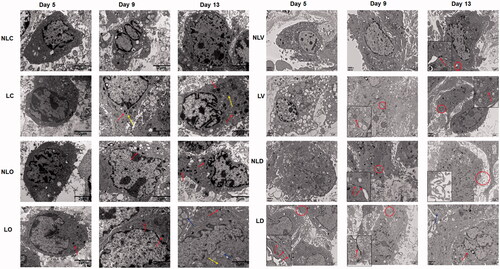
Figure 5. The expression of osteocalcin and vWF in BMSCs was detected by confocal microscope (200×; the scale bar represents 100 µm). The arrows in LC (day 13), LO (day 9 and day 13 left), NLD (day 13) and LD (day 9 and day 13) groupsin LC (day 13), LO (day 9 and day 13 left), NLD (day 13) and LD (day 9 and day 13) groups indicate cell accumulation. The arrows in NLO (day 13) and LO (day 13 right) groupsin NLO (day 13) and LO (day 13 right) groups indicate “lamellar-like” arrangement of cells, suggesting BMSCs differentiated into osteoblasts. The rings in LV (day 13) and LD (day 13) groupsin LV (day 13) and LD (day 13) groups in LV (day 13) and LD (day 13) groupsin LV (day 13) and LD (day 13) groups indicate “ring-like” structures, suggesting BMSCs differentiated into endothelial cells.
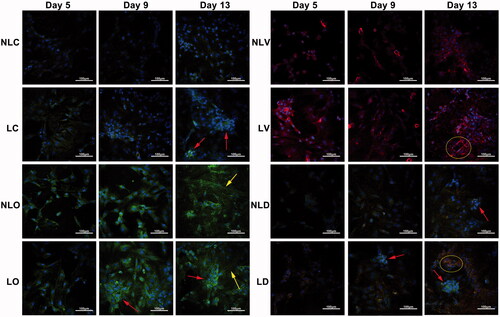
Figure 6. The expression of osteocalcin and vWF in BMSCs was detected by flow cytometry. The upper left quadrant indicates the number of cells positively expressed vWF. The upper right quadrant indicates the number of positive cells simultaneously expressed vWF and osteocalcinexpressed vWF and osteocalcin. The lower left quadrant indicates the number of cells expressed neither vWF nor osteocalcin, and the lower right quadrant indicates the number of positive cells expressed osteocalcin.
We further examined the promoting effect of LIPUS on the differentiation of BMSCs. It was reported that cell differentiation and proliferation do not coexist [Citation31]. The proliferation of cells is dominant in the normal culture medium, so cells do not differentiate and can maintain the original status of stem cells. The stem cells in the culture medium added with the induced agent were inhibited cell division and started to differentiate [Citation32]. In other words, the proliferation and differentiation of BMSCs are two opposite states, as cell differentiation is inhibited during the proliferation process and vice versa. Our results revealed that cell proliferation in the LIPUS group reached a plateau earlier (), suggesting the differentiation of cells starts earlier in the LIPUS group than in the corresponding non-LIPUS group. In addition, LIPUS promoted most BMSCs to enter the differentiation stage at least 2 days earlier. The plateau of the LC group was on the 9th day. We analyzed that LIPUS might have more influence on the proliferation of BMSCs at this time mainly because of lacking inducer. Comparing the differentiation efficiency of each group (), it was found that LIPUS could significantly promote BMSCs differentiation time, suggesting that LIPUS could promote BMSCs differentiation continuously. Analysis of differentiation-related gene expression found that the expression levels of the two genes were both higher in the LIPUS group than in the corresponding non-LIPUS group (). The results showed that LIPUS could significantly promote the differentiation of BMSCs under bidirectional induction conditions. These results might be because the mechanical stress of LIPUS resulted in tension on cells, causing changes in the cytoskeleton and thereby affecting cellular functions. Another reason might be due to the effects of LIPUS on transmembrane channels and on the transport of ions, resulting in cell response changes [Citation25,Citation33].
Figure 7. Analysis of the differentiation rate of BMSCs. A–D show the differentiation rates of the NLC and LC groups, NLO and LO groups, NLV and LV groups, NLD and LD groups, respectively. The differentiation rates of the LIPUS group were obviously higher than those in the non-LIPUS group. LIPUS groups (LC, LO, LV, and LD groups) vs. non-LIPUS groups (NLC, NLO, NLV, and NLD groups), *p < .05.
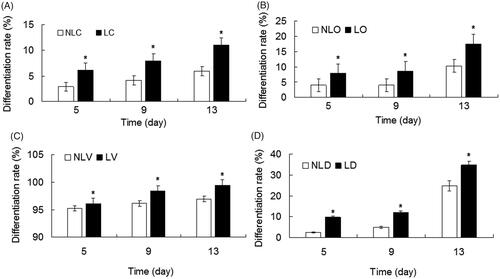
Figure 8. The relative expression levels of osteocalcin and vWF in BMSCs of each group were detected by quantitative real-time PCR and compared. A–D show, respectively the relative expression levels of osteocalcin in the NLC and LC groups, NLO and LO groups, NLV and LV groups and NLD and LD groups. E–H show respectively the relative expression levels of vWF in the NLC and LC groups, NLO and LO groups, NLV and LV groups and NLD and LD groups. LIPUS groups (LC, LO, LV, and LD groups) vs. non-LIPUS groups (NLC, NLO, NLV, and NLD groups), *p < .05.
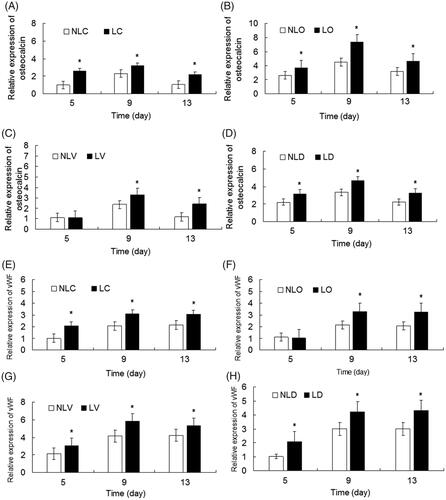
Figure 9. The relative expression levels of osteocalcin and vWF in BMSCs of each group were detected by quantitative real-time PCR. The relative gene expression of osteoblast inducer groups (LO, NLO, LD and NLD groups) and endothelial cell inducer groups (LV, NLV, LD and NLD groups) in the LIPUS and non-LIPUS groups were compared. (A) The relative expression of osteocalcin in the NLC, NLO and NLD groups. Compared with the NLC group, *p < .05. Compared with the NLO group, #p < .05. (B) The relative expression of osteocalcin in the LC, LO and LD groups. Compared with the LC group, *p < .05. Compared with the LO group, #p < .05. (C) The relative expression of vWF in the NLC, NLV and NLD groups. Compared with the NLC group, *p < .05. Compared with the NLV group, #p < .05. (D) The relative expression of vWF in the LC, LV and LD groups. Compared with the LC group, *p < .05. Compared with the LV group, #p < .05.
We found three interesting phenomena: first, some cells in the bidirectional induction group showed yellow fluorescence in the laser confocal microscope analysis (), which means that a cell can differentiate into an osteogenic and a vascular endothelium cell at the same time. This phenomenon was also confirmed in the flow cytometric assays. Second, the differentiation efficiency of BMSCs to the vascular endothelial direction was more than 90% in the vascular endothelial differentiation-induced cell culture medium (), but the highest differentiation efficiency of BMSCs was only 34.79% in the bidirectional induction group (), which means the rate of BMSCs differentiation to vascular endothelium decreased after bidirectional induction agents were added. Third, the efficiency and rate of BMSCs differentiation in response to bidirectional induction decreased in the first few days after induction (). Especially, in the NLD group, the differentiation rates were 2.4 ± 0.05% and 5.03 ± 0.17% on the 5th and 9th days, respectively, and sharply increased to 24.77 ± 0.3% on the 13th day. LIPUS significantly increased the efficiency and rate of BMSCs differentiation in the early stage of biphasic induction, from 9.73 ± 0.27% on the 5th day to 34.79 ± 1.21% on the 13th day (). We analyzed these three phenomena. At present, the specific mechanism of stem cell differentiation is still under study. Some researchers [Citation34,Citation35] believe that the reasons for differentiation may be related to the environment, cell contact, cell fusion and other factors. The above three phenomena also confirmed that stem cell differentiation and differentiation ratio were affected by environmental (induction conditions) changes. BMSCs have a variety of directional differentiation tendencies and cell phenotypes at the same time in the process of differentiation. When stimulated by corresponding induction agents (in this study, the ratio of osteogenic and vascular endothelial induction agents was 1:1), BMSCs have a tendency to differentiate into two directions simultaneously in one cell; hence, yellow (mixed of red and green light) fluorescence could be detected by confocal microscope. This differentiation is only an intermediate process, as the two trends continue to compete with each other, until the 9th-day osteogenic differentiation dominated the competition, while vascular endothelial cell differentiation was inhibited. This finding explains the phenomenon in which cell differentiation was temporarily stalled during the first few days and then dramatically accelerated after 13 days when the final differentiation direction was determined with the continuous effects of the two inducers.
The above results were obtained at a 1: 1 ratio of the two inducers, so although it could prove that BMSCs could differentiate bidirectional in a cell culture medium at the same time, the differentiation ratio was not ideal. In the future, the proportion of the inducers can be adjusted to regulate the ratio at which BMSCs differentiate in different directions, and thus, vascularized bone tissues that are more similar to the natural structure may be obtained. In addition, whether the currently used LIPUS frequency, intensity and other parameters are the most appropriate still needs to be studied in depth.
Conclusions
In summary, BMSCs can differentiate into osteogenic and vascular endothelial cells at the same time in a bidirectional induction cell culture medium. LIPUS can increase the efficiency and rate of BMSCs differentiation. Especially under the bidirectional induction condition, LIPUS can obviously enhance the differentiation efficiency and rate of BMSCs, accelerating early osteogenesis and angiogenesis.
Disclosure statement
The authors report no conflicts of interest and are responsible for the content and writing of the manuscript.
Additional information
Funding
References
- Nguyen LH, Annabi N, Nikkhah M, et al. Vascularized bone tissue engineering: approaches for potential improvement. Tissue Eng. Part B Rev. 2012;18:363–382.
- Goldstein SA. Tissue engineering: functional assessment and clinical outcome. Ann N Y Acad Sci. 2002;961:183–192.
- Dosier CR, Uhrig BA, Willett NJ, et al. Effect of cell origin and timing of delivery for stem cell-based bone tissue engineering using biologically functionalized hydrogels. Tissue Eng Part A. 2015;21:156–165.
- Keeney M, Chung MT, Zielins ER, et al. Scaffold-mediated BMP-2 minicircle DNA delivery accelerated bone repair in a mouse critical-size calvarial defect model. J Biomed Mater Res. 2016;104:2099–2107.
- Fedorovich NE, Alblas J, Hennink WE, et al. Organ printing: the future of bone regeneration? Trends Biotechnol. 2011;29:601–606.
- Barabaschi GDG, Manoharan V, Li Q, et al. Advances in experimental medicine and biology: engineering pre-vascularized scaffolds for bone regeneration. Cham: Springer; 2015.
- Koike N, Fukumura D, Gralla O, et al. Tissue engineering: creation of long-lasting blood vessels. Nature. 2004;428:138.
- Berendsen AD, Olsen BR. Regulation of adipogenesis and osteogenesis in mesenchymal stem cells by vascular endothelial growth factor A. J Intern Med. 2015;277:674–680.
- Fu WL, Xiang Z, Huang FG, et al. Coculture of peripheral blood-derived mesenchymal stem cells and endothelial progenitor cells on strontium-doped calcium polyphosphate scaffolds to generate vascularized engineered bone. Tissue Eng Part A. 2015;21:948–959.
- Liu C, Cui X, Ackermann TM, et al. Osteoblast-derived paracrine factors regulate angiogenesis in response to mechanical stimulation. Integr Biol. 2016;8:785–794.
- Seo HR, Jeong HE, Joo HJ, et al. Intrinsic FGF2 and FGF5 promotes angiogenesis of human aortic endothelial cells in 3D microfluidic angiogenesis system. Sci Rep. 2016;6:28832.
- Dadhich P, Das B, Pal P, et al. A simple approach for eggshells based 3D printed osteoinductive multi-phasic calcium phosphate scaffold. ACS Appl Mater Interfaces. 2016;8:11910–11924.
- Lee PT, Li WJ. Chondrogenesis of embryonic stem cell-derived mesenchymal stem cells induced by TGFβ1 and BMP7 through increased TGFβ receptor expression and endogenous TGFβ1 production. J Cell Biochem. 2017;118:172–181.
- Brown PT, Handorf AM, Jeon WB, et al. Stem cell-based tissue engineering approaches for musculoskeletal regeneration. Curr Pharm Des. 2013;19:3429–3445.
- Wei M, Li S, Le WD. Nanomaterials modulate stem cell differentiation: biological interaction and underlying mechanisms. J Nanobiotechnol. 2017;15:75.
- Chang W, Kim R, Park SI, et al. Enhanced healing of rat calvarial bone defects with hypoxic conditioned medium from mesenchymal stem cells through increased endogenous stem cell migration via regulation of ICAM-1 targeted-microRNA-221. Mol Cells. 2015;38:643–650.
- Li QQ, Wu ZQ, Zhang LJ. Directional differentiation of bone marrow mesenchymal stem cells. Chin. J. Tissue Eng. Res 2017; 21:4082–4087.
- Zhang N, Chow SK, Leung KS, et al. Ultrasound as a stimulus for musculoskeletal disorders. J Orthop Translat. 2017;9:52–59.
- Angle SR, Sena K, Sumner DR, et al. Combined use of low-intensity pulsed ultrasound and rhBMP-2 to enhance bone formation in a rat model of critical size defect. J Orthop Trauma. 2014;28:605–611.
- Lai CH, Chen SC, Chiu LH, et al. Effects of low-intensity pulsed ultrasound, dexamethasone/TGF-beta1 and/or BMP-2 on the transcriptional expression of genes in human mesenchymal stem cells: chondrogenic vs osteogenic differentiation. Ultrasound Med Biol. 2010;36:1022–1033.
- Li L, Yang Z, Zhang H, et al. Low-intensity pulsed ultrasound regulates proliferation and differentiation of osteoblasts through osteocytes. Biochem Biophys Res Commun. 2012;418:296–300.
- Uddin SM, Qin YX. Enhancement of osteogenic differentiation and proliferation in human mesenchymal stem cells by a modified low intensity ultrasound stimulation under simulated microgravity. PLoS One. 2013;8:e73914.
- Zhang ZL, Ma YL, Guo SW, et al. Low-intensity pulsed ultrasound stimulation facilitates in vitro osteogenic differentiation of human adipose-derived stem cells via up-regulation of heat shock protein (HSP)70, HSP90, and bone morphogenetic protein (BMP) signaling pathway. Biosci Rep. 2018;38:BSR20180087.
- Shindo T, Ito K, Ogata T, et al. Low-intensity pulsed ultrasound enhances angiogenesis and ameliorates left ventricular dysfunction in a mouse model of acute myocardial infarction. Arterioscler Thromb Vasc Biol. 2016;36:1220–1229.
- Rutten S, Nolte PA, Korstjens CM, et al. Low-intensity pulsed ultrasound increases bone volume, osteoid thickness and mineral apposition rate in the area of fracture healing in patients with a delayed union of the osteotomized fibula. Bone. 2008;43:348–354.
- He RX, Zhou WC, Zhang Y, et al. Combination of low-intensity pulsed ultrasound and C3H10T1/2 cells promotes bone-defect healing. Int Orthop. 2015;39:2181–2189.
- Nourse MB, Halpin DE, Scatena M, et al. VEGF induces differentiation of functional endothelium from human embryonic stem cells: implications for tissue engineering. Arterioscl Thromb Vasc Biol. 2010;30:80–89.
- Marelli B, Ghezzi CE, Barralet JE, et al. Three-dimensional mineralization of dense nanofibrillar collagen-bioglass hybrid scaffolds. Biomacromolecules. 2010;11:1470–1479.
- Young S, Patel ZS, Kretlow JD, et al. Dose effect of dual delivery of vascular endothelial growth factor and bone morphogenetic protein-2 on bone regeneration in a rat critical-size defect model. Tissue Eng Part A. 2009;15:2347–2362.
- Subbiah R, Hwang MP, Van SY, et al. Osteogenic/angiogenic dual growth factor delivery microcapsules for regeneration of vascularized bone tissue. Adv Healthcare Mater. 2015;4:1982–1992.
- E Z, Liu L. Medical Tissue Engineering Technology and Clinical Application. Beijing (CN): Beijing Publishing House; 2003.
- Liu DP, Aihemaiti X, Gu L, et al. Correlation between proliferation and differentiation of bone marrow stroma cells cultured in vitro. Chin J Clin Rehabil. 2005;9:10–12.
- Reher P, Elbeshir E, Harvey W, et al. The stimulation of bone formation in vitro by therapeutic ultrasound. Ultrasound Med Biol. 1997;23:1251–1258.
- Fukuhara S, Tomita S, Yamashiro S, et al. Direct cell-cell interaction of cardiomyocytes is key for bone marrow stromal cells to go into cardiac lineage in vitro. J Thorac Cardiovasc Surg. 2003;125:1470–1480.
- Ying QL, Nichols J, Evans EP, et al. Changing potency by spontaneous fusion. Nature. 2002;416:545–548.