
Abstract
In recent years, numerous studies have confirmed the role of chitosan nanoparticles (CS NPs) as a promising drug delivery carrier for improving the efficiency of anticancer drug in the treatment of cancer. However, the possible biological effects of CS NPs on tumour cells and underlying mechanisms are still unclear. Recently, reactive oxygen species (ROS)-mediated cell apoptosis has been implicated in the regulation of cell death. In this study, we found that CS NPs induced the massive generation of ROS and resulted in apoptosis of hepatocellular carcinoma cells (SMMC-7721) through activating the mitochondrial pathway and endoplasmic reticulum stress. These results suggest an important role of ROS in CS NPs-induced cancer cell death.
Introduction
In recent years, nanotechnology has been rapidly developed in the field of medicine. Especially, unique physicochemical properties of nanoparticles (NPs) make it attractive for cancer treatment [Citation1–3]. Due to their small particle size and large specific surface area, NPs encapsulating more drugs were specifically targeted to tumour cells and kept around tumour tissue for longer time, thus favouring the accumulation and distribution of drugs and improving the antitumor efficiency [Citation4–8]. Although NPs have novel structural and physical properties that are attracting great interests from pharmaceuticals for the targeted delivery of anticancer drugs, the intrinsic potential biological effects of the nanoparticle used as the carrier on tumour cells is a matter of additional concern at both individual and environmental levels [Citation9,Citation10]. At present, many studies concentrated on the investigation of nanoparticles-induced cytotoxicity. Nanomaterials can also cause cellular DNA damage and apoptosis through DNA damage, free radicals, membrane damage and ion homeostasis [Citation11,Citation12]. It was found that ZnO-NPs exposure caused DNA fragmentation demonstrating apoptotic type of cell death and increased the expression of metallothionein gene, which was considered as a biomarker in metal-induced toxicity [Citation13]. Some reported that fine particles interacted with the surface of A549 cells and entered the cells, causing changes in cytoskeletal composition [Citation14]. Nel et al. believed that multi-walled carbon nanotubes (MWCNTs) were more likely to interact with cells than fine particles, and then entered cells to cause cell morphology changes [Citation15]. Nanoparticle-induced apoptosis can inhibit SIRT1 expression, activate p53 and induce apoptosis by inhibiting the initiation of the PI3K/Akt signalling pathway [Citation15].
Mitochondria, the main source of intracellular reactive oxygen species (ROS) and major mediators of important ROS signalling in cells, are considered to be the major cell compartment that can be deleteriously affected by nanoparticle-mediated toxicity. When NPs as an external stimulus were coped with cells, they stimulated the increase of intracellular ROS content and led to mitochondria dysfunction including leakage of cytochrome c from mitochondria, enhanced permeability of mitochondrial membrane and activation of caspase family, thus leading to a cascade of apoptosis [Citation16–18].
As a novel drug control release delivery carrier, the preparation and application of chitosan-based nanoparticles (CS NPs) display a great promising potential in the treatment and diagnosis of cancer treatment [Citation19,Citation20]. In view of their shape and size, CS NPs can be easily aggregated and accumulated inside tumour tissues for a long time. At the same time, the bioavailability in vivo is increased by encapsulating poorly soluble drugs inside NPs [Citation21,Citation22]. Despite CS NPs as an ideal carrier for anticancer drug have attracted attention and been fully investigated in the field of cancer therapy as the effective drug delivery system, less is known about the antitumor effects of CS NPs and interaction mechanisms between nanoparticles and cancer cells are not yet fully understood. In this study, we hypothesized that CS NPs would induce the antitumour effect incancer cells. As Hepatocellular carcinoma (HCC) is one of the most common malignancies worldwide and the efficacy of chemotherapy is limited , we focused on evaluating the antitumor effect of CS NPs on the growth of human hepatocellular carcinoma cells (SMMC-7721) and the possible mechanisms involved. We had synthesized CS NPs and physical characterization was done by transmission electron microscopy (TEM), dynamic light scattering (DLS). The cellular uptake and distribution of CS NPs were investigated in hepatocellular carcinoma cell line (SMMC-7721) to evaluate CS NPs’ ability to target cells. The antitumor mechanism of CS NPs in human hepatocellular carcinoma cells was probed by investigating cell viability, mitochondrial membrane potential, reactive oxygen species (ROS) generation and endoplasmic reticulum (ER) stress.
Materials and methods
Chitosan with deacetylation degree of 80% and molecular weight of approximately 400 kDa was purchased from Haixin Biological Product Co., Ltd (Ningbo, People’s Republic of China). 3–(4,5-dimethylthiazol-2-yl)-2,5-diphenyltetrazolium bromide (MTT) and sodium tripolyphosphate (TPP) were obtained from Sigma (St Louis, USA). All other chemicals were of reagent grade and were used as received. Hepatocellular carcinoma cell line (SMMC-7721) was purchased from the Institute of Biochemistry and Cell Biology of Chinese Academy of Sciences (Shanghai, People’s Republic of China).
The preparation of CS NPs
Accurately weighed 175 mg of CS was dissolved in 50 ml 1% glacial acetic acid under stirring at room temperature for 15 min. After that, the obtained CS solution was centrifuged at 3000 rpm for 10 min to remove impurities and filtered by a 0.22 μm filter. Under magnetic stirring, the TPP was slowly dropped to CS solution until obvious milky whiteness or opalescence was observed. After continuously stirring for 1 h and centrifugation at 16,000 rpm for 20 min, NPs were separated and washed with distilled water for three times. The characterization of CS NPs was investigated by observing its morphology using transmission electron microscope (TEM) (JEM-1200EX, Tokyo, Japan) and detecting the mean diameter and zeta potential by Zetasizer (Nano ZS90, Malvern, UK).
Intracellular location of CS NPs in SMMC-7721cells
To clearly observe the intracellular distribution of NPs, NPs entrapping rhodamine B (RhB) was prepared using a method reported previously [Citation23,Citation24] and incubated into cells seeded in six-well chamber slides (BD Biosciences, Bedford, MA, USA). The nucleus was stained with Hoechst (blue) for 15 min at 37 °C and the mitochondria were stained by Mito tracker (green). Finally, the mobility of CS NPs in the cytoplasm of the cells and their distributions were observed using confocal laser scanning microscopy (CLSM) (FluoView FV10i; Olympus, Tokyo, Japan). In order to determine endocytic tracking assay of NPs in cells, SMMC-7721 cells were separately pretreated with cytochalasin D, genistein, chlorpromazine and sodium azide and then treated with CS NPs.
ROS determination
The cell suspension was repeatedly pipetted with a pipette to disperse cells into a single state and adjusted to 1 × 10⁶ cells/mL. Finally, 100 μL of cell suspension was added to each well in a 96-well plate and incubated at 37 °C, 5% CO2 for 24 h in an incubator. CS NPs at 1 mg/mL and the combination of CS NPs and inhibitors were incubated with cells for 12, 24 and 48 h followed by the continuous incubation with 10 μM 2,7-dichlorofluorescein diacetate (DCFH-DA, Sigma, MO, USA) for about 30 min. After washing with PBS, the intracellular DCF fluorescence intensity which was excited at 485 nm and emitted at 530 nm was detected using a microplate reader (Synery-2, Biotek, USA) to investigate the extent of oxidative stress. The intracellular DCF fluorescence was observed using confocal laser scanning microscopy (FluoView FV10i, Olympus, Japan) to investigate the generation of ROS.
Determination of endoplasmic reticulum stress
In order to determine whether CS NPs could induce ER stress of cells, ER-Tracker Blue-White DPX was used to stain ER and the degree of ER stress was also evaluated by observing the morphological change of the ER under CLSM. The cell suspension was repeatedly pipetted with a pipette to disperse cells into a single state and adjusted to 1 × 10⁶ cells/mL. Finally, 100 μL of cell suspension was added to each well in a 96-well plate and incubated at 37 °C, 5% CO2 for 24 h in an incubator. Then, cells were treated with CS NPs at 1 mg/mL and the combination of CS NPs and inhibitors for 48 h at 37 °C. After incubation, the medium was removed and the cells were washed twice with cold phosphate buffered saline (PBS); the cells were then stained with ER-Tracker Blue-White DPX at 37 °C for 30 min in the dark were observed by CLSM.
Mitochondrial membrane potential change
The cell suspension was repeatedly pipetted with a pipette to disperse the cells into a single state and adjusted to 1 × 10⁶ cells/mL. Finally, 100 μL of cell suspension was added to each well in a 96-well plate and incubated at 37 °C, 5% CO2 for 24 h in an incubator. Then, cells were treated with CS NPs at 1 mg/mL and the combination of CS NPs and inhibitors for 24 h at 37 °C. After 24 h, the cells were then stained with JC-1 (5 mg/mL) at 37 °C for 30 min in the dark and tend to display green colour at emission light collection of 515–545 nm and red colour at emission light collection of 570–600 nm by CLSM.
MTT assay
SMMC-7721 cells at the logarithmic growth phase were rinsed with 3 ml of PBS followed by the addition of 1 ml of trypsin for continuous incubation for 3 min. As the digestion of trypsin was stopped by adding 2 ml of medium containing 10% fetal bovine serum, the cell suspension was repeatedly pipetted with a pipette to disperse the cells into a single state and adjusted to 1 × 10⁶ cells/mL. Finally, 100 μL of cell suspension was added to each well in a 96-well plate and incubated at 37 °C, 5% CO2 for 24 h in an incubator. Then, cells were treated with CS NPs and the combination of CS NPs and inhibitors for 12 h at 37 °C. As the culture medium was removed and 100 μL DMEM was added, 20 μL MTT with concentration of 5 mg/mL was added into the 96-well plate and incubated for 4 h at 37 °C. Finally, a combination of MTT and culture medium was removed carefully and 150 μL of dimethyl sulfoxide was added into each well, then the absorbance was measured at 490 nm using a microplate reader (Synery-2; BioTek, Winooski, VT, USA). All experiments were performed thrice.
Cell apoptosis study
According to the protocol of our previous study, propidium iodide (PI) staining and flow cytometry were used to evaluate the cell progression induced by CS NPs. an Annexin V–fluorescein isothiocyanate (FITC)/propidium iodide (PI) staining assay was used to evaluate the cell apoptosis induced by CS NPs.
The cell suspension was repeatedly pipetted with a pipette to disperse the cells into a single state and adjusted to 1 × 10⁶ cells/mL. Finally, 100 μL of cell suspension was added to each well in a 96-well plate and incubated at 37 °C, 5% CO2 for 24 h in an incubator. Then, cells were treated with CS NPs at 4 mg/mL and the combination of CS NPs and inhibitors for 12 h at 37 °C. After treatment, the cell-cycle progression and the proportion of cells at each phase were quantified by flow cytometry. Cells were collected and suspended in Nicoletti buffer containing propidium iodide (PI) and annexin V-FITC(AV). DNA content was determined by a fluorescence-activated cell sorter (FACSCalibur, BD, USA). The ratio of AV-positive cells and PI-positive cells were presented by calculating the amount of cells undergoing apoptosis at different stages.
Western blot assay
SMMC-7721 cells were cultured to reach the logarithmic growth phase and seeded into six-well plates at a concentration of 5 × 10⁵ cells/well for 24 h and incubated at 37 °C for 24 h. CS NPs at 4 mg/mL and the combination of CS NPs and inhibitors were used to treat the cells for 12 h. Cells were digested with 0.25% trypsin-EDTA and collected by centrifugation. Total protein was extracted by RIPA lysis and quantified using a BCA kit. After separating by sodium dodecyl sulfate (SDS)-polyacrylamide gel electrophoresis (PAGE), the proteins were further transferred to a polyvinylidene fluoride membrane (PVDF). After blocking with 1% bovine serum albumin (BSA), the PVDF membrane was incubated with primary antibodies at 4 °C overnight and the plate was washed five times with PBST (PBS with 0.1% Tween® 20) for 5 min at room temperature. After incubation with the appropriate secondary antibody, the target proteins were stained and detected with enhanced chemiluminescence (ECL).
Results
Physicochemical properties of CS NPs
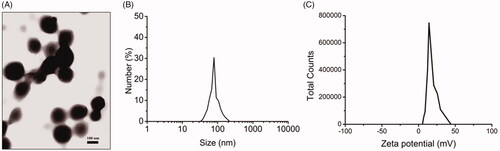
CS NPs were successfully obtained and characterized in terms of particle size, zeta potential and polydispersity. According to the exploration for experimental conditions, when prepared CS NPs, we chose the mass ratio of CS to TPP as 5 to 1, and the mass concentration of CS solution was 2 mg/ml. Transmission electron microscopy studies in showed that CS NPs were regular spherical, smooth-surfaced, approximately 70–120 nm in diameter. The average particle size of CS NPs was about 87.4 ± 4.3 nm, and the zeta potential was positive and valued at around 17.0 ± 2.3 mV. In addition, the polydispersity index of CS NPs was above 0.019, indicating a disperse population and good stability in media.
Figure 1. Characterization of CS NPs. (A) TEM images of CS NPs, (B) DLS analysis of CS NPs, (C) zeta potential of CS NPs.
Uptake mechanisms involved in the cellular entry of NPs
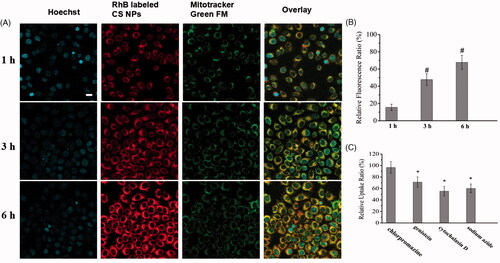
In order to check out the whole internalization process of CS NPs in cells, intracellular distribution of CS NPs was observed by confocal laser scanning microscopy (CLSM) (FluoView FV10i, Olympus, Japan). As shown in , when SMMC-7721 cells were incubated with RhB labeled CS NPs, NPs were gradually accumulated around the membrane surface of cells and the significant higher red fluorescence emitted by RhB was focused on the membrane surface, indicating that NPs had absorbed at the surface of membrane in the initial 1 h. With the passage of time, NPs were effectively transferred into cell manifested by red spots homogenously distributed in cytoplasm. Yellow dots representing co-localization between the inherent red fluorescence of RhB encapsulated in NPs and the mitochondrial indicator mitotracker® green FM (green) fluorescence were obviously observed, proving that CS NPs were specifically delivered and accumulated in the mitochondria of cells. Uptake ability of CS NPs was quantified using a microplate reader by checking the fluorescence of RhB, which is excited at 540 nm and emitted at 625 nm. The relative fluorescence ratio (RFR, %), which represents the relative uptake rates of NPs, was calculated by determining the ratio of the fluorescence intensity of internalized RhB-labeled NPs to that of the initially added RhB-labeled NPs. This suggested that CS NPs were internalized into cells in a time-dependent manner (). About 15.6% of the total amount of NPs had been internalized into cells within the first 1 h, and the uptake ratio had increased to 47.8% at 3 h and to 67.8% at 6 h in the SMMC-7721 cells. In order to confirm which endocytic pathways dominated the cellular internalization of NPs, different endocytic inhibitors were used to treat cells respectively. The relative uptake ratio was determined by comparing the relative fluorescence ratio of NPs treated with inhibitors with the relative fluorescence ratio of NPs treated with non-inhibitors. As shown in , when SMMC-7721 cells were preincubated with chlorpromazine (1 μg/mL) as an inhibitor to block clathrin-mediated endocytosis and then treated with NPs, the relative uptake ratio of NPs were 96.7% in SMMC-7721 cells, indicating that clathrin played a minor role on the uptake of NPs. On the contrary, SMMC-7721 cells were preincubated with genistein (an inhibitor to block caveolae-mediated endocytosis) and cytochalasin D for blocking macropinocytosis, respectively, the relative uptake ratio of NPs were 71.2% and 55.4% in SMMC-7721 cells, suggesting that the internalization of NPs into cells could rely on caveolae-mediated endocytosis and macropinocytosis. In addition, the uptake of NPs was energy dependent, and the relative uptake ratios had decreased to 60.2% for CS NPs with the addition of the energy inhibitor, sodium azide.
Figure 2. In vitro cellular distribution of CS NPs after incubating SMMC-7721 cells with rhodamine B-labeled CS NPs. (a) Fluorescent image of cells, the scale bar is 100 μm and applies to all parts. (b) Fluorescence spectrum analysis of the uptake of RhoB-labeled CS NPs in SMMC-7721 cells. Results were expressed as means ± SD (n = 3). #p < .05, vs relative fluorescence ratio of NPs at 1 h. (c) Study on uptake mechanisms involved in the cellular entry of NPs. Results were expressed as means ± SD (n = 3). *p < .05, vs RhoB-labeled CS NPs treated with chlorpromazine.
The effect of CS NPs exposure on ROS generation
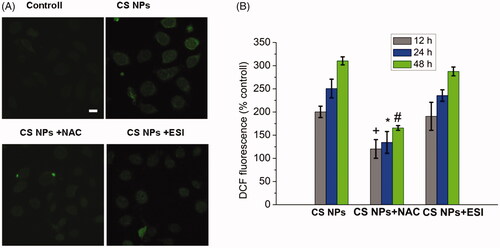
In order to determine the generation of ROS induced by the treatment of CS NPs, we use fluorescent probe DCFH-DA to investigate the extent of oxidative stress. After entering the cell, DCFH-DA is hydrolyzed by esterase into DCFH which was further oxidized to fluorescent DCF by the help of the reactive oxygen species in the cells. Therefore, the fluorescence intensity of DCF can directly reflect the level of reactive oxygen species in the cell. As can be seen in , the intracellular fluorescence intensity in CS NPs (1 mg/mL) treated cells was significantly higher than that of the control (p < .05), and the bright green fluorescence was distributed in a granular manner within the cytoplasm. After giving CS NPs to SMMC-7721 cells, the amount of intracellular ROS detected was 2.0 times at 12 h, 2.5 times at 24 h and 3.1 times at 48 h higher than that of the control group, indicating that CS NPs accelerated the production of intracellular ROS. After co-treatment of cells with CS NPs and N-acetylcysteine (NAC) as a commonly used active oxygen scavenger, the intracellular fluorescence intensity was significantly weaker than that of CS NPs alone (p < .05). The amount of ROS produced in cells was reduced significantly and ROS levels were reduced to 1.2 times in 12 h, 1.3 times in 24 h and 1.6 times in 48 h higher than that of the control group in SMMC-7721 cells. In contrast, the results demonstrated that there was no considerable difference on the intracellular fluorescence intensity of DCF in cells either treated with CS NPs or the combination of CS NPs and Eeyarestatin I (ESI) as a commonly used inhibitor of the ER. All results demonstrated that CS NPs could increase the content of ROS in SMMC-7721 cells. The use of ER inhibitors induced a negligible variation in ROS levels in cells, indicating that inhibition of endoplasmic stress as a downstream signalling pathway did not affect the production of ROS.
Figure 3. ROS generation in SMMC-7721 cells treated with CS NPs. (A) Image changes of ROS generation following treatment with CS NPs and its combination with NAC and ESI, the scale bar is 50 μm and applies to all parts. (B) Quantification of ROS generation in cells treated with CS NPs and its combination with NAC and ESI at different times. Data are presented as means ± SD (n = 3). +p < .05 vs CS NPs group at 12 h, *p < .05 vs CS NPs group at 24 h, #p < .05 vs CS NPs group at 48 h.
The effect of CS NPs exposure on ER stress
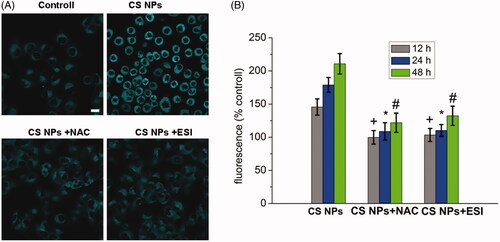
In order to investigate the effect of CS NPs exposure on ER stress, ER was stained with the fluorescent dye ER-Tracker Blue-White DPX and the changes of morphology of ER in cells were observed under CLSM. The results () showed that with the addition of CS NPs, the intensity of the blue fluorescence from the ER-Tracker Blue-White DPX continued to increase, suggesting that the degree of ER stress was significantly enhanced by the induction of CS NPs exposure. After cells were pretreated with 10 mM oxygen free radical scavenger acetylcysteine (NAC) to inhibit oxygen free radical, the CS NPs induced ER stress was significantly reduced by the inhibition of ROS generation and the intensity of intracellular blue fluorescence was weakened. It further proved that the internalization of NPs enhanced the degree of ER stress mediated by the reactive oxygen species which was necessarily required for ER stress. Compared with control group, NPs at the concentration of 1 mg/mL were incubated with cells for 48 h. The levels of intracellular ER stress were increased to 146.5% at 12 h, 178.9% at 24 h and 210.8% at 48 h in SMMC-7721 cells. After cells were treated with 10 mM oxygen free radical scavenger acetylcysteine (NAC) as an inhibitor of oxygen free radical, the levels of intracellular ER stress were reduced to 99.8% at 12 h, 108.7% at 24 h and 121.9% at 48 h in SMMC-7721 cells.
Figure 4. ER stress in SMMC-7721 cells treated with NPs, ER staining with the ER Tracker blue–white DPX probe. (A) Image changes of ER stress following treatment with CS NPs and its combination with NAC and ESI, the scale bar is 100 μm and applies to all parts. (B) Quantification of ER stress in cells treated with CS NPs and its combination with NAC and ESI at different time. Data are presented as means ± SD (n = 3). +p < .05 vs CS NPs group at 12 h, *p < .05 vs CS NPs group at 24 h, #p < .05 vs CS NPs group at 48 h.
Mitochondrial membrane potential analysis
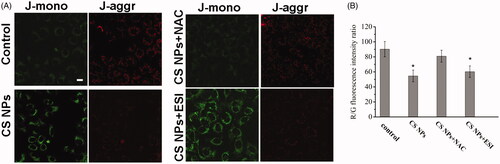
Changes of mitochondrial membrane potential of the cells after treatment with CS NPs were investigated by monitoring the changes of the emitting fluorescence variation of JC-1 dyes. The results () showed that under normal conditions, the mitochondria of tumour cells mainly showed stronger red fluorescence and weaker green fluorescence, indicating that the mitochondria had a higher membrane potential and mainly dispersed in a aggregation state manifested by stronger red fluorescent intensity (JC-1 aggregation). The JC-1 staining results in CS NPs treated group were shown in and demonstrated that red fluorescent intensity was reduced and the intensity of green fluorescence was significantly increased, indicating that the mitochondria had a lower membrane potential and mainly dispersed in a monomer state manifested by stronger green fluorescent intensity. The results proved that CS NPs induced the targeted delivery into mitochondria and significantly aggravated the damage of mitochondria by reducing the mitochondrial membrane potential. In order to determine whether the production of ROS induced the CS NPs mediated mitochondria damage by reducing mitochondrial membrane potential, we use the combination of CS NPs and NAC to investigate the mitochondrial membrane depolarization. It was found that when given antioxidant NAC to inhibit ROS generation, the mitochondrial membrane potential was significantly enhanced compared to that of CS NPs alone. In addition, the ratio of red fluorescence intensity to green fluorescence intensity was determined to reflect the degree of damage of the mitochondrial membrane. As shown in , compared with the control group, CS NPs significantly reduced R/G fluorescence ratio in cells, indicating that CS NPs can significantly reduce the membrane potential of mitochondria and accelerate mitochondrial damage. Furthermore, the co-treatment of NAC with CS NPs remarkably reversed NPs induced reduction of R/G fluorescence ratio in cells. In the meanwhile, the co-addition of CS NPs and ESI did not affect mitochondrial membrane potential change. All these findings indicated that CS NPs induced the massive production of oxygen free radicals in cells and damaged the integrity of the mitochondrial membrane by reducing its membrane potential, thus resulting in the activation of the ROS-mediated apoptosis pathway.
Figure 5. Changes in the mitochondrial membrane potential after incubating CS NPs and its combination with NAC and ESI with SMMC-7721 cells. (A) Image analysis of mitochondrial membrane potential of SMMC-7721 cells treated with CS NPs and its combination with NAC and ESI. The scale bar is 50 μm and applies to all parts. (B) Quantification of red/green fluorescence intensity ratio by Image J. Data are presented as means ± SD (n = 3). *p < .05 vs control group.
MTT assay
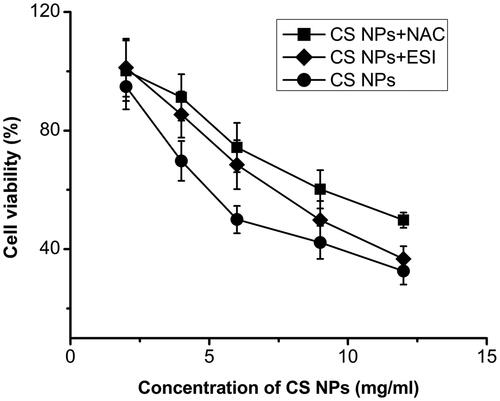
A MTT assay was used to determine the antitumor effect of CS NPs in SMMC-7721 cells treated with different doses of CS NPs for 12 h. The MTT results () showed that inhibiting rates of CS NPs at below 2 mg/mL for tumour cells were very low and showed no obvious cell inhibition within 12 h. The cell viability treated with CS NPs was significantly decreased at all concentrations, ranging from 4 to 12 mg/mL. As NAC was mediated to inhibit the ROS production, the sensitivity of CS NPs to cancer cells was significantly decreased and (IC50) values in SMMC-7721 cells treated with CS NPs and NAC were increased at 12 h. This indicated that CS NPs induced tumour growth inhibition might be associated with higher levels of ROS generation. Furthermore, as ESI was mediated to inhibit ER stress, the inhibition of cell viability of SMMC-7721 by CS NPs was also decreased, indicating that ER stress also synergistically contributed to CS NPs induced antitumor activities.
Figure 6. Viability of SMMC-7721 cells after incubation with CS NPs and its combination with NAC and ESI for 12 h. Data are presented as mean ± SD (n = 3).
Cell-cycle analysis
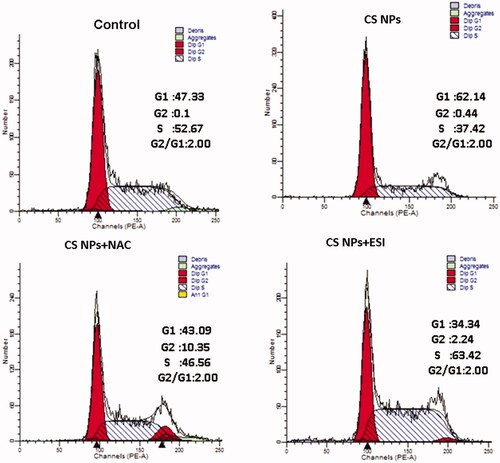
PI staining was used to determine the percentage of cells in each phase of the cell cycle and the percentage of apoptotic cells in a sample treated with CS NPs, combination of CS NPs and NAC, combination of CS NPs and ESI. The results in showed that when compared with the control group, CS NPs changed the cell-cycle stage distribution in SMMC-7721 cells and showed evident stagnation tendencies in the G0/G1 phase. Furthermore, as compared with CS NPs, when treated with the combination of CS NPs and NAC, the cell count in the G0/G1 phase significantly was decreased and that in the S phase was increased. Cell-cycle analysis revealed that CS NPs may participate in the transition of cells from G1 phase to S phase, the suppression of cell proliferation was significantly induced. In addition, the combination of CS NPs and ESI arrested the cell cycle in phase S and reduced the percentage of cells in G0/G1 phase.
Figure 7. The cell cycle profiles of SMMC-7721 cell treated with CS NPs and its combination with NAC and ESI for 12 h using flow cytometry.
Cell apoptosis and necrosis
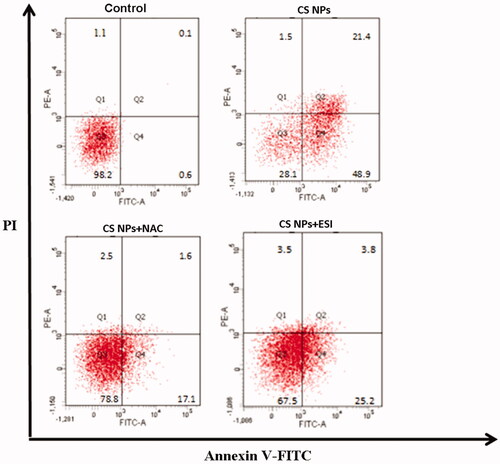
In order to evaluate apoptosis effects of cells treated with different formulations containing CS NPs, Annexin V-FITC/PI staining assay was performed and the apoptotic and necrotic cells were quantified by flow cytometry. As shown in , flow cytometry analysis revealed that after 12 h incubation with the treatment of CS NPs, SMMC-7721 cells induced the higher apoptosis effect and the ratio of double (annexin V/propidium iodide) positive cells in SMMC-7721 cells was increased to 70.3% as compared with control group. In order to further confirm that CS NPs exposure activated the ROS-mediated cell apoptosis pathway, NAC was used to investigate the variation of cell death induced by CS NPs. The results showed that co-treatment of CS NPs and NAC reduced the apoptosis effects and the ratio of double (Annexin V/PI)-positive cells in was 18.7%. This proved that CS NPs might induced cell apoptosis with the mediation of ROS. Moreover, when cells were treated with ESI and CS NPs, the apoptosis effects was also decreased and the ratio of double (AnnexinV/PI)-positive cells in the SMMC-7721 cells was 29.0%. This may indicate that the CS NPs also triggered ER stress-induced apoptosis and the addition of ESI for alleviating the degree of ER stress limited the induction of apoptosis.
Figure 8. Apoptosis of SMMC-7721 cells treated with CS NPs and its combination with NAC and ESI for 12 h determined by Annexin V–fluorescein isothiocyanate/propidium iodide staining.
Western blot assay
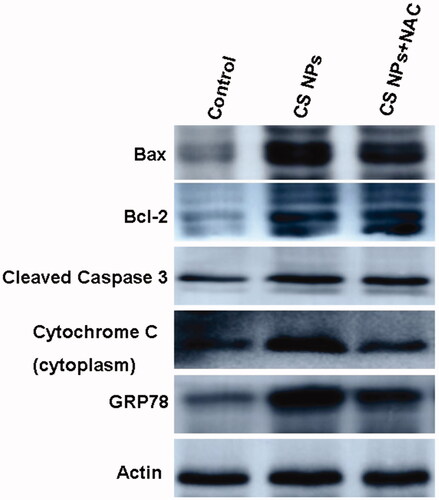
To confirm the antitumor activities of CS NPs, we performed western blotting to determine apoptosis-related factors such as cytochrome C, caspase precursor and apoptosis-inducing factors. demonstrated that in accordance with the flow cytometry analysis results, CS NPs induced the cellular apoptosis by upregulating the expression of bax, cleaved caspase-3 . Furthermore, it was observed that cytochrome C in the cytoplasm treated with CS NPs was expressed at the highest level, proving that CS NPs damaged the integrity of the mitochondria and decreased its membrane potential, thus resulting in massive release of cytochrome C from mitochondria into cytoplasm and activation of the mitochondrial apoptosis pathway. In addition, in order to confirm the effect of CS NPs exposure on the induction of ER-induced apoptosis, we also detected the expression GRP78 (glucose-regulated protein 78) which worked as an indicator of ER stress. It was found that the exposure of CS NPs increased GRP78 expression, indicating the occurrence of ER stress. To determine whether CS NPs generated ROS contributed to tumour growth inhibition, we manipulated ROS activity using a ROS inhibitor (NAC) to combine with CS NPs to treat SMMC-7721 cells and western blot assay was adopted to determine the expression of apoptosis-related proteins. It demonstrated that when given the antioxidant NAC, the increased expressions of Bax and cleaved caspase 3 were significantly suppressed, indicating that the CS NPs induced cell apoptosis was significantly reduced in the presence of NAC. In the meanwhile, fewer cytochrome c were released rapidly from mitochondria into the cytoplasm and the expressions of GRP78 were also reduced. This indicated that in the presence of NAC for inhibiting ROS generation, the integrity of the mitochondrial membrane potential was enhanced and ER stress was also attenuated. All these data suggested that CS NPs showed a strong antitumor effect on human hepatoma cell line SMMC-7721 cells. The antitumor mechanism was mediated by inducing ROS-mediated mitochondrial damage and ER stress.
Figure 9. Western blot analyses of the expression levels of Cleaved caspase-3, Bcl-2, Bax, GRP78 and cytochrome c in SMMC-7721 cells treated with CS NPs and its combination with NAC for 12 h.
Discussion
CS NPs have been synthesized as drug carriers as reported in previous studies [Citation25,Citation26]. Owing to its the unique character, CS NPs improved specificity and bioavailability of drugs and reduced pharmacological toxicity in the field of cancer therapy. However, there are few reports in the literature concerning the antitumor effect of CS NPs on tumour cells. Some reports further confirmed that some types of nanoparticles can inhibit the proliferation of cancer cells and the apoptosis of cancer cells is associated with ROS mediated pathways. The ROS generation capability of nanoparticles is related to the cytotoxic response in various cell types. To further explore whether CS NPs made a significant effect on antitumour activity in hepatoma cells by regulating ROS-mediated pathway, we designed CS NPs with optimized particle size, zeta potential, and morphology. We focused our study on probing into the antitumor mechanism of CS NPs. Based on our experimental design, we used the maximum concentration (4 mg/mL) of CS NPs to treat tumour cells in a short time (12 h) for amplifying its anti-tumour effects of CS NPs and exploring its mechanism. We had already realized that the maximum concentration (4 mg/mL) of CS NPs was too high and cannot be used in clinical cancer therapy, the maximum concentration (4 mg/mL) of CS NPs was only applied for evaluating the anti-tumour effects of CS NPs and exploring its mechanism. It was found that the internalization of some CS NPs specifically occurred at the mitochondria and increased ROS generation, thus resulting in activation of ROS-induced mitochondrial disorders and ER stress. CS NPs induced the higher cell inhibition effects and the ratio of AV positive cells treated with CS NPs was 70.3%. Western blot results showed that the expressions of apoptosis-related proteins such as bax and cleaved caspase-3 were significantly up-regulated. Furthermore, more cytochrome c was released rapidly from mitochondria into the cytoplasm and the expressions of GRP78 were also increased. When added antioxidant N-acetylcysteine (NAC), CS NPs-induced apoptosis of cells was suppressed by maintaining the integrity of mitochondrial membrane and attenuating the degree of ER stress. Taken together, exposure of CS NPs showed higher tumor inhibitory effects in human hepatocellular carcinoma cells (SMMC-7721) by enhancing ROS-induced disorders in mitochondrial function and ER stress. Therefore, CS NPs could be a potent agent in the treatment of hepatocellular carcinoma for further evaluations.
Conclusion
CS NPs suppressed hepatocellular carcinoma cells growth. We also had demonstrated that induction of intracellular ROS through the internalization of CS NPs in cells directly resulted in cell apoptosis by inducing mitochondria disruption and ER stress. Taken together, it showed that CS NPs with small particle size and positive surface charge exhibited higher antitumor activity in hepatocellular carcinoma cells and could be a kind of promising agent for further evaluations in cancer therapy.
Disclosure statement
No potential conflict of interest was reported by the authors.
Additional information
Funding
Related Research Data
References
- Jiang S, Franco YL, Zhou Y, et al. Nanotechnology in retinal drug delivery. Int J Ophthalmol. 2018;11:1038–1044.
- Hartshorn CM, Bradbury MS, Lanza GM, et al. Nanotechnology strategies to advance outcomes in clinical cancer care. ACS Nano. 2018;12:24–43.
- Sun T, Zhang YS, Pang B, et al. Engineered nanoparticles for drug delivery in cancer therapy. Angew Chem Int Ed Engl. 2014;53:12320–12364.
- Ferrari M. Cancer nanotechnology: opportunities and challenges. Nat Rev Cancer. 2005;5:161–171.
- Farokhzad OC, Langer R. Nanomedicine: developing smarter therapeutic and diagnostic modalities. Adv Drug Deliv Rev. 2006;58:1456–1459.
- Allen TM, Cullis PR. Drug delivery systems: entering the mainstream. Science. 2004;303:1818–1822.
- Peer D, Karp JM, Hong S, et al. Nanocarriers as an emerging platform for cancer therapy. Nat Nanotechnol. 2007;2:751–760.
- Mohapatra S, Mallick SK, Maiti TK, et al. Synthesis of highly stable folic acid conjugated magnetite nanoparticles for targeting cancer cells. Nanotechnology. 2007;18:385102.
- Service RF. American Chemical Society meeting. Nanomaterials show signs of toxicity. Science. 2003;300:243
- Oberdörster G. Lung particle overload: implications for occupational exposures to particles. Regul Toxicol Pharmacol. 1995;21:123–135.
- Kim JS, Yoon TJ, Yu KN, et al. Toxicity and tissue distribution of magnetic nanoparticles in mice. Toxicol Sci. 2006;89:338–347.
- Li N, Sioutas C, Cho A, et al. Ultrafine particulate pollutants induce oxidative stress and mitochondrial damage. Environ Health Perspect. 2003;111:455–460.
- Sahu D, Kannan GM, Vijayaraghavan R, et al. Nanosized zinc oxide induces toxicity in human lung cells. ISRN Toxicol. 2013;2013:316075.
- Calcabrini A, Meschini S, Marra M, et al. Fine environmental particulate engenders alterations in human lung epithelial A549 cells. Environ Res. 2004;95:82–91.
- Nel A, Xia T, Mädler L, et al. Toxic potential of materials at the nanolevel. Science. 2006;311:622–627.
- Zhu Y, Zhao Q, Li Y, et al. The interaction and toxicity of multi-walled carbon nanotubes with Stylonychia mytilus. J Nanosci Nanotechnol. 2006;6:1357–1364.
- Huerta-García E, Pérez-Arizti JA, Márquez-Ramírez SG, et al. Titanium dioxide nanoparticles induce strong oxidative stress and mitochondrial damage in glial cells. Free Radic Biol Med. 2014;73:84–94.
- Park EJ, Choi DH, Kim Y, et al. Magnetic iron oxide nanoparticles induce autophagy preceding apoptosis through mitochondrial damage and ER stress in RAW264.7 cells. Toxicol in Vitro. 2014;28:1402–1412.
- Subhapradha N, Shanmugam V, Shanmugam A. Chitosan nanoparticles from marine squid protect liver cells against N-diethylnitrosoamine-induced hepatocellular carcinoma. Carbohydr Polym. 2017;171:18–26.
- Khan MA, Zafaryab M, Mehdi SH, et al. Characterization and carboplatin loaded chitosan nanoparticles for the chemotherapy against breast cancer in vitro studies. Int J Biol Macromol. 2017;97:115–122.
- Zhang H, Wu F, Li Y, et al. Chitosan-based nanoparticles for improved anticancer efficacy and bioavailability of mifepristone. Beilstein J Nanotechnol. 2016;7:1861–1870.
- Kang BS, Choi JS, Lee SE, et al. Enhancing the in vitro anticancer activity of albendazole incorporated into chitosan-coated PLGA nanoparticles. Carbohydr Polym. 2017;159:39–47.
- Su C, Li H, Shi Y, et al. Carboxymethyl-β-cyclodextrin conjugated nanoparticles facilitate therapy for folate receptor-positive tumor with the mediation of folic acid. Int J Pharm. 2014;474:202–211.
- Shi Y, Su C, Cui W, et al. Gefitinib loaded folate decorated bovine serum albumin conjugated carboxymethyl-beta-cyclodextrin nanoparticles enhance drug delivery and attenuate autophagy in folate receptor-positive cancer cells. J Nanobiotechnology. 2014;12:43.
- Janes KA, Fresneau MP, Marazuela A, et al. Chitosan nanoparticles as delivery systems for doxorubicin. J Control Release. 2001;73:255–267.
- De Campos AM, Sánchez A, Alonso MJ. Chitosan nanoparticles: a new vehicle for the improvement of the delivery of drugs to the ocular surface. Application to cyclosporin A. Int J Pharm. 2001;224:159–168.