
Abstract
This study was designed to describe the oral acute and subacute toxicities and underlying toxicological mechanisms of biogenic Zn NPs in mice. The Zn NPs were prepared by a green microwave-assisted synthesis method in the presence of Lavandula vera leaf extract. Determination of median lethal dose (LD50) of Zn NPs and the subacute toxicity after 14 days of exposure was performed as a measurement of substance toxicity through general toxicological, hematological, serum, and histopathological investigations. The western blotting was used to determine the cleaved-caspase-3 expression in the sampled tissues. Flame atomic absorption spectrophotometer (AAS) was applied to estimate the Zn levels in tissues. The SEM analyses revealed that the biogenic Zn NPs were spherical-shaped with the size range of 30–80 nm. The LD50 value above 5 g/kg indicated that biogenic Zn NPs could be classified as non-toxic chemicals. In subacute toxicity, no significant differences were found in the body weight as well as hematological and oxidative stress (OS) biomarkers after exposure to Zn NPs at the dose of 1 g/kg in comparison to the control. The AAS results indicated that Zn NPs were mainly distributed in the testis, liver, and brain. The findings of histology images of Zn NPs at the dose of 1 g/kg were similar to those of the control. Furthermore, no significant differences were observed in cleaved-caspase-3 expression after exposure to Zn NPs at the dose of 5 g/kg. The results demonstrated that changes in the OS were not related to caspase pathway and the no-observed-adverse-effect level (NOAEL) dose of biogenic Zn NPs in 14-days subacute toxicity study was lower than 1 g/kg.
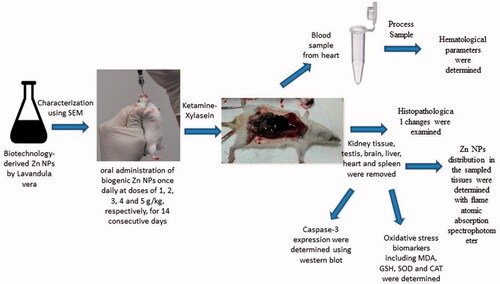
Graphical Abstract
Introduction
Due to the special physical, chemical, and photoelectrical properties of nanomaterials, their synthesis by different nanotechnology methods has been growing rapidly in recent years [Citation1]. Although improvements have been made in the production of nanomaterials, different challenges exist, such as developing reliable empirical protocols for the synthesis of nanomaterials across a wide range of chemical compositions, sizes, and high mono-dispersity in the field of nanotechnology [Citation1]. This highly promotes the popularity of nanomaterials in areas such as catalysts, optics, biopharmaceuticals, mechanics, magnetism, and energy. Therefore, new physicochemical methods have focused to achieve nanoparticles (NPs) with a certain composition and size, suitable energy consumption, low toxicity, and convenient operation [Citation2]. Similarly, in the context of the ongoing development of green technologies in the synthesis of nanomaterials, the production of NPs using biological systems has become particularly important due to their high purity, convenience and low cost, non-toxicity, and the production of NPs with new characteristics [Citation3]. Among the existing biological methods, use of microorganisms in nanobiotechnology has become more widely considered and has a further potential for development in different studies [Citation3–5]. Microorganisms feed on organic and inorganic resources in the environment for metabolism and vital processes. Through different procedures, these organisms, when exposed to metal ions, accumulate them inside or on their cell walls, often resulting in the production of particles classified in nano sizes [Citation6,Citation7]. The production of NPs by chemical methods leads to the absorption of toxic substances in the particle surface, which may interfere with biological systems. The synthesis of NPs using biological methods eliminates this problem and makes them more biocompatible [Citation8].
Zinc (Zn) is the 24th most abundant element in the earth’s crust and has five stable isotopes, the most common of which is asphaltic which is rich in zinc sulfide [Citation9]. The role of Zn (as a microcontroller) in human health is critical as it contributes to the stabilization of the DNA structure and to the improvement of the function of various enzymes such as superoxide dismutase (SOD), carbonic anhydrase, carboxypeptidase, regulation of gene expression in the immune system, antioxidant activities, and the other physical and chemical approaches [Citation4]. Zn may be used in ceramic manufactures, UV filters, photocatalysis, and sunscreen as well as food industry as additives and packaging agents for its antimicrobial and fungicidal properties [Citation10]. Zn components are also being considered as anticancer drugs and used for imaging in biomedical and drug delivery purposes. They are also of great interest to researchers as finding new pharmacological applications leads to increased exposure to this trace element [Citation11].
The biological synthesis of NPs derived from the plant extracts of Justicia adhatoda L. and Parthenium hysterophorous has specific physicochemical properties [Citation12,Citation13]. The potential applications of plant extracts (as a reducing agent) for the biosynthesis of various metal nanostructures have convinced researchers to research the ability of different plants to produce valuable nanometals. The biosynthesis of Zn NPs with microwave heating energy using plant extract has proved higher antioxidant activities determined with DPPH (2,2-diphenyl-1-picryl-hydrazyl-hydrate) radical scavenging activity and reducing power assay than zinc sulphate (ZnSO4) as a soluble Zn2+ ions source [Citation4].
However, there are few published data on the toxicity of biogenic Zn NP synthesis from new sources. Therefore, in this study, we aimed to describe the acute and subacute toxicological aspects of Zn NPs prepared through a simple and fast green microwave-assisted synthesis method using Lavandula vera leaf extract. Then, we explore the toxicity mechanism(s) which may be associated with the biogenic Zn NPs exposure. In addition, oxidative stress (OS) values including malondialdehyde (MDA) concentration, glutathione (GSH) content, the activity of antioxidant enzymes such as SOD and catalase (CAT), as well as caspase-3 expression, were evaluated as biochemical and molecular biogenic Zn NPs underlying toxicity mechanisms. Distribution of biogenic Zn NPs in tissues and histopathological changes were also examined to confirm the biochemical/molecular results.
Material and methods
Chemicals and kits
Zinc sulphate (ZnSO4), nutrient broth, nutrient agar, ethylene di-amine tetra acetic acid (EDTA), n-octanol, malondialdehyde (MDA) bis (diethyl acetal), and disodium hydrogen phosphate heptahydrate (Na2HPO4.7H2O) were purchased from Merck Chemicals (Darmstadt, Germany). Thiobarbituric acid (TBA), 5,5'-dithio-bis-[2-nitrobenzoic acid] (DTNB), and l-glutathione were obtained from SolarbioCo. Ltd. (Beijing, China). Pyrogallol was prepared from Samchun Pure Chemical Co., Ltd. (Seoul, South Korea). Western blot detection kit and polyvinylidenedifluoride (PVDF) membrane were purchased from Roche (Mannheim, Germany). An antibody against cleaved-caspase-3 was prepared from Cell Signaling Technology (Danvers, MA, USA). β-Actin antibody was provided by Santa Cruz Biotechnology (Santa Cruz, CA, USA). X-ray film was purchased from Kodak (Rochester, NY). All other chemicals and solvents were of analytical grade.
Preparation and characterization of biogenic Zn NPs
Biogenic Zn NPs were prepared using a method previously described [Citation4]. Briefly, 40 ml of ZnSO4 (1 mM) solution was mixed with 10 ml of Lavandula vera extract (in water). Subsequently, the reaction mixture was treated in a microwave oven (850 W, 60 s) to reduce the metal ions. The washed nanostructures were then characterized with different techniques. The UV-visible spectrum, the surface and elemental composition, the related size distribution pattern, and the crystalline structure of the biogenic Zn NPs were previously recorded [Citation4].
Animals and treatment
All the experimental procedures were carried out following the regulations of Kerman University of Medical Science (Kerman, Iran) for the care and use of laboratory animals. Male NMRI mice (body weight 20 ± 2 g) were obtained from Faculty of Medicine, Kerman University of Medical Science (Kerman, Iran) and housed in a 12/12 h light/dark condition with availability of food and water, at standard environment with controlled temperature (23 ± 2 °C) and humidity (55 ± 5%) for at least one week prior to experimentation.
There are no previous described doses or toxicity guideline for oral acute toxicity assessments of biogenic Zn NPs. Animals were randomly divided into separated groups of 10 per each. According to a pilot study, to estimate the value of the median lethal dose (LD50), various doses of biogenic Zn NPs and ZnSO4 prepared in distilled water (DW) were administered once daily by oral gavage. The animals were observed for 14 days, and cumulative mortality within these days was used for the calculation of LD50 as the measurement of acute toxicity.
Subacute toxicity evaluation
Seventy mice were randomly distributed into seven groups of 10 mice per each group. The first group (control) was administrated DW orally, and the second to six groups were through oral administration of biogenic Zn NPs once daily at doses of 1, 2, 3, 4 and 5 g/kg, respectively, for 14 consecutive days. The doses 1–5 g/kg were selected according to LD50 results due to no death were recorded after oral administration of the highest dose of 5 g/kg body weight to animals. The seventh group received ZnSO4 at the dose of 100 mg/kg upon oral administration once per day for 14 consecutive days. The mice were weighed once daily for 14 days. ZnSO4 group was selected as Zn+2 ion source and chemical form of Zn so that the toxicity of biological synthase source of Zn NPs was compared with it. The dose of 100 mg/kg was selected as toxic dose of ZnSO4 which could raise the OS biomarkers according to our pilot study and the other study [Citation14]. We tested ZnSO4 at doses of 100, 125, and 250 mg/kg that seemed to show more severe and acute toxicity and at least the dose of 100 mg/kg was selected for rest of the study.
After 14 days, all animals were anesthetized by Ketamine-Xylizine, then the abdomen was opened, and blood samples were obtained from the heart. The vital organs including the brain, heart, kidney, liver, spleen, and the testis of each group were removed for subsequent experimental studies.
Hematological and serum biochemical assessment
Blood samples were divided into two aliquot portions. One portion was collected into heparinized microtube for hematological evaluation. Hematological parameters including white blood cell (WBC) count, red blood cell (RBC) count, hemoglobin (Hb), hematocrit (Hct), and platelet (PLT) count were measured using hematological autoanalyzer (Mindray, Model BC 5800, China). The second portion was collected into microtubes containing no anticoagulant, allowed to clot, and serum was separated by centrifugation at 3500 rpm for 10 min at 4 °C, and stored at –80 °C. The levels of aspartate amino transferase (AST), alanine amino transferase (ALT), alkaline phosphatase (ALP), urea, creatinine (Cr), fast blood sugar 6 (FBS), cholesterol (Chol), triglyceride (TG), bilirubin (total (TB) and direct (DB)), and creatine phosphokinase (CPK) in serum were determined using Biorex diagnostic kits (Antrim, UK).
Oxidative stress and antioxidant enzyme activities measurement
The first isolated organs including right kidney, right testis, brain, liver, heart, and spleen were rapidly excised, rinsed by ice-cold saline, and stored at –80 °C. An approximately 100 mg of the tissues was then homogenized in phosphate-buffered saline (PBS, pH 7.4) on ice using T-18 Ultra Turraks homogenizer (IKA, Germany) and then were centrifuged at 12,000 rpm at 4 °C for 10 min. The supernatants were used to determine GSH and MDA levels as well as SOD and CAT activities. The protein content in the supernatants was measured using Bradford dye binding method while bovine serum albumin (BSA) was applied as standard [Citation15]. The levels of GSH were determined by its reaction with dithionitrobenzoic acid (DTNB) to develop a yellow color that absorbs at 412 nm [Citation16]. Lipid peroxidation (LPO) was evaluated using the quantification of MDA reaction with thiobarbituric acid (TBA) to produce MDA-TBA complex, and the developed red color of the reaction was measured at 532 nm with a spectrophotometer [Citation17]. The activity of SOD was determined based on the ability of SOD to inhibit the autoxidation of the pyrogallol [Citation18]. The CAT activity was measured by calculating the H2O2 decomposition rate [Citation19].
Western blotting
Western blotting was performed according to the method described by Rahimi et al. [Citation20]. Briefly, the sample tissues were homogenized with a manual homogenizer and then incubated with lysis buffer. The concentration of extracted proteins was estimated with bicinchoninic acid (BCA) and separated by electrophoresis on 10% sodium dodecyl sulphate-polyacrylamide gel (SDS-PAGE), and then transferred to PVDF. Membranes were then immunoblotted with anti-cleaved-caspase-3 and anti β-actin as internal control. Later, it was incubated with horse-radish peroxidase (HRP)-conjugated secondary antibody for 1 h at room temperature. Detection was performed using a chemiluminescence Western Blotting Kit on X-ray film. The specimen optical density was analyzed using ImageJ software (NIH; USA), normalized to β-actin.
Zn content analysis in tissues
The levels of Zn in kidney, testis, brain, liver, heart, and spleen were determined with flame atomic absorption spectrophotometer (AAS; Shimadzu, AA-670, Japan) after exposing the animal to biogenic Zn NPs and ZnSO4. The lower detection limit of this instrument for Zn was 0.01 µg/mL. Before analysis, the AAS was calibrated every time by running at least eight standard concentrations of Zn (0.05, 0.1, 0.2, 0.3, 0.5, 0.8, 1, and 1.50 mg/L). Briefly, 100 mg of the sample tissues were digested overnight in 0.5 ml of concentrated nitric acid. Then, 0.5 ml of the concentrated nitric acid:perchloric acid mixture (6:1) was added to each sample and heated to 80–90 °C until the solutions were colorless and clear. The final clear residue was adjusted to a final volume of 10 ml with deionized water and it was determined by AAS.
Histopathology examination
The second isolated organs including the right kidney, right testis, brain, liver, heart, and spleen were fixed in formalin 10% (v/v), embedded in paraffin, and processed for histopathological observation. Then, the histological sections of 5 μm in thickness were stained using hematoxylin and eosin (H & E) stain and studied by a routine light microscope (Olympus CA.31, Japan).
Statistical analysis
The results were presented as mean ± standard deviation (SD). To compare the experimental values GraphPad Prism software (version 6, San Diego, CA, USA) was applied for statistical analyses. The difference between the experimental group and the control was illustrated by one-way ANOVA; if the F value (degree of freedom (df) between groups, within groups and total) was found to be significant, differences between means were then analyzed with the post-hoc Tukey test, and statistically significant difference was considered to be p < .05.
Results
Synthesis and characterization of biogenic Zn NPs
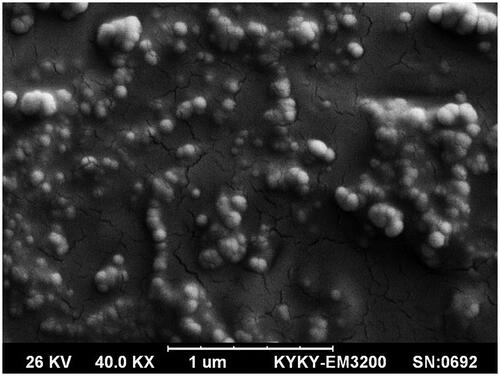
As presented in , the SEM image of biogenic Zn NPs revealed that these NPs have the spherical shape and show some aggregate of various sizes. The SEM image also displayed that biogenic Zn NPs were in the range of 30–80 nm.
Figure 1. A scanning electron microscope (SEM) image of biogenic Zn NPs produced with a green microwave-assisted synthesis using L. vera leaf extract.
Median lethal dose (LD50)
Different doses of 1, 2, 3, 4, 5 and 5.5 g/kg of biogenic Zn NPs were selected to determine the acute oral toxicity. No animal death was observed after administering the highest dose of 5.5 g/kg of biogenic Zn NPs. Therefore, the LD50 of biogenic Zn NPs was more than 5 g/kg in mice and classified as non-toxic chemicals.
Body weight
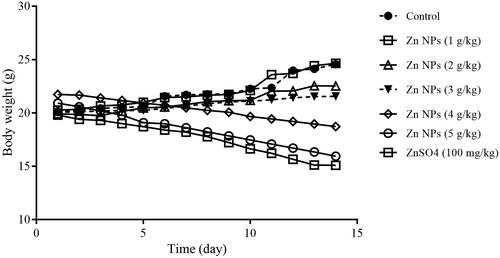
As shown in , the mean body weight of male mice that received biogenic Zn NPs at higher doses of 4 and 5 g/kg and ZnSO4 at the dose of 100 mg/kg were decreased. Other groups in similar with control group indicated a normal growth and the weight of animals has increased. A low oral toxicity of biogenic Zn NPs was demonstrated at three doses of 1, 2, and 3 g/kg after 14 days consequence in mice.
Figure 2. Mean body weight of mice administered biogenic Zn NPs at doses of 1, 2, 3, 4 and 5 g/kg and ZnSO4 at the dose of 100 mg/kg for 14 consecutive days.
Biochemistry parameters in whole blood
The levels of the hematological parameters on whole blood after the oral administration of biogenic Zn NPs (1, 2, 3, 4 and 5 g/kg), and ZnSO4 at the dose of 100 mg/kg for 14 days are indicated in . HGB significantly decreased in the presence of biogenic Zn NPs at the dose of 5 g/kg (p = .009), while no significant change was found with regards to the treatment of biogenic Zn NPs at the lower doses of 1, 2, 3 and 4 g/kg or ZnSO4 at the dose of 100 mg/kg when compared with the control.
Table 1. Hematology parameters in whole blood.
Biochemistry parameters in serum
Clinical biochemistry parameters at various doses of biogenic Zn NPs (1, 2, 3, 4 and 5 g/kg) and ZnSO4 at the dose of 100 mg/kg were estimated in serum after 14 days treatment, and the results are compared with the control group. As shown in , liver enzymes including AST, ALT, and ALP were increased dose-dependently after exposure to biogenic Zn NPs. However, significant differences were observed in treatment with higher doses of Zn NPs (3, 4 and 5 g/kg), and ZnSO4 at the dose of 100 mg/kg when compared with the control. Urea and Cr which are biomarkers of renal injury significantly increased with biogenic Zn NPs at the dose of 5 g/kg (p = .049 and p = .038, respectively), when compared with the control. However, significant differences were observed after treatment with higher doses of biogenic Zn NPs (3, 4 and 5 g/kg), and ZnSO4 at the dose of 100 mg/kg, when compared with the control. FBS significantly elevated with biogenic Zn NPs at the dose of 5 g/kg and ZnSO4 at the dose of 100 mg/kg (p = .004 and p = .005, respectively). Lipid profile including Chol and TG were significantly increased with biogenic Zn NPs at the dose of 5 g/kg (p = .047 and p = .007, respectively). However, no significant change was observed in TB and DB serum parameters when biogenic Zn NPs at doses of 1, 2, 3, 4 and 5 mg/kg or ZnSO4 at the dose of 100 mg/kg were administered as compared to the control group. Creatine phosphokinase (CPK) is an enzyme expressed by various tissues, especially in the heart, brain, and skeletal muscle, which was significantly elevated following the administration of biogenic Zn NPs at doses of 4 and 5 g/kg (p = .001 and p < .001, respectively) or ZnSO4 (100 mg/kg; p < .001) when compared with the control.
Table 2. Clinical biochemistry parameters in serum.
Lipid peroxidation
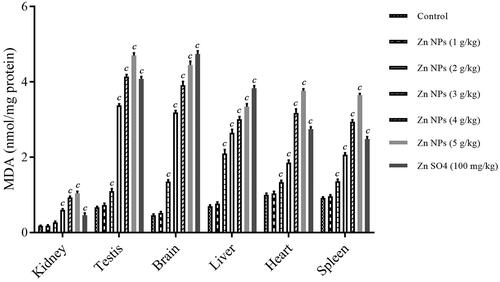
The LPO was quantified by measuring MDA as one of the final products of oxidative modification of polyunsaturated fatty acids. ANOVA analysis showed the statistically significant difference with a F value (6, 14, 20) of 277.6 and p < .001 for kidney, F value (6, 14, 20) of 3363.7 and p < .001 for testis, F value (6, 14, 20) of 2090.3 and p < .001 for brain, F value (6, 14, 20) of 873.3 and p < .001 for liver, F value (6, 14, 20) of 952.9 and p < .001 for heart, and F value (6, 14, 20) of 1403.8 and p = 0.000 for spleen. There was significant increase in the levels of MDA in mouse kidney after treatment with biogenic Zn NPs at high doses of 3, 4 and 5 g/kg (p < .001), and in mouse testis, brain, liver, heart, and spleen after treatment with biogenic Zn NPs at higher doses (more than 1 g/kg) and ZnSO4 at the dose of 100 mg/kg (p < .001) in these tissues, when compared with the control group (. The levels of MDA were dose-dependently increased after exposure to biogenic Zn NPs. The highest increase in MDA level was found in sampled tissues after 14 days treatment with biogenic Zn NPs at the dose of 5 g/kg (p < .001) when compared with the control.
Figure 3. Malondialdehyde (MDA) level in mice kidney, testis, brain, liver, heart, and spleen tissuesof the control group, and those treated with biogenic Zn NPs at the dose of 1.2, 2.4, and 6 mg/kg and ZnSO4 at the dose of 100 mg/kg. cp < .001 compared to the control.
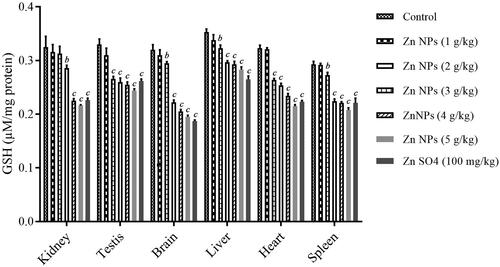
Glutathione content
The GSH content is considered as the OS marker. ANOVA analysis showed the statistically significant difference with a F value (6, 14, 20) of 58.7 and p < .001 for kidney, F value (6, 14, 20) of 54.04 and p < .001 for testis, F value (6, 14, 20) of 291.2 and p < .001 for brain, F value (6, 14, 20) of 78.6 and p < .001 for liver, F value (6, 14, 20) of 460.02 and p < .001 for heart, and F value (6, 14, 20) of 168.2 and p < .001 for spleen. As shown in , there was significant reduction in GSH levels in mouse kidney in biogenic Zn NPs group at higher doses (3, 4, and 5 g/kg), and in mouse liver, kidney, testis, brain, liver, heart, and spleen in biogenic Zn NPs group at higher doses (more than 1 g/kg) and ZnSO4 at the dose of 100 mg/kg, when compared with the control (. Furthermore, results have shown that increased GSH level was dose-dependent because when the biogenic Zn NPs dose was increased, a reduction in GSH levels were observed. However, no significant decrease was found in GSH content in mouse kidney, testis, brain, liver, heart, and spleen after 14 days treatment with biogenic Zn NPs at the dose of 1 g/kg when compared with the control.
Figure 4. Glutathione (GSH) content in mice kidney, testis, brain, liver, heart, and spleen tissues ofthe control group, and those treated with biogenic Zn NPs at the dose of 1.2, 2.4, and 6 mg/kg and ZnSO4 at the dose of 100 mg/kg. bp < .01, and cp < .001 compared to the control.
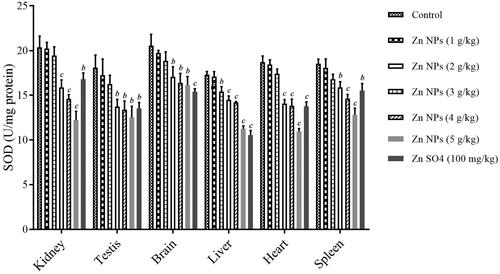
Super oxide dismutase (SOD) activity
Besides GSH, the activity of antioxidant enzymes including SOD and CAT were estimated to evaluate the toxicity of drugs or chemicals in tissues. OS can develop as a result of decrease in antioxidant enzymes such as SOD activity to induce tissue damage. ANOVA analysis showed the statistically significant difference with a F value (6, 14, 20) of 37.7 and p < .001 for kidney, F value (6, 14, 20) of 10.1 and p < .001 for testis, F value (6, 14, 20) of 13.6 and p < .001 for brain, F value (6, 14, 20) of 111.04 and p < .001 for liver, F value (6, 14, 20) of 87.6 and p < .001 for heart, and F value (6, 14, 20) of 24.8 and p < .001 for spleen. As shown in , treatment with biogenic Zn NPs was found to dose-dependently decrease the activity of SOD in sampled tissues when compared with the control. There was a significant reduction in SOD activity in mouse kidney, testis, brain, liver, heart, and spleen in the biogenic Zn NPs group at higher doses and ZnSO4 at the dose of 100 mg/kg when compared with the control (. In addition, a significant reduction in SOD activity was found in mouse-sampled tissues after 14 days treatment with biogenic Zn NPs at the higher dose of 5 g/kg, when compared with the control.
Figure 5. Super oxide dismutase (SOD) activity in mice kidney, testis, brain, liver, heart, and spleen tissues of the control group, and those treated with biogenic Zn NPs at the dose of 1.2, 2.4, and 6 mg/kg and ZnSO4 at the dose of 100 mg/kg. bp < .01, and cp < .001 compared to the control.
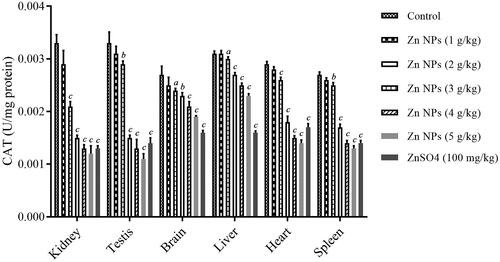
Catalase (CAT) activity
As shown in , the CAT activity as another OS index was also estimated in kidney, testis, brain, liver, heart, and spleen. Reduction in CAT activity was in associated with OS-induced injury. ANOVA analysis showed the statistically significant difference with a F value (6, 14, 20) of 111.4 and p < .001 for kidney, F value (6, 14, 20) of 172.2 and p < .001 for testis, F value (6, 14, 20) of 45.2 and p < .001 for brain, F value (6, 14, 20) of 400.6 and p < .001 for liver, F value (6, 14, 20) of 354.1 and p < .001 for heart, and F value (6, 14, 20) of 489.4 and p < .001 for spleen. Treatment with various doses of biogenic Zn NPs (1, 2, 3, 4 and 5 g/kg) indicated a dose-dependent reduction in the activities of CAT. There was a significant decrease in CAT index in mouse kidney, testis, brain, liver, heart, and spleen in the biogenic Zn NPs group at the higher dose (more than 1 g/kg) and ZnSO4 at the dose of 100 mg/kg when compared with the control. However, a significant reduction in CAT activity was found in mouse-sampled tissues after 14 days treatment with biogenic Zn NPs at the administered doses of 5 g/kg when compared with the control.
Figure 6. Catalase (CAT) activity in mice kidney, testis, brain, liver, heart, and spleen tissues of the control group, and those treated with biogenic Zn NPs at the dose of 1.2, 2.4, and 6 mg/kg and ZnSO4 at the dose of 100 mg/kg. ap < .05, bp < .01, and cp < .001 compared to the control.
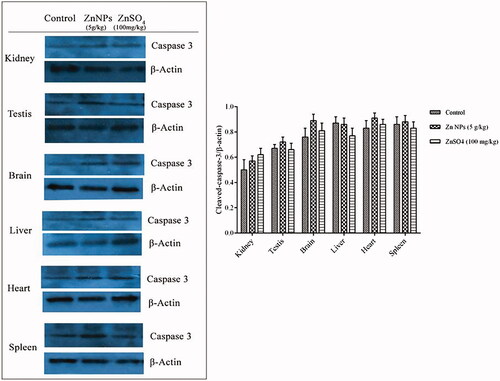
Cleaved-caspase-3 expression
To further explore the mechanism of biogenic Zn NPs function at the higher dose (5 g/kg) on tissues injury, we used western blot to evaluate the expression of cleaved-caspase-3 in sampled tissues. Positive immunoreactivities of cleaved-caspase-3 lead to cell apoptosis or death to drive tissue damage. As shown in , no significant changes in the expression of cleaved-caspase-3 were observed in brain tissue after 14 days treatment with 5 g/kg of biogenic Zn NPs when compared with the brain control. The expression of cleaved-caspase-3 in the other organs was also determined, and no significant differences were established. Therefore, the results showed that tissues injury-induced with biogenic Zn NPs at the dose of 5 g/kg were independent to the caspase pathway.
Figure 7. Effect of biogenic Zn NPs at the dose of 5 g/kg on the expression of cleaved-caspase-3 in mice kidney, testis, brain, liver, heart, and spleen tissues in comparison to their control.
Zn content
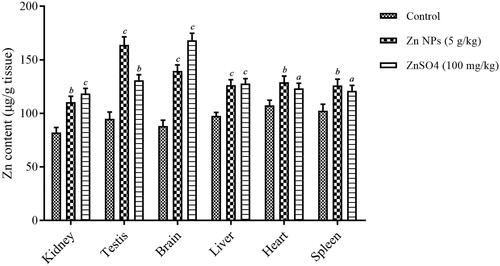
The accumulation of biogenic Zn NPs at the dose of 5 g/kg and ZnSO4 at the dose of 100 mg/kg is shown in . ANOVA analysis showed the statistically significant difference with a F value (2, 6, 8) of 43.9 and p < .001 for kidney, F value (2, 6, 8) of 82.5 and p < .001 for testis, F value (2, 6, 8) of 143.2 and p < .001 for brain, F value (2, 6, 8) of 45.1 and p < .001 for liver, F value (2, 6, 8) of 13.9 and p = .006 for heart, and F value (2, 6, 8) of 14.1 and p = .005 for spleen. After 14 consequence days of exposure to biogenic Zn NPs, a significant increase of Zn contents were found in the testis, liver, and brain (p < .001), in comparison to control. Furthermore, the significant increase of Zn contents was observed in the liver, brain, and kidney (p < .001), following treatment with ZnSO4, when compared with the control. The highest Zn content was found in testis, liver, and brain of the mice treated with biogenic Zn NPs and ZnSO4, respectively, when compared with the control.
Figure 8. Content of Zn in mice kidney, testis, brain, liver, heart, and spleen tissues exposed to biogenic Zn NPs at the dose of 5 g/kg and ZnSO4 at the dose of 100 mg/kg. ap < .05, bp < .01, and cp < .001 compared to the control.
Histopathology findings
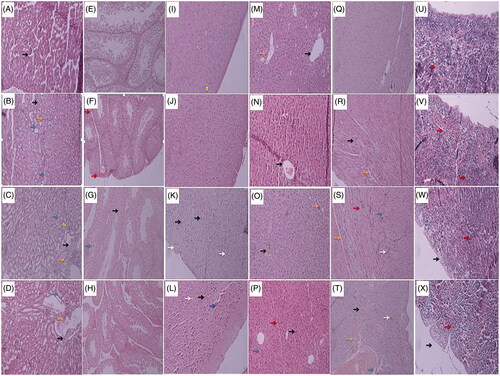
Treatment-related changes in mouse kidney, testis, brain, liver, heart, and spleen were confirmed by H & E histology examinations in the group of biogenic Zn NPs (1 and 5 g/kg) and ZnSO4 (100 mg/kg) when compared with the control. In all sections, approximately no significant histopathological changes were observed in mouse sampled tissues treated with biogenic Zn NPs at the dose of 1 g/kg, when compared with the control. However, significant histopathological changes were found in mouse sampled tissues after 14 days treatment with biogenic Zn NPs at the dose of 5 g/kg and ZnSO4 at the dose of 100 mg/kg. In the kidney, congestion and dilatation of vessels, congestion of glomeruli, interstitial mononuclear cells infiltration, and intratubular protein deposition were observed in the biogenic Zn NPs (5 g/kg) group (). In the testis, interstitial edema, sever tubular injury, sloughing and disorganization, necrotic mature and immature spermatocytes and many abnormal-appearing residual bodies were indicated in the biogenic Zn NPs (5 g/kg) group (). In the brain, edema, cerebral spongiosis and some red blood cells were out of the arteries, vascular congestion, neuronal vacuolization and gliosis were seen in the biogenic Zn NPs (5 g/kg) group (). In the liver, hydropic degeneration and enlargement of hepatocytes, increased binucleated hepatocytes and mitotic figures, kupffer cells proliferation, central and portal vein congestion with portal and focal lobular inflammation were indicated in the biogenic Zn NPs (5 g/kg) group (). In the heart, edema, some vacuolization of myocytes, mononuclear cell infiltration, myocardial damage in the presence of hypereosinophilic cardiomyocytes were observed in the biogenic Zn NPs (5 g/kg) group (). In the spleen, mild thickening of the capsule and trabecula (blackish arrow), congestion of red pulp, dense basophilia of the cortex (cluster of lymphocytes other than white pulp) and mildly increased megakaryocytes were revealed in the biogenic Zn NPs (5 g/kg) group (). Therefore, biogenic Zn NPs exhibit near the normal histopathological features and lesser tissues damage is observed than ZnSO4 (100 mg/kg).
Figure 9. Histopathology of kidney, testis, brain, liver, heart, and spleen in mice treated with biogenic Zn NPs at two doses of 1 and 5 g/kg and ZnSO4 at the dose of 100 mg/kg for 14 consecutive days (H & E stain with × 100 magnifications). Control group: no pathologic changes were observed in normal glomeruli (black arrow) and tubules. (A), kidney of mouse treated with Zn NPs at dose of 1 g/kg group showed mild congestion (black arrow), mild focally mononuclear cell infiltration (orange arrow) and intratubular protein deposition (blue arrows) (B); kidney of mouse treated with Zn NPs at dose of 5 g/kg group showed congestion and dilatation of vessels (black arrow), congestion of glomeruli (green arrow), mononuclear cell infiltration (orange arrows) and intratubular protein deposition (bluish arrows) (C), kidney of mouse treated with ZnSO4 at the dose of 100 mg/kg group showed congestion and dilatation of vessels (black arrow), focally mild mononuclear cell infiltration (orange arrows) and intratubular protein deposition (blue arrows) (D). Control group: normal appearance (closely packed seminiferous tubules) (E), testis of mouse treated with Zn NPs at dose of 1 g/kg group showed closely packed seminiferous tubules, mild congestion and dilatation (red arrows) (F); testis of mouse treated with Zn NPs at dose of 5 g/kg group showed necrotic mature and immature spermatocytes (black arrow) and many abnormal-appearing residual bodies (blue arrows) (they are larger than normal residual bodies and often occur in tubular stages not normally associated with residual body formation) (G), testis of mouse treated with ZnSO4 at the dose of 100 mg/kg group showed mild to moderate tubular injury, sloughing and disorganization with interstitial edema (increased spaces between the tubules) (H). Control group: normal histopathology in brain cortex tissue (I), Brain cortex of mouse treated with Zn NPs at dose of 1 g/kg group was changed the same as control (J); the cerebral cortex at dose of 5 g/kg of Zn NRs showed mild edema (spongiosis), vascular congestion, neuronal vacuolization, some cellular injuries as red degeneration with pyknotic nuclei and eosinophilic cytoplasm and also the proliferation of reactive astrocytes (gliosis) (K), brain cortex of mouse treated with ZnSO4 at the dose of 100 mg/kg group showed moderate edema (spongiosis), the proliferation of reactive astrocytes (gliosis), marked cellular injuries as red degeneration with pyknotic nuclei and eosinophilic cytoplasm, vascular congestion and extravasation of RBC (L). Control group: no histopathologic changes with normal architecture, central vein (black arrows) and portal tract (orange arrow) (M), liver of mouse treated with Zn NPs at dose of 1 g/kg group showed central vein congestion (blackish arrow), and focally mild lobular inflammation (bluish arrow) (N); liver of mouse treated with Zn NPs at dose of 5 g/kg group showed central vein congestion (black arrow), and focal lobular inflammation (orange arrows) (O); liver of mouse treated with ZnSO4 at the dose of 100 mg/kg group showed sinusoidal congestion, cholestasis (red arrows) and kupffer cell proliferation (orange arrows) with increased binucleated hepatocytes (blackish arrow) (P). Control group: no pathological changes (Q), heart of mouse treated with Zn NPs at dose of 1 g/kg group showed mild congestion (black arrow) and mild edema (orange arrow)(R); heart of mouse treated with Zn NPs at dose of 5 g/kg group showed edema (orange arrow), some vacuolization of myocytes (blue arrows), mononuclear cells infiltration (whitish arrow), myocardial damage as presence of hypereosinophilic cardiomyocytes (reddish arrow) (S), heart of mouse treated with ZnSO4 at the dose of 100 mg/kg group showed some vacuolization of myocytes, congestion (black arrow), edema (orange), mononuclear cell infiltration (whitish arrow) and hemorrhage (green arrow) (T). Control group: no pathological changes with some megakaryocytes (red arrows) (U), spleen of mouse treated with Zn NPs at dose of 1 g/kg group showed congestion of red pulp and mild increase of megakaryocytes (red arrows) (V); spleen of mouse treated with Zn NPs at dose of 5 g/kg group showed mild thickening of the capsule, trabecula (black arrow), congestion of red pulp, dense basophilia of the cortex (cluster of lymphocytes other than white pulp) and mild increased megakaryocytes (red arrows) (W), spleen of mouse treated with ZnSO4 at the dose of 100 mg/kg group showed thickening of the capsule and trabecula (black arrow), with dense basophilia of the cortex (cluster of lymphocyte other than white pulp) and mild increased megakaryocytes (red arrows) less than Zn NPs at the dose of 5 g/kg group (X).
Discussion
Zn is an essential trace element in human health. The biosynthesis of such valuable trace elements at nanoscale prepared by new, simple and fast microwave-assisted synthesis method with the potential application of herbal extracts (L. vera) or other natural sources has attracted considerable attention in recent years. However, few data have been published on biogenic NPs produced by this nanotechnology method. Therefore, in this study, the acute and sub-acute oral toxicity of biogenic Zn NPs was investigated in mice after 14 days of treatment with biogenic Zn NPs at doses of 1, 2, 3, 4 and 5 g/kg, and compared with ZnSO4 at the dose of 100 mg/kg. For this purpose, the general toxicology aspects including changes in the body weight, biochemical parameters in serum and whole blood were estimated. Also, the underlying mechanisms were evaluated based on the development of OS (increased OS biomarkers or indices) and apoptosis by determining the expression of cleaved-caspase-3 protein by using a western blotting and Zn content in sampled tissues by AAS methods, respectively, further confirmed by treatment-related changes in H & E histopathological examinations.
The biogenic Zn NPs were characterized by SEM. It was observed that biogenic Zn NPs had a spherical shape with a wide size range of 30–80 nm. The shape and size of NPs are important factors which could influence their toxicity. If NPs have a more spherical shape and lower size, they could penetrate more to the cell or tissue causing further toxic effects [Citation21,Citation22].
In the present study, the oral route was selected as the current route of exposure for mice. The LD50 value of biogenic Zn NPs was evaluated to be above 5 g/kg in mice. According to the toxicity classification of the chemical substance, WHO and European Commission Directive 83/467/EEC, 1983, when LD50 was more than 2000 mg/kg, they were considered as practically non-toxic chemicals [Citation23]. The LD50 value may be used to compare the acute toxicity of chemicals. One of the beneficial properties of biologically synthesized NPs was lower LD50 value and acute toxicity compared to their inorganic salt [Citation5,Citation24]. Changes in the body weight occurred as a measure of toxicity in a subacute study [Citation5,Citation24]. The body weight declined during 14 consecutive daily administrations of biogenic Zn NPs, especially at higher doses of 4 and 5 g/kg, and ZnSO4 at the dose of 100 mg/kg. This reduction was not found when lower doses (1, 2, and 3 g/kg) of biogenic Zn NPs were administrated. Studies have suggested that animals better tolerated high doses of biogenic trace elements (selenium and tellurium) than their inorganic forms and thus, low degree of toxicity may occur in animals treated with biogenic compounds [Citation5,Citation24].
Changes in hematological and serum biochemical parameters also represented a predictive value to evaluate toxicity in animal studies [Citation5]. The WBC diminished dose-dependently, which may result in weakening of immune system. However, they were not significant when compared to the control. RBC and HGB also dropped dose-dependently (significantly for HGB), suggesting that the daily oral administration of biogenic NPs at higher doses may affect the hematopoietic function. Other alterations such as Hct and PLT were considered being toxicologically irrelevant due to changes within normal biological variation limits. For serum biochemical parameters, alterations in liver enzymes including AST, ALT, and ALP increased dose-dependently after 14 days of treatment with biogenic Zn NPs (3, 4, and 5 g/kg); however, no significant changes were observed at lower doses (1 and 2 g/kg). Transaminases such as AST, ALT, and ALP are biomarker enzymes used to diagnose liver toxicity [Citation25–27]. It was observed that the risk of liver toxicity may occur with biogenic Zn NPs at higher doses. Urea and Cr are biomarkers related to the renal function used to predict possible toxicity in nephrons [Citation28]. Significant increases of Urea and Cr were recorded in biogenic Zn NPs at the higher dose of 5 g/kg, suggesting the risk of nephrotoxicity at this dose. Higher oral administration of biogenic Zn NPs (5 g/kg) and ZnSO4 at the dose of 100 mg/kg could disturb blood glucose regulation and result in hyperglycemia. Lipid profile including Chol and TG were also significantly elevated with biogenic Zn NPs at the dose of 5 g/kg after an exposure of 14 consequence days. The body weight loss of male rats in biogenic Zn NPs at doses of 4 and 5 g/kg and ZnSO4 at the dose of 100 mg/kg may be related to metabolic disorders, which is related to FBS (glucose) and lipid metabolism indices. CPK was another biomarker which indicated tissue injury, which significantly grew following the administration of biogenic Zn NPs at doses of 4 and 5 g/kg.
Oxidative mechanism and rise of OS indices were also observed as being involved in inducing cellular and organs toxicity after exposure to NPs, leading to apoptosis or necrosis [Citation5,Citation22]. The dual protective and toxic role for Zn-containing compounds based on the dose administered has been found in different studies [Citation29,Citation30]. These roles have been attributed to regulating OS, ions homeostasis, and protein synthesis [Citation30,Citation31]. In this regard, Zn deficiency may be associated with impaired Zn homeostasis, resulting in OS events as an early phenomenon in Alzheimer’s disease [Citation29]. On the other hand, zinc oxide nanoparticles (ZnO NPs) have induced genotoxicity through the generation of reactive oxygen species (ROS) such as superoxide radical-induced OS derived from mitochondrial dysfunction [Citation30]. In this regard, the levels of MDA as LPO biomarker, GSH content and antioxidative enzyme activities such as SOD and CAT were determined as valuable OS indices. The levels of MDA rose dose-dependently, while the GSH contents and the activities of SOD and CAT dropped dose-dependently after 14 consecutive days of exposure to biogenic Zn NPs. There was significant elevation in the levels of MDA in mouse kidney after treatment with biogenic Zn NPs at high doses of 3, 4, and 5 g/kg (p < .001), and in mouse testis, brain, liver, heart, and spleen after treatment with biogenic Zn NPs at higher doses (more than 1 g/kg) and ZnSO4 at the dose of 100 mg/kg (p < .001) in these tissues, with the highest elevation of biogenic Zn NPs at the dose of 5 g/kg, when compared with the control group. In addition, there was significant reduction in GSH contents in mouse kidney in biogenic Zn NPs group at higher doses (3, 4 and 5 g/kg), and in mouse liver, kidney, testis, brain, liver, heart, and spleen in biogenic Zn NPs group at higher doses (more than 1 g/kg) and ZnSO4 at the dose of 100 mg/kg, when compared with the control. Moreover, there was a significant reduction in SOD activity in mouse kidney, testis, brain, liver, heart, and spleen in the biogenic Zn NPs group at higher doses and ZnSO4 at the dose of 100 mg/kg when compared with the control. Furthermore, there was a significant reduction in CAT index in mouse kidney, testis, brain, liver, heart, and spleen in the biogenic Zn NPs group at the higher dose (more than 1 g/kg) and ZnSO4 at the dose of 100 mg/kg when compared with the control. The changes were not significant in these OS indices in most sampled tissues in biogenic Zn NPs at the dose of 1 g/kg, when compared with the control. It has been reported that Zn-containing nanocompounds (such as ZnO NPs) at their toxic effects or doses could raise the concentration of MDA and reduce the GSH contents. Also, they can reduce the activities of antioxidative enzymes, such as SOD, CAT, glutathione reductase (GR), glutathione peroxidase (GPx), and glutathione-S-transferase (GST), which may be used to investigate the toxicity of these compounds in animals [Citation32].
High ROS levels can cause OS and may directly contribute to tissue cellular damage related to the expression of caspase-3. It has been reported that OS induced apoptosis and one of the important proteins in internal and external pathway of apoptosis was caspase-3 [Citation33]. Therefore, caspase-3 expression could increase in cells when exposed to toxic chemicals, and the overexpression of caspase-3 was in accordance with the damage to the tissues. Therefore, in this study, we aimed to examine the association of apoptosis by determining the expression of cleaved-caspase-3 as the proteins are known to mediate apoptosis in the presence of OS after 14 consequence days of exposure to biogenic Zn NPs (5 g/kg) in mouse sampled tissues. The results indicated that OS events were independent of caspase-3 activity and other molecular mechanisms may be involved. There is controversy over the activation of caspase pathway associated with the toxicity of NPs [Citation22,Citation33]. Silver nanoparticles (AgNPs) have been shown to induce OS in human colon cancer cells through increased LPO and reduced GSH levels with the induction of mitochondria-involved apoptosis via the elevated levels of Bcl and caspase-3 proteins [Citation34]. ZnO NPs have also proved to induce the expression of the genes attributed to ROS generation, OS damage and apoptosis such as Bax, p53, caspase-3 and caspase-9 [Citation35]. Another study has also demonstrated that biogenic NPs (tellurium nanorods) induced necrosis or late apoptosis without altering the activity of caspase pathway [Citation22]. Therefore, both apoptosis and necrosis may occur after exposure to NPs. Furthermore, nickel nanoparticles (Ni NPs) have been reported to induce reproductive toxicity through significantly enhancing the mRNA expressions of caspase-3, caspase-8, and caspase-9 as well as the expressions of Fas, Cyt c, Bax, and Bid protein on the ovaries [Citation36]. Therefore, both intrinsic and extrinsic apoptosis may occur as a response to the administration of NPs, which motivated us to further research and consider the molecular mechanisms underlying biogenic NPs.
When NPs are orally administered, they can be distributed to various organs due to their small size. They can be absorbed from the intestine and distribute into the blood, brain, lung, kidney, heart, liver, spleen, and stomach [Citation37]. This study demonstrated that biogenic Zn NPs distributed in different organs and mainly accumulated in the testis, liver, and brain. Therefore, these organs may be at a risk of toxicity and be the target of biogenic Zn NPs. It has been reported that ∼85% of Zn is distributed in the bone and muscle, and about 11% in the skin and the liver, while the remaining is distributed in other tissues [Citation38]. However, target organs for NPs can be different, since the liver and spleen are the main target organs for cerium oxide, and liver, pancreas, and kidney for iron oxide NPs [Citation39,Citation40]. The size of NPs may also affect its distribution in different tissues, as 20 and 120 nm ZnO were mostly retained in the bone, kidney, and pancreas [Citation41]. However, a few published data in this regards already exist. Therefore, further study to determine the distribution of different NPs with specific properties produced by various green or nanotechnology methods in tissues should be investigated. These bio-distribution findings can provide useful information in predicting toxicity in exposure to NP compounds.
The histopathological analysis confirmed the biochemical and molecular results, with the most significant changes found in mouse sampled tissues after 14 days of treatment with biogenic Zn NPs at the dose of 5 g/kg and ZnSO4 at the dose of 100 mg/kg. Here, vasocongestion and vasodilatation, congestion of glomeruli, infiltration of interstitial mononuclear cells and intratubular protein deposition along with some tubular cells detachment and swelling in epithelial cells of proximal tubules were found in the kidney, which was associated with high serum levels of Urea and Cr as well as oxidative damages. In the liver, the histopathological changes in the groups treated with high doses of biogenic NPs (5 g/kg) included hydropic degeneration and enlargement of hepatocytes, increased binucleated hepatocytes and mitotic figures, proliferation of kupffer cells, central and portal vein congestion with portal and focal lobular inflammation. All these indicated the damage of liver hepatocytes and the risk of liver toxicity. This liver toxicity confirmed the biochemical results and could be monitored by measuring the serum levels of AST, ALT, and ALP enzymes. The histopathogilical changes may be persistent or transiently occur, and the signs might be reversible after discontinuing NPs treatment [Citation5]. Furthermore, the results indicated no significant histopathological changes after exposure with biogenic Zn NPs at the dose of 1 g/kg, and its histological findings were similar to those of the control.
Conclusion
In conclusion, this study demonstrated for the first time valuable data on the acute and sub-acute toxicity profile of biogenic Zn NPs prepared using a green microwave-assisted synthesis using L.vera leaf extract. The acute oral toxicity results classified this biogenic Zn NPs as a practically non-toxic substance for mice. The sub-acute toxicity associated with changes in the body weight, hematological parameters, and OS indices indicated that the biogenic Zn NPs at the dose of 1 g/kg did not have toxicological effects, and no significant differences were found in these factors when compared with the control. The testis, liver, and brain may be the main target organs of biogenic Zn NPs, and may be at risk of toxicity and thus, should be monitored during biogenic Zn NPs treatment. Possible toxic mechanisms of biogenic Zn NPs were associated with OS biomarkers independent of caspase pathway, requiring further study to be designed in this regard. Histopathological results of vital organs showed damage in the kidney, testis, liver, brain, heart, and spleen, which were confirmed by biochemical and molecular analyses. Therefore, the biogenic Zn NPs at the dose of 1 g/kg were less toxic and better tolerated than the higher orally administrated doses or inorganic forms such as ZnSO4 at the dose of 100 mg/kg.
Acknowledgements
We thank the Iran Nanotechnology Initiative Council (INIC) for their admirable participation in this study, and for financially supported by Deputy of Research, Kerman University of Medical Sciences (Kerman, Iran).
Disclosure statement
No potential conflict of interest was reported by the authors.
Additional information
Funding
Related Research Data
References
- Mandal D, Bolander ME, Mukhopadhyay D, et al. The use of microorganisms for the formation of metal nanoparticles and their application. Appl Microbiol Biotechnol. 2006;69:485–492.
- Murray CB, Kagan CR. Synthesis and chracterization of monodisperse nanocrystals and closed-packed nanocrystal assemblies. Annu Rev Mater Sci. 2000;30:545–610.
- Bhattacharya D, Gupta RK. Nanotechnology and potential of microorganisms. Crit Rev Biotechnol. 2005;25:199–204.
- Salari Z, Ameri A, Forootanfar H, et al. Microwave-assisted biosynthesis of zinc nanoparticles and their cytotoxic and antioxidant activity. J Trace Elem Med Biol. 2017;39:116–123.
- Najimi S, Shakibaie M, Jafari E, et al. Acute and subacute toxicities of biogenic tellurium nanorods in mice. Regul Toxicol Pharmacol. 2017;90:222–230.
- Oremland RS, Herbel MJ, Blum JS, et al. Curran, structural and spectral features of selenium nanospheres produced by SE-respiring bacteria. Appl Environ Microbiol. 2004;70:52–60.
- Yee N, Ma J, Dalia A, et al. Se(VI) reduction and the precipitation of Se(0) by the facultative bacterium Enterobacter cloacae SLD1a-1 are regulated by FNR. Appl Environ Microbiol. 2007;73:1914–1920.
- Mohanpuria P, Rana NK, Yadav SK. Biosynthesis of nanoparticles: technological concepts and future applications. J Nanopart Res. 2008;10:507–517.
- Craddock PT. The composition of the copper alloys used by the Greek, Etruscan and Roman civilizations: 3. The origins and early use of brass. J Archaeol Sci. 1978;5:1–16.
- He L, Liu Y, Mustapha A, et al. Antifungal activity of zinc oxide nanoparticles against Botrytis cinerea and Penicillium expansum. Microbiol Res. 2011;166:207–215.
- Rasmussen JW, Martinez E, Louka P, et al. Zinc oxide nanoparticles for selective destruction of tumor cells and potential for drug delivery applications. Expert Opin Drug Deliv. 2010;7:1063–1077.
- Sindhura KS. Prasad TNVKV, Hussain OM. Synthesis and characterization of phytogenic zinc nanoparticles and their antimicrobial activity. ICANMEET. 2013;87–90. doi: 10.1109/ICANMEET.2013.6609242
- Taranath TC, Patil BN, Santosh TU, et al. Cytotoxicity of zinc nanoparticles fabricated by Justicia adhatoda L. on root tips of Allium cepa L. – a model approach. Environ Sci Pollut Res. 2015;22:8611–8617.
- Wang C, Cheng K, Zhou L, et al. Evaluation of long-term toxicity of oral zinc oxide nanoparticles and zinc sulfate in mice. Biol Trace Elem Res. 2017;178:276–282.
- Bradford MM. A rapid and sensitive method for the quantitation of microgram quantities of protein utilizing the principle of protein-dye binding. Anal Biochem. 1976;72:248–254.
- Beutler E, Duron O, Kelly BM. Improved method for the determination of blood glutathione. J Lab Clin Med. 1963;61:882–888.
- Ohkawa H, Ohishi N, Yagi K. Assay for lipid peroxides in animal tissues by thiobarbituric acid reaction. Anal Biochem. 1979;95:351–358.
- Li X. Improved pyrogallol autoxidation method: a reliable and cheap superoxide scavenging assay suitable for all antioxidants. J Agric Food Chem. 2012;60:6418–6424.
- Chen F, Gao J, Zhou Q. Toxicity assessment of simulated urban runoff containing polycyclic musks and cadmium in Carassius auratus using oxidative stress biomarkers. Environ Pollut. 2012;162:91–97.
- Rahimi HR, Dehpour AR, Mehr SE, et al. Lithium attenuates cannabinoid-induced dependence in the animal model: involvement of phosphorylated ERK1/2 and GSK-3β signaling pathways. Acta Med Iran. 2014;52:656–663.
- Verma A, Stellacci F. Effect of surface properties on nanoparticle-cell interactions. Small. 2010;6:12–21.
- Shakibaie M, Forootanfar H, Ameri A, et al. Cytotoxicity of biologically synthesised bismuth nanoparticles against HT-29 cell line. IET Nanobiotechnol. 2018;12:653–657.
- Ruiz P, Begluitti G, Tincher T, et al. Prediction of acute mammalian toxicity using QSAR methods: a case study of sulfur mustard and its breakdown products. Molecules. 2012;17:8982–9001.
- Shakibaie M, Shahverdi AR, Faramarzi MA, et al. Acute and subacute toxicity of novel biogenic selenium nanoparticles in mice. Pharma Biol. 2013;51:58–63.
- Balouchzadeh A, Rahimi HR, Ebadollahi-Natanzi AR, et al. Aqueous extract of Iranian green tea prevents lipid peroxidation and chronic ethanol liver toxicity in rat. J Pharmacol Toxicol. 2011;6:691–700.
- Nili-Ahmadabadi A, Rahimi HR, Tavakoli F, et al. Protective effect of pretreatment with thymoquinone against Aflatoxin B1 induced liver toxicity in mice. DARU. 2011;19:282–287.
- Rahimi HR, Gholami M, Khorram-Khorshid HR, et al. On the protective effects of IMOD and silymarin combination in a rat model of acute hepatic failure through anti oxidative stress mechanisms. Asian J Anim Vet Adv. 2012;7:38–45.
- Gowda S, Desai PB, Kulkarni SS, et al. Markers of renal function tests. N Am J Med Sci. 2010;2:170–173.
- Yuan Y, Niu F, Liu Y, et al. Zinc and its effects on oxidative stress in Alzheimer's disease. Neurol Sci. 2014;35:923–928.
- Yanagisawa H, Seki Y, Yogosawa S, et al. Potential role of mitochondrial damage and S9 mixture including metabolic enzymes in ZnO nanoparticles-induced oxidative stress and genotoxicity in Chinese hamster lung (CHL/IU) cells. Mutat Res. 2018;834:25–34.
- Pan J, Huang X, Li Y, et al. Zinc protects against cadmium-induced toxicity by regulating oxidative stress, ions homeostasis and protein synthesis. Chemosphere. 2017; 188:265–273.
- Abdelazim AM, Saadeldin IM, Swelum AA, et al. Oxidative stress in the muscles of the fish Nile tilapia caused by zinc oxide nanoparticles and its modulation by vitamins C and E. Oxid Med Cell Longev. 2018;2018:6926712.
- Khamchan A, Paseephol T, Hanchang W. Protective effect of wax apple (Syzygium samarangense (Blume) Merr. & L.M. Perry) against streptozotocin-induced pancreatic ß-cell damage in diabetic rats. Biomed Pharmacother. 2018;108:634–645.
- Dasgupta N, Ranjan S, Mishra D, et al. Thermal co-reduction engineered silver nanoparticles induce oxidative cell damage in human colon cancer cells through inhibition of reduced glutathione and induction of mitochondria-involved apoptosis. Chem Biol Interact. 2018;295:109–118.
- Du J, Cai J, Wang S, et al. Oxidative stress and apotosis to zebrafish (Daniorerio) embryos exposed to perfluorooctanesulfonate (PFOS) and ZnO nanoparticles. Int J Occup Med Environ Health. 2017;30:213–229.
- Kong L, Gao X, Zhu J, et al. Mechanisms involved in reproductive toxicity caused by nickel nanoparticle in female rats. Environ Toxicol. 2016;31:1674–1683.
- Hillyer JF, Albrecht RM. Gastrointestinal persorption and tissue distribution of differently sized colloidal gold nanoparticles. J Pharm Sci. 2001;90:1927–1936.
- Tapiero H, Tew KD. Trace elements in human physiology and pathology: zinc and metallothioneins. Biomed Pharmacother. 2003;57:399–411.
- Park K, Park J, Lee H, et al. Toxicity and tissue distribution of cerium oxide nanoparticles in rats by two different routes: single intravenous injection and single oral administration. Arch Pharm Res 2018;41:1108–1116.
- Dubreil C, Sainte Catherine O, Lalatonne Y, et al. Tolerogenic iron oxide nanoparticles in type 1 diabetes: biodistribution and pharmacokinetics studies in nonobese diabetic mice. Small 2018;14:e1802053.
- Wang B, Feng W, Wang M, et al. Acute toxicological impact of nano- and submicro-scaled zinc oxide powder on healthy adult mice. J Nanopart Res. 2008;10:263–276.