
Abstract
Introduction
Hepatocellular carcinoma (HCC) ranks fourth in global cancer mortality, accounting for 8.2% of all cancer deaths. Early detection of HCC has a significant impact on clinical outcomes. The aim of this study was to identify blood-based biomarkers which are HCC-specific.
Methods
Comprehensive gene expression raw data of purified RNA of peripheral blood mononuclear cells (PBMC) was downloaded from GEO and was then analyzed. Differentially expressed genes (DEGs) in HCC were screened and the method of weighted gene co-expression network analysis was applied to identify candidate blood-based biomarkers associated with HCC.
Results
Three modules closely related to HCC were screened using WGCNA. Nuclear localization signal (NLS)-bearing protein import into nucleus biological process was the most significant enriched physiological process identified by MCODE, and 3 genes (DICER1, GMPS and NCOR1) were selected as biomarkers.
Conclusion
In our study, three novel blood-based HCC-specific diagnostic biomarkers for human hepatocellular carcinoma were identified. These findings may contribute to the non-invasive detection of early HCC patients.
Introduction
According to global cancer statistics in 2018, hepatocellular carcinoma (HCC) ranks fourth in global cancer mortality (the top three are lung cancer, colorectal cancer and gastric cancer), accounting for 8.2% of all cancer deaths [Citation1]. HCC most commonly occurs with chronic alcohol abuse, nonalcoholic fatty liver disease or hepatitis C virus (HCV) [Citation2,Citation3]. If there is no special treatment, the average survival time of patients with early liver cancer and advanced liver cancer is 6–9 months and 1–2 months, respectively and more than 60% of the patients are diagnosed with advanced liver cancer after metastasis, resulting in overall 5-year survival rate <16% [Citation4–6]. On the contrary, patients with early-stage liver cancer have a relatively good prognosis, with a 5-year survival rate >70%. Therefore, early detection of HCC has a significant impact on clinical outcomes [Citation7].
The most reliable way to diagnose liver cancer is a liver biopsy, but it is an invasive procedure with potential complications. The combination of the most commonly used serum alpha-fetoprotein (AFP) levels combined with diagnostic imaging techniques including computed tomography (CT) and magnetic resonance imaging (MRI) can achieve no pathological diagnosis, but all have sensitivity problems [Citation8]. MRI spatial resolution is not high, CT is not easy to find early tumor micro-cancer, PET-CT radiation is large and expensive, and few HCC biomarkers prove early in clinical practice HCC has sufficient diagnostic performance [Citation9]. The ideal HCC biomarker should be able to diagnose asymptomatic patients and can be widely used for screening, with relatively high sensitivity and specificity and is non-invasive, low cost and allows for widespread use. Therefore, the most desirable biomarker is HCC specific and easy to detect in body fluids.
Weighted gene co-expression network analysis (WGCNA) has been most widely used in high-dimensional data sets, especially for constructing biological networks based on the likelihood of expression profile between genes. The genes that share a similar expression will be grouped into a module and the module could be associated with different traits. Hub genes could be identified based on the correlation between the gene and the module eigengenes.
As an important tissue fluid in the body, changes in the tissue composition of plasma could reflect the health of the body in the early stage of the disease and it is convenient to collect, without pain and trauma [Citation10]. In this study, the purified mRNA in peripheral blood mononuclear cells (PBMC) of three kinds of cancers including HCC, pancreatic cancer (PAN) and carcinoma of the stomach (GAS) used to screen specific peripheral blood tumor biomarkers for HCC using bioinformatics methods.
Results
Data processing for WGCNA
A total of 26 blood samples raw file were downloaded from the Gene Expression Omnibus (GEO) [Citation11]. The raw data were converted to expression data using an R-based RMA algorithm including background correction, normalization and summarization. The data processed by the nsfilter algorithm were used for WGCNA analysis.
Construction of weighted co-expression network and identification of modules associated with HCC
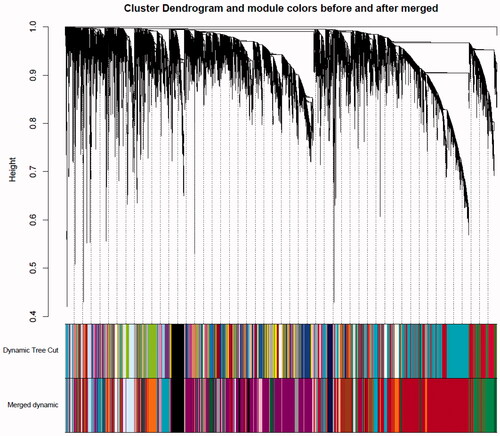
The co-expression network was constructed from the filtered probes and a total of 29 modules were identified. The adjacency matrix is defined based on the criterion of approximate scale-free topology (as shown in ). The soft threshold power is set to 10, the minimum module size is 30, the module detection sensitivity deepSplit 2, and the module’s combined cut height is 0.2 which means that the modules whose eigengenes correlation coefficient is above 0.8 will be merged (as shown in ).
Figure 1. Network topology for different soft-thresholding powers. Numbers in the plots indicate the corresponding soft thresholding powers. The approximate scale-free topology can be attained at the soft-thresholding power of 10.
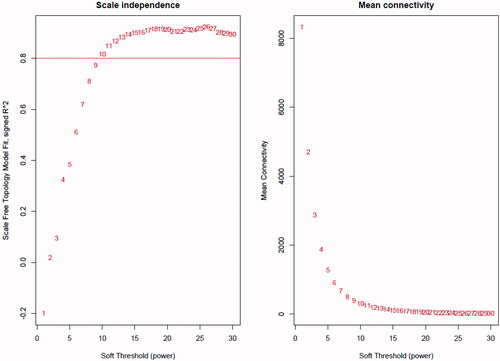
Figure 2. Gene modules identified by WGCNA. Gene dendrogram was obtained by clustering the dissimilarity with the colors of the corresponding modules represented by the color lines based on consensus topological overlap. Each colored line represents a color-coded module containing a set of highly connected genes. Twenty-two modules were identified.
Correlation between modules and different cancer types
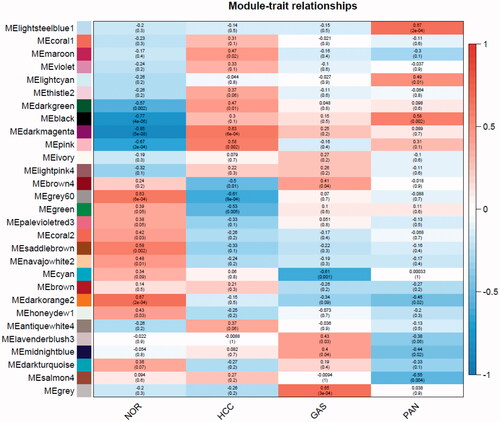
The relationship between modules and traits is shown in . Several modules were associated with one or three kinds of tumors. For example, the black and dark magenta module was positively associated with three tumors. Saddle brown, darkorange2 and navajowhite2 module was negatively correlated with three kinds of tumors. The lightsteelblue1 module is only positively associated with pancreatic cancer. The cyan module is negatively associated with gastric cancer. Modules which were highly relevant to HCC were highlighted, including dark magenta, pink, and grey60, of which the first two modules were positively associated with HCC, and grey60 is negatively associated with it.
Figure 3. Relationships of consensus module Eigen genes and different cancer types. Each row in the heat map corresponds to a consistency module and each column to a type of cancer. The module name is displayed to the left of each cell. The numbers in the cell showed the correlation between the corresponding module's eigengenes and the type of cancer, and the p-values are shown in parentheses below the correlation. Intensity and direction of correlations are indicated on the right side of the heatmap.
Integration analysis of DEGs and WGCNA
According to the screening criteria of the DEGs, we set in the “Materials and Methods” section (adjust-p value .001, p value .05, FC2), a total of 1063 genes met the requirements. The three modules of dark magenta, pink and grey60, which are closely related to liver cancer, were selected and intersected with the above 1063 DEGs. A total of 409 genes were obtained. Hub genes in the above three modules were selected according to what described in the material and methods section.
Enrichment analysis
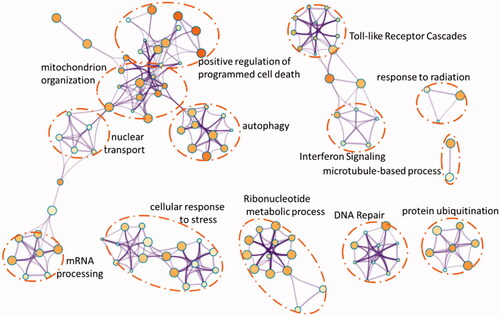
The above 409 DEGs belonging to the three modules which closely related to HCC were selected to do enrichment analysis using an online tool (http://metascape.org) which applies the standard accumulative hypergeometric statistical test identify ontology terms. In our study, the GO biological process, KEGG pathway and Reactome gene sets were selected. As shown in , the enriched GO terms include regulation of cell death, cellular catabolic process, cellular response to stress and mitochondrion organization. The enriched Reactome terms include cytokine signaling in the immune system and interferon signaling and the enriched KEGG pathway was RNA transport. From the network plot of the enriched items (), it can be seen that several clusters were grouped, including cell death and mitochondrial organization, cell response to stress, DNA repair, protein ubiquitination and the Toll-like receptor cascades.
Figure 4. Heatmap of enriched terms across input gene lists, colored by p values.
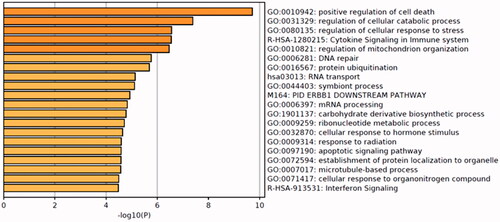
Figure 5. Network of enriched terms: colored by p values, where terms containing more genes tend to have a more significant p values.
Protein-protein interaction network and MCODE analysis
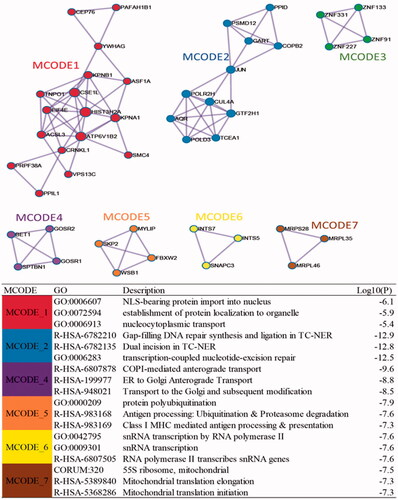
The protein-protein interaction network of 409 DEGs from STRING visualized by Cytoscape was as shown in . The hub genes calculated using the Cytohubba plugin were shown in yellow as shown in . These hub genes included GART, UMPS, DICER1, SMARCA4, SATA3 and POLR2H, etc. Among these genes, three genes including UMPS, DICER1, NCOR1 belonged to the hub genes of the three modules related to HCC. The densely connected network components identified for DEGs using MCODE were shown in . The top three pathway and process enrichment results for each module sorted by p values were shown in table underneath . Functional annotation for MCODE1 which contain the most genes mainly related to nuclear localization signal (NLS)-bearing protein import into nucleus biological process.
Figure 6. Protein-protein interction network for DEGs and the distribution of hub genes from Cytohubba.
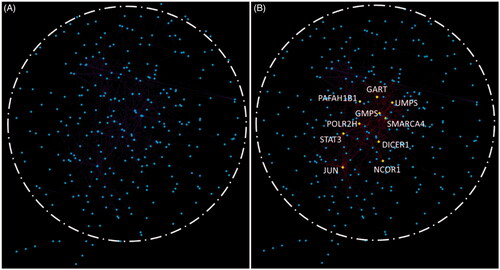
Figure 7. Protein-protein interaction network and MCODE components identified.
Oncomine database analysis and Kaplan–Meier survival analysis
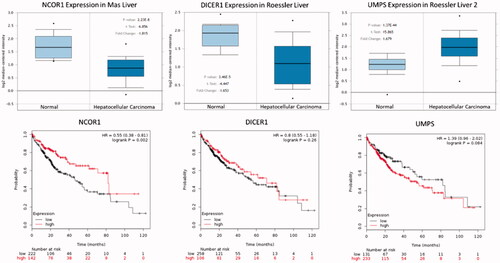
The mRNA expression of three hub genes in HCC tissue sample was explored using Oncomine analysis. It was found that UMPS over-expressed, NCOR1 and DICER1 down-regulated in HCC as shown in . The relationship between the expression of three hub genes and overall survival time, the Kaplan–Meir plotter was used to perform the survival analysis. It was found the elevated UMPS, decreased DICER1 and NCOR1 expression was correlated with low overall survival time ().
Figure 8. The box plot of expression value of NCOR1, DICER1 and UMPS in hepatocellular carcinoma. X-axis represents normal (left) and cancer group (right), Y-axis represents mRNA expression in log2 median/mean centered intensity. The figures below show the relationship between gene expression and survival time of patients.
Materials and methods
Data processing for WGCNA
The raw microarray data for PBMC samples with primary HCC, gastric carcinoma and pancreatic carcinoma, and normal health individuals were downloaded from the Gene Expression Omnibus (GEO) database with the Accession No.GSE49515 [Citation11,Citation12]. All RNA obtained from above samples was hybridized to the Human Genome U133 Plus 2.0 Array. The raw data in .CEL format was processed using Robust Multi-array Average (RMA) algorithm. In order to get the data for WGCNA analysis, the expression profiles for all probes was filtered using nsFilter package.
Construction of weighted co-expression network and identification of modules associated with HCC
The above-filtered data were used to construct the weighted co-expression network in order to find the target modules related to HCC using WGCNA R package [Citation10,Citation13]. The eigengenes adjacency was used to compute the co-expression similarity of all modules which could reveal their similarity. The correlations of each module were visualized by heatmap.
Screening of differentially expressed genes (DEGs)
Raw data were converted to expression profile data using R. If one gene corresponds to multiple probes, the probe with the smallest p values was reserved. The limma package was used to screen the differentially expressed genes (DEGs) between HCC and normal data [Citation14]. The parameter settings for differential gene screening are as follows: False discovery rate <0.001; p values <.05; fold change (FC) 2.
Enrichment analysis
The DEGs belonging to the modules which closely related to HCC were selected to do enrichment analysis using an online tool Metascape (http://metascape.org) which applies the standard accumulative hypergeometric statistical test identify ontology terms [Citation15]. In our study, the GO biological process, KEGG pathway and Reactome gene sets were selected [Citation16–18]. The p values were calculated for each term with the statistically significant ones are retained. In our study, the p values were set to .01.
Clustering enriched terms and visualization
The resultant GO terms will be redundant due to the overlapping nature of GO terms. In this study, the online tool Metascape was used to automatically cluster all the resultant go terms into groups according to the similarities between them. Several related terms were clustered into one group, and the most enriched go term was chosen as the representative term of the group. In order to understand the relationship among enriched terms, a subset of enriched terms were visualization as a network, where terms with a similarity > 0.3 are connected by edges. The network was visualized using Cytoscape where each node represents one enriched term [Citation19,Citation20]. In our study, the nodes were colored by their p values, where terms containing more genes tend to have more significant p values. The stronger the similarity among terms, the thicker the edges between them.
Protein-protein interaction network and MCODE analysis
The protein-protein interactions (PPI) between the above DEGs were extracted from STRING (https://string-db.org) and visualized using Cytoscape [Citation21,Citation22]. Proteins in a network were prone to form molecular complex or s biological process. In order to identify the functional units in the PPI network which means such a neighborhood component is more likely interaction as a function unit than the rest of the network. The above-described enrichment analysis is performed to explore the function of each MCODE components [Citation23].
Screening of hub genes
In WGCNA, intramodular connectivity (kIM) measures the correlation between a given gene and a particular module. In our study, from the modules closely related to HCC, the genes whose KIM values ranked in the top 5% were defined as hub genes. To identify the genes which may play key roles in PPI networks, Cytoscape-based Cytohubba plug-in was used for network analysis and identification of the genes with a high degree [Citation24].
Oncomine database analysis and Kaplan-Meier survival analysis
The mRNA expression of three hub genes was explored in liver cancer using Oncomine platform (https://www.oncomine.org) [Citation25,Citation26]. The p values were calculated using Students’ t-test between cancer tissue and control ones. The parameters were set as follows: p values < 1E-4, fold change (FC)>2. Kaplan–Meier survival analysis (www.kmplot.com) was performed to find the relationship between the expression of high degree hub genes and the survival days of HCC patients [Citation27]. The log rank p values and the hazard ratio were calculated.
Discussion
In addition to early surgical resection, there is currently no effective and reliable screening method for early liver cancer patients. The diagnosis of the early stages of malignant tumors will greatly improve the clinical outcome of patients. Previously, we conducted time series data analysis of the formation process of liver cancer caused by hepatitis B virus and selected a series of meaningful tumor tissue biomarkers. Cancer-specific blood-derived biomarkers are usually derived from tumors or responses to circulating tumor washes. If new biomarkers can be isolated from the blood of early liver cancer patients or high-risk populations, it will be of great value.
In this study, 406 DEGs were screened in HCC compared with normal blood sample which associated with cell death, cellular response to stress, mitochondrion organization mainly. MCODE was used to identify the functional unit. Functional annotation for the genes in MCODE1 reveals that they mainly related to nuclear localization signal (NLS)-bearing protein import into nucleus biological process [Citation28]. NLS of the SV40 was the first nuclear localization signal identified at the molecular level which was necessary and sufficient to promote the nuclear import of pyruvate kinase and β-galactosidase [Citation29]. Previous studies have found that hepatitis B virus (HBV) core antigen has two NLS in the arginine-rich carboxyl terminus [Citation30]. The exposure mechanism of the core protein (CP) of HBV is currently unclear yet.
Some hub genes, including GART, GMPS, UMPS, POLR2H and JUN, etc. were identified based on their degree in PPI network. According to our previous study, GART was identified as a hub gene [Citation31] in HCC formation and liver regeneration. In the study of prostate cancer, the expression of POLR2H up-regulated significantly and may serve as a biomarker for prognosis [Citation32]. WGCNA package was used to identify the modules which closely related to HCC and the genes with high kIM in each module were selected. As a result, three DEGs belonging to hub genes were identified, including UMPS, NCOR1 and DICER1.
Uridine monophosphate synthetase (UMPS) is involved in pyrimidine metabolism. It was reported that a 15-gene signature could serve as an independent prognostic biomarker in early stage, completely resected non-small-cell lung cancer (NSCLC) [Citation33]. In the study of head and neck cancer, UMPS may be a predictive marker [Citation34]. Currently, there is no report on the relationship between UMPS and HCC. We found that UMPS is highly expressed in liver cancer tissue samples and is associated with poor prognosis of HCC patients.
Nuclear Receptor Corepressor 1(NCOR1) protein was detected in the cytoplasm and nucleus of secretory epithelial cells in the normal prostate and prostate cancer metastasis showed an obvious decline in NCOR1 transcriptional output [Citation35,Citation36]. Recent evidence showed that NCOR1 is an essential metabolic switch which acts on oxidative metabolism signaling and may play a distinct role in liver regeneration and hepatocarcinogenesis in mice [Citation37,Citation38]. As one of the hub genes, the mRNA expression of NCOR1 in HCC tissue sample was explored and decreased expression of it is associated with short survival time.
Endoribonuclease Dicer (DICER1) is responsible for the formation of small interfering RNA and microRNA. In a study of ovarian cancer, decreased Dicer expression was significantly associated with poor prognosis, advanced tumor stage and decreased patient survival times [Citation39,Citation40]. It has also been reported that DICER1 is highly expressed in prostate cancer and is associated with poor prognosis of patients [Citation41]. In our study, the expression of DICER1 decreased in HCC tissue sample and is correlated with poor prognosis of patients.
In summary, we have identified 3 blood-based biomarkers with screening potential to discriminate between HCC cases and controls using multiple cohorts profile datasets and integrated bioinformatical analysis.
Authors' contributions
Qianfeng Xia and Li Yin conceived and designed the study; Na He and Nan Zhang performed the data analysis; Li Yin and Chuizhe Chen wrote the manuscript, Yingzi Lin obtained the funding.
Disclosure statement
The authors have declared that no competing interest exists.
Additional information
Funding
Related Research Data
References
- Bray F, Ferlay J, Soerjomataram I, et al. Global cancer statistics 2018: Globocan estimates of incidence and mortality worldwide for 36 cancers in 185 countries. CA Cancer J Clin. 2018;68:394–424.
- Jeong SW, Jang JY, Chung RT. Hepatitis C virus and hepatocarcinogenesis. Clin Mol Hepatol. 2012;18:347–356.
- Lin MV, King LY, Chung RT. Hepatitis C virus-associated cancer. Annu Rev Pathol. 2015;10:345–370.
- Dutkowski P, Linecker M, DeOliveira ML, et al. Challenges to liver transplantation and strategies to improve outcomes. Gastroenterology. 2015;148:307–323.
- Intaraprasong P, Siramolpiwat S, Vilaichone RK. Advances in management of hepatocellular carcinoma. Asian Pac J Cancer Prev. 2016;17:3697–3703.
- Takeda H, Takai A, Inuzuka T, et al. Genetic basis of hepatitis virus-associated hepatocellular carcinoma: linkage between infection, inflammation, and tumorigenesis. J Gastroenterol. 2017;52:26–38.
- Bruix J, Llovet JM. Prognostic prediction and treatment strategy in hepatocellular carcinoma. Hepatology. 2002;35:519–524.
- Gan W, Huang JL, Zhang MX, et al. New nomogram predicts the recurrence of hepatocellular carcinoma in patients with negative preoperative serum Afp subjected to curative resection. J Surg Oncol. 2018;117:1540–1547.
- Mehta AS, Lau DT, Wang M, et al. Application of the Doylestown algorithm for the early detection of hepatocellular carcinoma. PLoS One. 2018;13:e0203149.
- Langfelder P, Horvath S. WGCNA: an R package for weighted correlation network analysis. BMC Bioinformatics. 2008;9:559.
- Shi M, Chen MS, Sekar K, et al. A blood-based three-gene signature for the non-invasive detection of early human hepatocellular carcinoma. Eur J Cancer. 2014;50:928–936.
- Barrett T, Wilhite SE, Ledoux P, et al. NCBI Geo: archive for functional genomics data sets–update. Nucleic Acids Res. 2012;41:D991–5.
- Giulietti M, Occhipinti G, Principato G, et al. Weighted gene co-expression network analysis reveals key genes involved in pancreatic ductal adenocarcinoma development. Cell Oncol. 2016;39:379–388.
- Langfelder P, Horvath S. Fast R functions for robust correlations and hierarchical clustering. J Stat Softw. 2012;46:1–17.
- Tripathi S, Pohl MO, Zhou Y, et al. Meta- and orthogonal integration of influenza "Omics" data defines a role for Ubr4 in virus budding. Cell Host Microbe. 2015;18:723–735.
- Kanehisa M, Goto S. Kegg: Kyoto encyclopedia of genes and genomes. Nucleic Acids Res. 2000;28:27–30.
- Fabregat A, Jupe S, Matthews L, et al. The reactome pathway knowledgebase. Nucleic Acids Res. 2018;46:D649–D55.
- Gene ontology consortium: going forward. Nucleic Acids Res. 2015;43:D1049–D1056.
- Killcoyne S, Carter GW, Smith J, Boyle J, et al. Cytoscape: a community-based framework for network modeling. Methods Mol Biol. 2009;563:219–239.
- Shannon P, Markiel A, Ozier O. Cytoscape: a software environment for integrated models of biomolecular interaction networks. Genome Res. 2003;13:2498–2504.
- Han JD, Bertin N, Hao T, et al. Evidence for dynamically organized modularity in the yeast protein-protein interaction network. Nature. 2004;430:88–93.
- Szklarczyk D, Franceschini A, Wyder S, et al. V10: protein-protein interaction networks, integrated over the tree of life. Nucleic Acids Res. 2015;43:D447–52.
- Bader GD, Hogue CW. An automated method for finding molecular complexes in large protein interaction networks. BMC Bioinformatics. 2003;4:2.
- Chin CH, Chen SH, Wu HH, et al. Cytohubba: identifying hub objects and sub-networks from complex interactome. BMC Syst Biol. 2014;8( Suppl 4):S11.
- Rhodes DR, Kalyana-Sundaram S, Mahavisno V, et al. Oncomine 3.0: genes, pathways, and networks in a collection of 18,000 cancer gene expression profiles. Neoplasia. 2007;9:166–180.
- Rhodes DR, Yu J, Shanker K, et al. Oncomine: a cancer microarray database and integrated data-mining platform. Neoplasia. 2004;6:1–6.
- Lánczky A, Nagy Á, Bottai G, et al. Mirpower: a web-tool to validate survival-associated Mirnas utilizing expression data from 2178 breast cancer patients. Breast Cancer Res Treat. 2016;160:439–446.
- Freitas N, Cunha C. Mechanisms and signals for the nuclear import of proteins. Curr Genomics. 2009;10:550–557.
- Kalderon D, Roberts BL, Richardson WD, et al. A short amino acid sequence able to specify nuclear location. Cell. 1984;39:499–509.
- Eckhardt SG, Milich DR, McLachlan A. Hepatitis B virus core antigen has two nuclear localization sequences in the arginine-rich carboxyl terminus. J Virol. 1991;65:575–582.
- Yin L, Wang Y, Guo X, et al. Comparison of gene expression in liver regeneration and hepatocellular carcinoma formation. CMAR. 2018;10:5691–5708.
- Fan S, Liang Z, Gao Z, et al. Identification of the key genes and pathways in prostate cancer. Oncol Lett. 2018;16:6663–6669.
- Zhu CQ, Ding K, Strumpf D, et al. Prognostic and predictive gene signature for adjuvant chemotherapy in resected non-small-cell lung cancer. J Clin Oncol. 2010;28:4417–4424.
- Carles J, Monzo M, Artells R, et al. Xpc, Xpd/Ercc2, Umps, Cyp1b1 and Xrcc5, single nucleotide polymorphisms (Snps) in head and neck cancer. JCO. 2004;22:5588–5588.
- Lopez SM, Agoulnik AI, Zhang M, et al. Nuclear receptor corepressor 1 expression and output declines with prostate cancer progression. Clin Cancer Res. 2016;22:3937–3949.
- Fozzatti L, Park JW, Zhao L, et al. Oncogenic actions of the nuclear receptor corepressor (Ncor1) in a mouse model of thyroid cancer. PLoS One. 2013;8:e67954.
- Lima TI, Valentim RR, Araujo HN, et al. Role of Ncor1 in mitochondrial function and energy metabolism. Cell Biol Int. 2018;42:734–741.
- Ou-Yang Q, Lin XM, Zhu YJ, et al. Distinct role of nuclear receptor corepressor 1 regulated de novo fatty acids synthesis in liver regeneration and hepatocarcinogenesis in mice. Hepatology. 2018;67:1071–1087.
- Chiosea S, Jelezcova E, Chandran U, et al. Overexpression of dicer in precursor lesions of lung adenocarcinoma. Cancer Res. 2007;67:2345–2350.
- Merritt WM, Lin YG, Han LY, et al. Dicer, Drosha, and outcomes in patients with ovarian cancer. N Engl J Med. 2008;359:2641–2650.
- Chiosea S, Jelezcova E, Chandran U, et al. Up-regulation of dicer, a component of the microrna machinery, in prostate adenocarcinoma. Am J Pathol. 2006;169:1812–1820.