
 ?Mathematical formulae have been encoded as MathML and are displayed in this HTML version using MathJax in order to improve their display. Uncheck the box to turn MathJax off. This feature requires Javascript. Click on a formula to zoom.
Abstract
Storage lesions in red blood cells (RBCs) hinder efficient circulation and tissue oxygenation. The absence of flow mechanics and gas exchange may contribute to this problem. To test if in vitro compensation of flow mechanics and gas exchange helps RBC recovery, three-dimensional polydimethylsiloxane (PDMS) porous structures were fabricated with a sugar mould, simulating lung alveoli. RBC suspensions were passed through the porous structure cyclically, simulating in vivo blood circulation. Acid-base indices, partial gas pressures, ions, glucose and RBC indices were analyzed. An atomic force microscope was used to investigate local mechanical properties of intact RBCs. RBCs suspensions that passed through the porous structures had a higher pH and oxygen partial pressure, and a lower potassium concentration and carbon dioxide partial pressure. Meantime they had better biochemical properties relative to static samples, namely, they exhibited a more homogenous distribution of Young’s Modulus. RBCs that passed through a PDMS porous structure were healthier than static ones, giving hints to prevent RBC storage lesions.
Introduction
Red blood cells (RBCs, or erythrocytes) deliver oxygen to and remove carbon dioxide from tissues for gas exchange in the lungs. RBC units are the most requested transfusion product, with nearly 85 million units used worldwide each year. RBC transfusion restores tissue oxygen delivery and improves clinical outcomes in symptomatic anaemia or for acute loss of more than 30% of blood volume [Citation1–3].
To meet the clinical needs for RBC transfusion and avoid wastage, units are stored after removal of plasma and leucocytes. With the additive solutions, the preservation of RBCs is up to 42 days at 1–6 °C [Citation4,Citation5]. This storage duration is based on (1) more than 75% of RBCs still in circulation 24 h after transfusion; and (2) a hemolysis rate less than 1% at the end of storage [Citation6]. However, “storage lesions” can occur, which hinder efficient RBC circulation and tissue oxygenation [Citation7]. Although the detrimental effects of “old” vs “young” RBCs transfusion units are still a matter of debate, studies have demonstrated that storage impacts their functionality and integrity, which directly affects their oxygen delivery capacity and clearance. This results in toxicity caused by hemolysis and free-iron. Furthermore, storage lesions have been associated with an increased risk of mortality [Citation8–10]. The identification of key factors that cause RBCs changes during storage is needed for developing techniques to prevent lesions.
Relative to the in vivo environment, static, airtight in vitro RBCs conservation lacks active blood flow mechanics and cyclical gas exchange. The complex mechanics of hemodynamic forces in in vivo RBC blood flow include steady laminar, pulsatile, and oscillatory shear stresses [Citation11]. In blood flow, RBCs move in tumbling and tank-treading modes at low and high shear rates, respectively [Citation12,Citation13]. In the respiratory cycle, the stages of gas transport include ventilation, medium/blood diffusion, perfusion (circulation), blood/tissue diffusion, and oxidative tissue metabolism. Haemoglobin in RBCs is an integral component of gas exchanger [Citation14,Citation15]. Because active blood flow mechanics and cyclical gas exchange play pivotal roles in circulating RBCs, their absence in RBCs storage may contribute to RBCs storage lesions. To test this hypothesis, flow mechanics and gas exchange were compensated in the in vitro RBCs storage. Biochemical and mechanical properties of RBCs were detected.
Here, three-dimensional (3D) polydimethylsiloxane (PDMS) porous structures were fabricated using sugar as a mould. The structures were non-toxic, hydrophobic, and facilitated gas exchange in RBCs that passed through. They essentially simulated alveoli function in lungs. Furthermore, a cyclic rotating device was used to drive the RBC suspension back and forth through the porous structures, simulating in vivo blood circulation. Acid-base indices, oxygen and carbon dioxide partial pressures, ion concentrations, glucose and RBC indices were measured for the RBC suspensions. In addition, an atomic force microscope (AFM) was used to investigate local mechanical properties of intact RBCs.
Materials and methods
Preparation of 3D PDMS hydrophobic porous structure
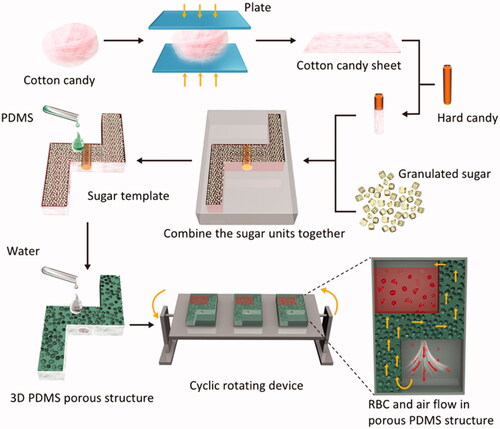
The fabrication of the PDMS structures [Citation16] is depicted in . The granulated sugar was placed in a preheated cotton candy maker, where a glass rod was uniformly rotated to make a block of fluffy cotton candy. The block was cut from the centre with scissors and pressed with a plate to slice it into the required shape.
Figure 1. Preparation of 3 D PDMS porous structure. The sugar templates were made of three sugar materials: cotton candy sheet, hard candy and granulated sugar. The sugar units were assembled into required mould and pressed. Add PDMS to the sugar template and evacuated for 40 min allowing the sugar fulfilled with PDMS. The PDMS bricks with sugar was cured, then put them into an ultrasonic cleaner to remove sugar with water. Cover the 3 D PDMS porous structure with PDMS sheets to create two chambers connected by a central channel. Put the PDMS porous structure with chambers on a cyclic rotating device. By means of gravity, red blood cells flow into the lower chamber via the central channel. The gas is pressed and going to upper chamber. Red arrows show the flow direction of RBCs and yellow arrows of the air.
Into a container were placed 400 g sucrose, 125 g glucose, 100 ml corn syrup, 200 ml water, and 0.5 g potassium hydrogen tartrate. After continuous mixing and heating at 150 °C, the molten sugar was poured into a mould, and gently shaken to remove bubbles. The sugar was allowed to set in the mould for 2 h at 25 °C, after which it was cooled and removed from the mould.
A mixture of 100 g of coarse granulated sugar and 100 g of fine granulated sugar was moistened with 2 ml water. It was then poured into the mould and gently pressed. The mould was placed in an 80 °C oven for 1 h. After drying and cooling, the granulated sugar was taken out of the mould.
The above sugar materials were assembled into the required template and pressed. The sugar mould was placed in large culture dishes.
The PDMS was prepared with a crosslinking ratio of 10:1 and evacuated for 30 min to remove bubbles. It was then slowly added to the mould and evacuated for 40 min. This was repeated twice until the PDMS reached the top of the sugar mould. It was then evacuated for 1 h. The culture dishes were removed and allowed to set for 12 h at 25 °C. They were then placed into the oven and heated for 3 h at 40 °C.
The sugar was removed by adding deionized water and ultrasonication at 40 °C. The water was exchanged once an hour. The PDMS was then fully dried in an 80 °C oven. It was cut into 2-mm slices to make a sealed container, with a 3 D PDMS porous structure dividing the container into upper and lower chambers.
To analyse the porous PDMS, it was cut into small pieces with a scalpel. Samples were then subjected to critical point drying and then adhered to an aluminium substrate with conductive paste for imaging with an environmental scanning electron microscope (SEM, [Quanta 200 FEG, FEI]) in Low-Vacuum mode. The porosity is calculated as described previously [Citation17].
Design and manufacturing of cyclic rotating device
The cyclic rotating device is shown in . The rotating shaft was connected to a servo motor, controlled by Arduino IDE software. The PDMS 3 D porous-structured RBC flow device was fixed on a rotating table, which rotated forward and backward over 120 degrees in a 7.2-s cycle. The rotating interval was 2 min.
Animals
All experiments were performed with permission from the Laboratory Animal Centre of the Academy of Military Medical Sciences. Male Wistar rats (250–350 g) were purchased from Vital River Laboratories (Beijing, China). They were anaesthetized via intraperitoneal injection of sodium pentobarbital (Peking Chemical Agent Co., Beijing, China) (50 mg/kg) and then placed on a heating pad (TMS-202, Softron, Beijing, China) in a supine position to keep their temperatures at 37 °C.
Samples and tests
A polyethylene catheter was inserted into the right carotid artery to withdraw blood that was then mixed with CPDA-1 (Sigma-Aldrich, St Louis, MO). The final CPDA-1 concentration was maintained at 14%. The blood was passed through a leukoreduction filter (BengBu Medical College, China) and centrifuged for 15 min at 400 g to remove the supernatant.
The leukoreduced blood was placed in the PDMS bags and divided into static and flow groups. The static group was kept motionless. The flow group was placed on the cyclic rotating device for end-over-end motion to ensure sample flow through the central channel in the PDMS bags. As shown in , the 3D PDMS porous structure divides the red cells storage device into two chambers. Red cells flow from the upper chamber into the lower chamber through the central channel generated by gravity. Two minutes after all the red cells enters the lower chamber, the device is rotated by a rotator to make the RBCs containing chamber rise up. Then red cells begin another flow cycle.
Both groups were stored at 4 °C for 48 h. Samples were tested with blood gas analyzers (Radiometer ABL90COOX, Copenhagen, Denmark) and Multispecies Haematology Systems (HEMAVET 950, Drew Scientific Ltd., Cumbria, UK) at 0 h, 12 h, 24 h and 48 h.
AFM measurements and analysis
Intact RBCs having negative charges were attached to a positively charged poly-l-lysine (PLL)-coated glass surface [Citation18]. A Bio-AFM system that combined an inverted microscope (Nikon, TE2000U) with a MAC-mode AFM (Agilent, 5500) was used to examine the mechanical properties of the RBCs [Citation19]. The AFM cantilever, with a typical spring constant k = 0.16 N m−1 was attached to a 1.857-μm diameter silica sphere.
Young’s moduli were calculated by a home-made script in MATLAB 2012a. Voltage-displacement curves acquired with the AFM were converted to force-indention curves with the known k and sensitivity of the AFM probes. Those curves were then fitted with the spherical Hertz model given by:
where F was the force, R was the radius of the sphere on the probe tip, δ was the indentation and ν was the Poisson ratio of the cells, which for soft materials is 0.5 [Citation20–22]. Because the RBCs were thinner than spherical cells, δ = 30 nm was used for calculating Young’s moduli to better measure the weakened intrinsic elasticity.
Statistical analysis
Data for the blood gas, biochemistry and RBC indexes were analyzed with T-test from SPSS Statistics 23 (IBM, USA). The results were expressed in terms of the mean ± standard deviation (SD). Values with p < .05 were considered statistically significant. Differences were considered strongly significant with p < .01.
Results
Three-dimensional polydimethylsiloxane (PDMS) porous structures
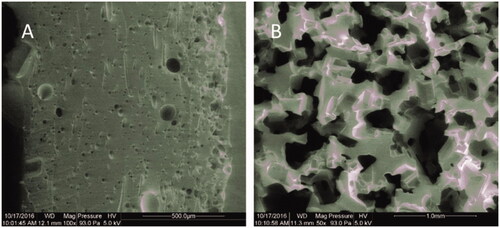
Highly porous PDMS structure was fabricated by using sugar template. As illustrated in , porous PDMS which made from cotton candy (A) and sugar cube templates (B) have different apertures. The porous PDMS made from cotton candy templates with small pores was the interface contact with RBCs and air. It prevents the RBCs from infiltrating into the porous PDMS structure. The porous PDMS made from granulated sugar templates with large pores has a better air permeability and also plays a role of upholder for the PDMS layer with small pores. Diameters of small pores are about 5–10 µm and that of large pores are about 200–500 µm. The porosity for PDMS with large pores is 66.5%, and that for PDMS with small pores is 13.1%.
Figure 2. SEM image of porous PDMS made from cotton candy sheet (A) and granulated sugar (B).
Acid-base indices
As shown in , pH in the static decreased and was significantly lower in 48 h than that in baseline, 12 h and 24 h (p < .01) while pH was significantly higher in the flow samples than that in baseline (p < .01). At 24 h and 48 h, pH in the flow samples was significantly higher than that in the static samples (p < .01).
Figure 3. Acid-base indices pH (A), cBase (B) and HCO3− (C). aap < .01 versus baseline. bbp < .01 versus static 12 h. ccp < .01 versus static 24 h. ddp < .01 versus rotated 12 h. eep < .01 versus rotated 24 h. *p < .05 versus static at the same time. **p < .01 versus static at the same time.
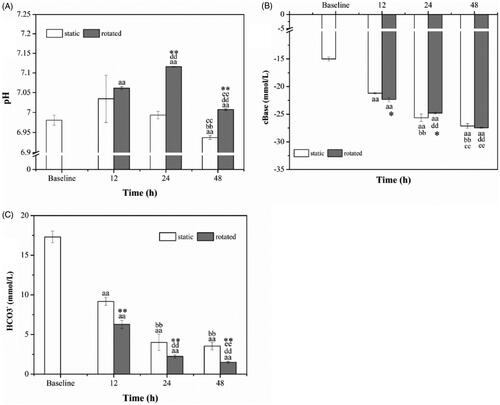
As demonstrated in , cBase in both static samples and rotated samples presented the decreasing tendency and were significantly lower than that in baseline (p < .01). The cBase levels in both static samples and rotated samples were significantly lower in 24 h, 48 h compared to that in 12 h (p < .01), and it was lower in 48 h compared to that in 24 h (p < .01). At 12 h, cBase in rotated samples was lower than in static samples (p < .05). At 24 h, cBase in rotated samples was higher than that in static samples (p < .05).
The levels of HCO3− presented a descending trend, as shown in , and were significantly lower than in baseline (p < .01). They were significantly lower at 24 h, 48 h than in 12 h (p < .01). At 48 h, HCO3− was significantly lower than 24 h in rotated samples (p < .01). Besides, HCO3− was significantly lower in the rotated samples than that in the static samples over the same time (p < .01).
Partial pressure of oxygen and carbon dioxide
The partial pressure of oxygen (PO2) and carbon dioxide (PCO2) are demonstrated in . In , PO2 presented an increasing trend which had strongly significant difference relative to the baseline (p < .01). At 24 h and 48 h, PO2 in static samples was significantly higher than that in 12 h (p < .01). The rotated samples showed higher PO2 relative to the static samples over the same time (p < .01).
Figure 4. Partial pressure of oxygen (A) and carbon dioxide (B). aap < .01 versus baseline. bbp < .01 versus static (12 h). ddp < .01 versus rotated (12 h). ep < .05 versus rotated (24 h). **p < .01 versus static at the same time.
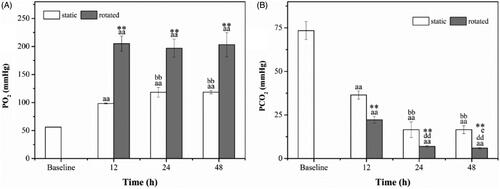
As shown in , PCO2 in 12 h, 24 h and 48 h decreased rapidly and were significantly lower than in baseline (p < .01). PCO2 in 24 h and 48 h was significantly lower than in 12 h in both static and rotated (p < .01), and it was lower when the samples were rotated in 48 h than in 24 h (p < .05). Moreover, it was significantly lower when the samples were rotated compared with the static samples (p < .01).
Ions and glucose
The concentrations of K+ were displayed in , and they were significantly higher in 12 h, 24 h and 48 h than in baseline (p < .01). The concentrations of K+ were significantly higher in 24 h and 48 h compared to that in 12 h (p < .01), and they were significantly higher in 48 h than in 24 h (p < .01). Besides, the concentrations of K+ in 12 h and 24 h were significantly lower when the samples were rotated than in static (p < .01).
Figure 5. Ions and Glucose. K+ (A), Na+ (B), Cl− (C) and Glucose (D). ap < .05 versus baseline. aap < .01 versus baseline. bp < .05 versus static (12 h). bbp < .01 versus static (12 h). ccp < .01 versus static (24 h). ddp < .01 versus rotated (12 h). eep < .01 versus rotated (24 h). *p < .05 versus static at the same time. **p < .01 versus static at the same time.
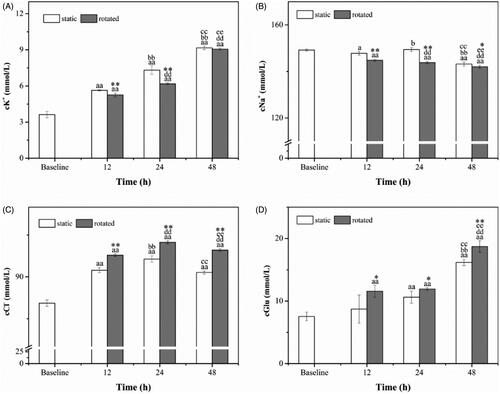
As shown in , the concentrations of Na+ were significantly lower in 48 h than in baseline (p < .01), and it became significantly lower when the samples were rotated (p < .01), and it was lower in 12 h than baseline when the samples was static (p < .05). At 24 h, the concentration of Na+ was higher than in 12 h when the samples were static (p < .05), and it was significantly lower than in 12 h when the samples were rotated (p < .01). The concentrations of Na+ in 48 h were significantly lower than that in 24 h (p < .01). In addition, concentrations of Na+ were significantly lower in the rotated samples at 12 h (p < .01), 24 h (p < .01), and 48 h (p < .05) compared with the static samples.
As shown in , the concentrations of Cl− presented an increasing tendency which was significantly higher than in baseline (p < .01). They were significantly higher in 24 h and 48 h when the samples were rotated than in 12 h (p < .01). The concentrations of Cl− in 48 h were lower than in 24 h (p < .01). Moreover, the concentrations of Cl− in rotated samples were significantly higher than in static samples (p < .01).
The different concentrations of Glucose presented an increasing trend, as shown in , and they were significantly higher in 24 h, 48 h as well as in 12 h when the samples were rotated than in baseline (p < .01). The concentrations of Glucose in 48 h were significantly higher than in 12 h and 24 h (p < .01). Besides, the concentrations of Glucose in rotated samples was significantly higher than that in static samples at 12 h (p < .05), 24 h (p < .05) and 48 h (p < .01).
Red blood cell indices
As shown in , at 24 h, RDW in rotated samples were significantly lower than in static samples (p < .01). MCV () in rotated samples were higher than in baseline (p < .05) and were significantly higher than in static samples (p < .01), at 12 h and 24 h.
Figure 6. Red blood cell indices. RDW (A), MCV (B), MCH (C) and MCHC (D). ap < .05 versus baseline. aap < .01 versus baseline. dp < .01 versus rotated (12 h). *p < .05 versus static at the same time. **p < .01 versus static at the same time.
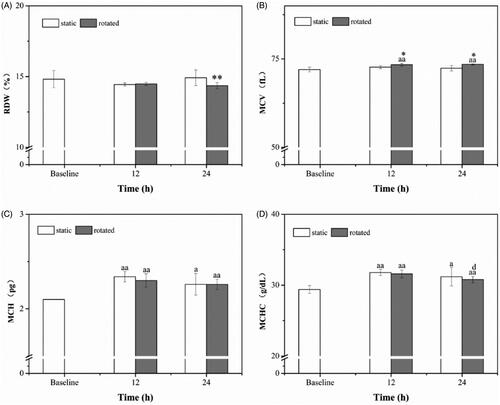
MCH, as it depicted in , was significantly higher in 12 h, as well as 24 h when the samples were rotated, than in baseline (p < .01); and it was higher in 24 h when the samples were static than in baseline (p < .05). MCHC () had a same tendency with MCH; moreover, in 24 h, it was lower than in 12 h when the samples were rotated (p < .05).
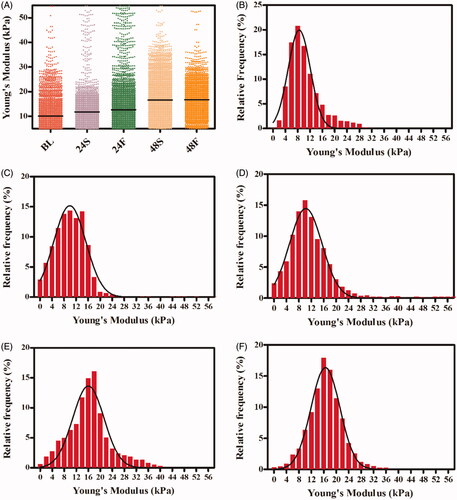
Young’s modulus
As shown in , 2000 measurements were conducted to evaluate the mechanical properties of RBCs samples in the PDMS storage device. The median values of Young’s Modulus in the BL, 24S, 24F, 48S and 48F groups were 9.12 kPa, 10.13 kPa, 10.67 kPa, 16.34 kPa and 16.62 kPa, respectively, which demonstrates the Young’s Modulus of RBCs tend to increase with storage time. In the rotated samples (), Young’s Modulus showed less heterogeneity than that in static samples ().
Figure 7. Young’s Modulus from RBCs. Comparison of Young's Modulus from RBCs with/without rotation at different time. Each point represents a Young's Modulus from RBCs (A). Histogram representations of relative frequency and their Gaussian distributions for Young's Modulus for samples of baseline (B). Histogram representations of relative frequency and their Gaussian distributions for Young's Modulus for 24 h in static (C) or in rotated (D). Histogram representations of relative frequency and their Gaussian distributions for Young's Modulus for 48 h in static (E) or in rotated (F).
Discussion
Studies have demonstrated that storage impairs functionality and integrity of RBCs. Many biochemical and rheological properties of RBCs change dramatically during storage, including pH, blood gas, potassium levels, deformability, etc. [Citation6, Citation23–26]. In this study, flow mechanics and gas exchange were compensated during RBCs storage; biochemical properties of RBCs were measured. In addition, local mechanical properties of intact RBCs, which to some extent are more sensitive to flow behaviour than rheological properties, were also investigated by AFM.
The pH decreased significantly in static samples that were stored in vitro, similar to previous reports of decreases within hours of storage [Citation23]. In the flow samples, the pH was significantly higher than those of the baseline and the static samples. Thus, samples passing through the PDMS porous structure had a higher buffering capacity.
In the static samples, the partial pressure of oxygen increased in a time-dependent manner over 12 h and 24 h and was constant between 24 h and 48 h. In contrast, the partial pressure of carbon dioxide decreased over 12 h and 24 h and was constant between 24 h and 48 h. These changes were similar to previous reports on stored RBC [Citation23]; however, the levels of the changes varied because different animal species and sample preparation protocols were used. In the flow samples, the oxygen partial pressure increased sharply over 12 h and was maintained at the high level until 48 h. It was significantly higher than that of the static group over the same time. The carbon dioxide partial pressure decreased in a similar way, but at a significantly lower level as that for the static group over the same time period. Higher oxygen and lower carbon dioxide partial pressures in the flow samples indicated better gas exchange via the PDMS porous structures.
In vitro storage renders the sodium-potassium pump inoperative in RBC membranes, inducing potassium ions to exit RBCs and sodium ions to enter [Citation23, Citation26]. Thus, potassium concentrations increased within a few hours of storage [Citation22], at an increment of 1mEq/L per day [Citation6]. If stored RBCs in large volume are transfused to neonates or infants, the high potassium concentrations may lead to arrhythmia [Citation25,Citation27]. Here, potassium concentrations exhibited time-dependent increases; however, the samples passing through the PDMS porous structure had lower potassium concentrations than those in the static group. Hence, the PDMS porous structure seemed to help maintain RBC membranes, although mechanisms need to be investigated.
The mechanical properties of RBCs (stiffness, rigidity, and elasticity) were closely related to deformability, which has significant effects on tissue oxygenation via microcirculation [Citation28]. AFM is able to probe local mechanical properties of living cells with high force sensitivity [Citation19]. From the AFM force-indentation measurements and analysis with the Hertz model, Young’s Modulus was calculated. They reflected the stiffness and elasticity [Citation19, Citation28–30], which for living [Citation29] cells range over 1–100 kPa [Citation31–36]. Larger values indicate an increase in RBC stiffness and a decrease in deformability [Citation37]. Young’s Modulus was higher in the centre of RBCs relative to the external edges [Citation38] while they were homogenous over the surface of swollen RBCs [Citation39].
Maciaszek et al. [Citation18] compared the micro-elasticity of RBCs in sickle cell disease with normal RBCs. Local elastic properties were measured in contact mode of AFM and were quantitatively determined from force-distance curves. Histograms of Young’s Modulus were fitted by Gaussian distributions, with values of 1.10 ± 0.40 kPa for normal and 3.95 ± 0.40 kPa for sickle cell trait RBCs. Sickle cell disease samples revealed a two-peak distribution of 1.0 ± 1.1 kPa and 3.0 ± 2.7 kPa, as well as even higher values (>7.0 kPa). Values obtained from oxygenated and deoxygenated samples were fitted with Gaussian distributions. An additional peak appeared around 15 kPa for oxygenated and 40 kPa for deoxygenated RBCs. It was apparent that healthy RBCs had a lower and more homogenous Young’s modulus than that of pathological RBCs. Meanwhile, oxygenation may change the Young’s Modulus in RBCs.
Here, the median values of Young’s Modulus in the BL, 24S, 24F, 48S and 48F groups were 9.12 kPa, 10.13 kPa, 10.67 kPa, 16.34 kPa and 16.62 kPa, respectively, indicating that it increased with storage time. These values were higher than those mentioned above [Citation40]. Previous studies have indicated that different RBC preparation protocols and measurement parameters may lead to inconsistent Young’s Modulus [Citation38–45]. A distribution of values was more effective than average values in distinguishing healthy from pathological RBCs [Citation28]. By fitting with Gaussian distributions, Young’s Modulus of flow RBCs exhibited less heterogeneity, relative to those of the static group over the same time. Thus, RBCs in the flow samples were healthier than those in the static group. Further research is needed.
Previously, it was shown that anaerobic storage of RBCs reduced storage lesions, including haemolysis, vesicle production, and phosphatidylserine exposure [Citation46]. This differs from the present results. Therefore, more relevant studies are needed to understand the effects of gas exchange on RBCs storage.
PDMS is widely used in biomedical field, especially in the organ-on-a-chip platform in recent years [Citation47–50]. PDMS devices can be produced in large scale [Citation51,Citation52]. To keep sterilization, the 3 D PDMS devices can be treated with UV radiation [Citation53,Citation54]. The process of building the 3 D PDMS structure requires about 16 h in the present study, including sugar template preparation (∼2 h), PDMS moulding (∼3 h), sugar template removing (∼10 h) and sterilization (∼1 h). Multiple PDMS structures can be prepared simultaneously. It is important to guarantee that PDMS infiltrate into the gap between the template sugar particles in the vacuum moulding procedure. In addition, the sugar template must be completely removed.
There is a limitation in the present study. More hemolysis was found in some rotating samples than that in static samples. That may be due to inappropriate flow rate, rotating frequency, surface properties of PDMS, and so on. In the future study, RBCs flowing style and gas exchange micro-structure must be improved.
In conclusion, three-dimensional PDMS porous structures for RBC gas exchange and flow mechanics were fabricated using sugar as a mould. RBC suspensions that passed through the structures had higher pH values and partial pressures of oxygen, and lower potassium concentrations and partial pressures of carbon dioxide. Overall, these results indicated better biochemical properties than those of the static samples. RBCs that passed through the porous structures also had a more homogenous distribution of Young’s Modulus relative to that for the static samples. Thus, the RBCs were healthier after passing through the porous structures. This may indicate a way to prevent RBC storage lesion. In our future study, RBC suspensions in rotating PDMS container will be directly compared with samples in traditional airtight storage bags.
Disclosure statement
No potential conflict of interest was reported by the authors.
References
- García-Roa M, Del CV-AM, Bobes AM, et al. Red blood cell storage time and transfusion: current practice, concerns and future perspectives. Blood Transfus. 2017;15:222–231
- Remy KE, Spinella PC. Red blood cell storage age – what we know from clinical trials. Exp Rev Hematol. 2016;9:1.
- Sharma S, Sharma P, Tyler LN. Transfusion of blood and blood products: indications and complications. Am Fam Physician. 2011;83:719–724.
- Cancelas JA, Dumont LJ, Maes LA, et al. Additive solution-7 reduces the red blood cell cold storage lesion. Transfusion. 2015;55:491–498.
- Hess JR, Rugg N, Knapp AD, et al. Successful storage of RBCs for 9 weeks in a new additive solution. Transfusion. 2000;40:1007–1011.
- Zimrin AB, Hess JR. Current issues relating to the transfusion of stored red blood cells. Vox Sang. 2009;96:93–103.
- D'Alessandro A, Kriebardis AG, Rinalducci S, et al. An update on red blood cell storage lesions, as gleaned through biochemistry and omics technologies. Transfusion. 2015;55:205–219.
- Brunskill SJ, Wilkinson KL, Doree C, et al. Transfusion of fresher versus older red blood cells for all conditions. Cochrane Database Syst Rev. 2015;5:CD010801.
- Hod EA, Godbey EA. The outsider adverse event in transfusion: inflammation. Presse Medicale. 2016;45:e325–e329.
- van de Watering L. Red cell storage and prognosis. Vox Sang. 2011;100:36–45.
- Lee J, Packard RR, Hsiai TK. Blood flow modulation of vascular dynamics. Curr Opin Lipidol. 2015;26:376–383.
- Abkarian M, Faivre M, Viallat A. Swinging of red blood cells under shear flow. Phys Rev Lett. 2007;98:188302.
- Fischer TM. Tank-tread frequency of the red cell membrane: dependence on the viscosity of the suspending medium. Biophys J. 2007;93:2553–2561.
- Piiper J. Respiratory gas exchange at lungs, gills and tissues: mechanisms and adjustments. J Exp Biol. 1982;100:5–22.
- Hsia CCW, Hyde DM, Weibel ER. Lung structure and the intrinsic challenges of gas exchange. Compr Physiol. 2016;6:827–895.
- Choi SJ, Kwon TH, Im H, et al. A polydimethylsiloxane (PDMS) sponge for the selective absorption of oil from water. ACS Appl Mater Interfaces. 2011;3:4552.
- Nimmo JR. Porosity and pore size distribution. Encyclopedia of soils in the environment. London, Elsevier; 2004. P. 295–303.
- Maciaszek JL, Andemariam B, Lykotrafitis G. Microelasticity of red blood cells in sickle cell disease. J Strain Anal Eng Des. 2011;46:368–379.
- Geng L, Feng J, Sun Q, et al. Nanomechanical clues from morphologically normal cervical squamous cells could improve cervical cancer screening. Nanoscale. 2015;7:15589.
- Butt HJ, Cappella B, Kappl M. Force measurements with the atomic force microscope: Technique, interpretation and applications. Surface Science Reports. 2005;59:1–152.
- Iyer S, Gaikwad RM, Subba-Rao V, et al. Atomic force microscopy detects differences in the surface brush of normal and cancerous cells. Nat Nanotech. 2009;4:389.
- Radmacher M, Fritz M, Hansma PK. Imaging soft samples with the atomic force microscope: gelatin in water and propanol. Biophys J. 1995;69:264.
- D'Alessandro A, Liumbruno G, Grazzini G, et al. Red blood cell storage: the story so far. Blood Transfus. 2010;8:82–88.
- Lei C, Yu B, Shahid M, et al. Inhaled nitric oxide attenuates the adverse effects of transfusing stored syngeneic erythrocytes in mice with endothelial dysfunction after hemorrhagic shock. Anesthesiology. 2012;117:1190–1202.
- Lm VDW, Brand A. Effects of storage of red cells. Transfus Med Hemother. 2008;35:359.
- Adams F, Bellairs G, Bird AR, et al. Biochemical storage lesions occurring in nonirradiated and irradiated red blood cells: a brief review. Biomed Res Int. 2015;2015:968302.
- Parshuram CS, Joffe AR. Prospective study of potassium-associated acute transfusion events in pediatric intensive care. Pediatr Crit Care Med. 2003;4:65–68.
- Yeow N, Tabor RF, Garnier G. Atomic force microscopy: from red blood cells to immunohaematology. Adv Colloid Interface Sci. 2017;249:149–162.
- Sokolov I, Dokukin ME, Guz NV. Method for quantitative measurements of the elastic modulus of biological cells in AFM indentation experiments. Methods. 2013;60:202–213.
- Kuznetsova TG, Starodubtseva MN, Yegorenkov NI, et al. Atomic force microscopy probing of cell elasticity. Micron. 2007;38:824–833.
- Radmacher M, Fritz M, Kacher CM, et al. Measuring the viscoelastic properties of human platelets with the atomic force microscope. Biophys J. 1996;70:556–567.
- Cross SE, Jin YS, Rao J, et al. Nanomechanical analysis of cells from cancer patients. Nat Nanotech. 2007;2:780–783.
- Cai X, Xing X, Cai J, et al. Connection between biomechanics and cytoskeleton structure of lymphocyte and Jurkat cells: an AFM study. Micron. 2010;41:257.
- Domke J, Dannöhl S, Parak WJ, et al. Substrate dependent differences in morphology and elasticity of living osteoblasts investigated by atomic force microscopy. Colloids & Surfaces B Biointerfaces. 2000;19:367–379.
- Simon A, Cohen-Bouhacina T, Porté MC, et al. Characterization of dynamic cellular adhesion of osteoblasts using atomic force microscopy. Cytometry. 2003;54A:36–47.
- Takai E, Costa KD, Shaheen A, et al. Osteoblast elastic modulus measured by atomic force microscopy is substrate dependent. Ann Biomed Eng. 2005;33:963–971.
- Dulińska I, Targosz M, Strojny W, et al. Stiffness of normal and pathological erythrocytes studied by means of atomic force microscopy. J Biochem Biophys Methods. 2006;66:1–11.
- Ciasca G, Papi M, Di CS, et al. Mapping viscoelastic properties of healthy and pathological red blood cells at the nanoscale level. Nanoscale. 2015;7:17030.
- Girasole M, Dinarelli S, Boumis G. Structural, morphological and nanomechanical characterisation of intermediate states in the ageing of erythrocytes. J Mol Recognit. 2012;25:285–291.
- Bremmell KE, Evans A, Prestidge CA. Deformation and nano-rheology of red blood cells: an AFM investigation. Colloids Surf B Biointerfaces. 2006;50:43–48.
- Maciaszek JL, Lykotrafitis G. Sickle cell trait human erythrocytes are significantly stiffer than normal. J Biomech. 2011;44:657–661.
- Jin H, Xing X. Detection of erythrocytes influenced by aging and type 2 diabetes using atomic force microscope. Biochem Biophys Res Commun. 2010;391:1698–1702.
- Lekka M, Fornal M, Pyka-Fościak G, et al. Erythrocyte stiffness probed using atomic force microscope. Biorheology. 2005;42:307–317.
- Lamzin IM, Khayrullin RM. The quality assessment of stored red blood cells probed using atomic-force microscopy. Anat Res Int. 2014;2014:869683.
- Li M, Liu L, Xi N, et al. Atomic force microscopy imaging and mechanical properties measurement of red blood cells and aggressive cancer cells. Sci China Life Sci. 2012;55:968–973.
- Dumont LJ, D'Alessandro A, Szczepiorkowski ZM, et al. Yoshida, CO2-dependent metabolic modulation in red blood cells stored under anaerobic conditions. Transfusion. 2016;56:392–403.
- Skardal A, Murphy SV, Devarasetty M, et al. Multi-tissue interactions in an integrated three-tissue organ-on-a-chip platform. Sci Rep. 2017;8:1–16.
- An F, Qu Y, Liu X, et al. Organ-on-a-chip: new platform for biological analysis. Anal Chem Insights. 2015;10:ACI.S28905–ACI.S28907.
- Kitsara M, Kontziampasis D, Agbulut O, et al. Heart on a chip micro-nanofabrication and microfluidics steering the future of cardiac tissue engineering. Microelectron Eng. 2019;203–204:44–62.
- Bein A, Shin W, Jalili-Firoozinezhad S, et al. Microfluidic organ-on-a-chip models of human intestine. Cell Mol Gastroenterol Hepatol. 2018;5:659–668.
- Melin J, Quake SR. Microfluidic large-scale integration: the evolution of design rules for biological automation. Annu Rev Biophys Biomol Struct. 2007;36:213–231.
- Halldorsson S, Lucumi E, Gómez-Sjöberg R, et al. Advantages and challenges of microfluidic cell culture in polydimethylsiloxane devices. Biosens Bioelectron. 2015;63:218–231.
- Mata A, Fleischman AJ, Roy S. Characterization of polydimethylsiloxane (PDMS) properties for biomedical micro/nanosystems. Biomed Microdevices. 2005;7–4: 281–293.
- Brewer BM, Shi M, Edd JF, et al. A microfluidic cell co-culture platform with a liquid fluorocarbon separator. Biomed Microdevices. 2014;16:311–323.