
Abstract
Presently, there are no few anticancer drugs that have been used clinically due to their poor targeting ability, short half-life period, non-selective distributions, generation of vasculogenic mimicry (VM) channels, high metastasis, and high recurrence rate. This study aimed to explore the effects of R8 modified epirubicin–dihydroartemisinin liposomes that could target non-small-cell lung cancer (NSCLC) cells, destroy VM channels, inhibit tumor metastasis, and explain the possible underlying mechanism. In vitro assays indicated that R8 modified epirubicin–dihydroartemisinin liposomes with ideal physicochemical characteristics could exhibit not only powerful cytotoxicity on A549 cells, but also the effective suppression of VM channels and tumor metastasis. Mechanistic studies manifested that R8 modified epirubicin–dihydroartemisinin liposomes could down-regulate the levels of VE-Cad, TGF-β1, MMP-2, and HIF-1α. In vivo assays indicated that R8 modified epirubicin–dihydroartemisinin liposomes could both increase the selective accumulation of chemotherapeutic drugs at tumor sites and show a targeting conspicuous of antitumor efficacy. In conclusion, the R8 modified epirubicin–dihydroartemisinin liposomes prepared in this study provide a treatment strategy with high efficiency for NSCLC.
Introduction
Lung cancer is the leading cause of cancer mortality and morbidity and it is characterized by uncontrolled cell growth in the lung [Citation1]. This growth could spread beyond the lungs to nearby tissues or other parts of the body. Non-small cell lung cancer (NSCLC) is a common lung cancer, accounting for approximately 85% of all lung cancers and it represents the main subgroup of lung cancer with a high rate of recurrence and metastasis [Citation2]. Common treatment options for NSCLC include surgery, radiotherapy, chemotherapy, or combination therapy, and the treatment effect depends on the stage of cancer, the overall health of the individual, and the side effects of the treatment [Citation3]. Surgery is the most effective treatment for patients diagnosed with the early stages of NSCLC that did not spread to nearby lymph nodes [Citation4,Citation5]. Presently, gene therapy and immunotherapy have the potential to improve the outcome of NSCLC [Citation6]. However, due to the lack of clinically relevant techniques to assess the expression of target genes in patients, the cost of immunotherapy remains high compared to conventional cytotoxic therapies [Citation7]. Therefore, chemotherapy is still an important antitumor strategy for those with inoperable NSCLC [Citation8]. Unfortunately, the prognosis of patients who have received routine chemotherapy is usually unsatisfactory due to various events, including tumor metastasis, the formation of vasculogenic mimicry (VM) channels, the limited killing of tumor cells, and severe systemic toxicity [Citation9].
In cases of tumor metastasis, tumor cell adhesion decreases. When invasion and migration occurs, the formation of vasculogenic mimicry (VM) channels can change the expression of metastasis-related proteins [Citation10,Citation11]. VM channels are microvascular channels produced by invasive, metastatic, and hypoxic tumor cells in uveal melanoma, which was first discovered by Maniotis in 1999 [Citation12]. It has been reported that the poor prognosis of lung cancer patients was closely related to the formation of VM channels. The reason was that VM channels could accelerate the metastasis of the tumor and provide sufficient nutrition for the rapid growth of tumors [Citation13]. Metastasis is a major challenge in cancer therapy because the metastatic spread may occur via the blood or lymph, which was extremely common in the late stages of cancer [Citation14]. Metastasis is also a primary challenge in cancer therapy because it involves multiple signaling molecules from different signaling pathways [Citation15]. Nevertheless, inhibition of VM formation is a pivotal step in the elimination of tumor metastasis. An increasing number of studies have indicated that inhibition of cancer cell metastasis can remarkably enhance the therapeutic effects for NSCLC [Citation16].
Epirubicin is a common non-specific antitumor drug used for treating various types of cancers. It has been used in combination with other agents to treat NSCLC patients after surgery [Citation17]. Its mechanism of action involves intercalation between DNA nucleotide pairs, which interferes with the transcription process and prevents the formation of mRNA, thereby inhibiting the synthesis of DNA and RNA. Besides, it also triggers DNA cleavage by topoisomerase II. However, the use of free epirubicin was rather restricted due to its limited targeting effects and the severe side effects in chemotherapy [Citation18,Citation19].
Dihydroartemisinin, originally isolated from the traditional Chinese medicinal plant Artemisia annua, is a first-line antimalarial drug [Citation20]. Recent studies have shown that dihydroartemisinin has antitumor effects and exhibits selective cytotoxicity on a variety of human tumors, including lung cancer [Citation21]. The antitumor characteristics of dihydroartemisinin included the induction of apoptosis, regulation of tumor-related genes, blockage of angiogenesis and inhibition of metastasis [Citation11]. Cell-penetrating peptides are a class of short peptides and can facilitate the cellular uptake of biomolecules. Arginine 8 (R8) is a promising ligand and possesses multi-functions including tumor targeting and tumor cell penetrating [Citation22]. Although R8 has a non-specific affinity to lung cancer cells, R8 modified drug delivery systems can firstly be accumulated into tumor sits by EPR effect after systemic administration and then the antitumor drugs are transported into tumor cells via the penetrating effects of R8 [Citation23]. In recent research, R8 modified liposomes were considered to be a potential anti-lung drug delivery system with negligible permanent damage to the cell membrane [Citation24]. Meanwhile, R8 can effectively transport liposomes across the cell membrane to improve drug uptake in the liposomes.
In this study, R8 modified epirubicin–dihydroartemisinin liposomes were designed and prepared to suppress cancer cell metastasis and increased cellular uptake in cancer cells [Citation25]. During their production, R8 was modified on the surface of the liposomes to increase cellular uptake via the cancer cell membrane. Distearoyl phosphoethanolamine-PEG2000 (DSPE-PEG2000) on the surface of liposomes could prolong the circulation time in the blood. Dihydroartemisinin was inserted into the lipid bilayer to inhibit tumor invasion, whereas epirubicin was encapsulated as an anticancer drug. The objectives of the study were to develop the novel type of targeting liposomes, to investigate the anticancer effects on NSCLC, to evaluate the anticancer effects and to clarify the relevant mechanism.
Materials and methods
Reagents and cell lines
Epirubicin, dihydroartemisinin, egg phosphatidylcholine (EPC) and cholesterol were provided by Meilun Co., Ltd. (Dalian, China). R8 was provided by Bosheng Biotechnology Co., Ltd. (Shanghai, China). Polyethylene glycol-distearoyl phosphatidylethanolamine-NHS (DSPE-PEG2000-NHS) was purchased from NOF Corporation (Tokyo, Japan). PRMI-1640 medium and fetal bovine serum (FBS) were ordered from GIBCO (Billings, MT, USA). A549 cells were obtained from the Institute of Basic Medical Science, Chinese Academy of Medical Science (Beijing, China). Other chemicals were of analytical or HPLC grade. A549 cells were cultured in PRMI-1640 medium supplemented with 10% FBS and 1% antibiotics (100 U/mL penicillin, and 100 µg/mL streptomycin). The cells were incubated in an atmosphere of 5% CO2 at 37 °C.BALB/c nude mice (18–20 g) were obtained from Experimental Animal Center of Peking University. All procedures were performed according to the guidelines of the Institutional Authority for Laboratory Animal Care of Liaoning University of Traditional Chinese Medicine.
Preparation of liposomes
DSPE-PEG2000-R8 was synthesized according to our previous report [Citation26]. Liposomes were prepared by film dispersion [Citation27]. Briefly, a mixture of EPC, cholesterol, DSPE-PEG2000, DSPE-PEG2000-R8, and dihydroartemisinin (molar ratio = 10:2:2:2:1) was dissolved in chloroform and the organic solvent was removed by rotary evaporation under vacuum at 40 °C. The lipid film was hydrated with ammonium sulfate by sonication in a water bath for 5 min. Subsequently, the suspensions were treated with an ultrasonic cell disruptor for 10 min (500 W). The liposomes were successively extruded through polycarbonate membranes with a pore size of 200 nm 3 times to yield the blank liposomes. The resulting liposomes were sealed in dialysis tubing (MW cutoff = 12,000–14,000 Da) and the external buffer was exchanged with PBS (pH = 7.4) 3 times in 24 h. Active loading was carried out by incubating the liposomes in a water bath set at 40 °C with intermittent shaking for 20 min after the addition of free epirubicin (lipids/drug = 40:1, w/w). In the end, R8 modified epirubicin–dihydroartemisinin liposomes were obtained.
Blank liposomes, dihydroartemisinin liposomes, epirubicin liposomes, and epirubicin–dihydroartemisinin liposomes were prepared according to the same method, and the compositions were EPC/cholesterol (5:1, mass ratio), EPC/cholesterol/dihydroartemisinin (10:2:1, mass ratio), EPC/cholesterol/epirubicin (20:4:1, mass ratio), and EPC/cholesterol/dihydroartemisinin/epirubicin (20:4:2:1, mass ratio). Blank control, DiR liposomes, and R8 modified DiR–dihydroartemisinin liposomes (lipids/DiR = 200:1, w/w) were prepared similarly as the fluorescent probes for demonstrating the distribution of liposomes in vivo.
Characterization of liposomes
Particle size, polydispersity index (PDI), and zeta potential values were measured using a Nano Series Zen 4003 Zetasizer (Malvern Instruments Ltd., Malvern, UK). Liposome morphology was observed using atomic force microscopy (AFM; NSK Ltd., Tokyo, Japan) and transmission electron microscopy (TEM; FEI Co., PDX, USA). Both epirubicin and dihydroartemisinin were measured by HPLC with a UV detector (Agilent Technologies Inc., CA, USA). The mobile phases were acetonitrile and 0.02 M sodium dihydrogen phosphate (32:68, volume ratio) for epirubicin, and acetonitrile and water (60:40 volume ratio) for dihydroartemisinin. The encapsulation efficiency was calculated as follows: encapsulation efficiency % = (Ae/Atotal) × 100%, where Ae represents the amount of encapsulated drug after elution and Atotal represents the total amount of drug before elution. The drug loading capacity was calculated as follows: LE(%) = (Wn/Wm)×100%, Where LE represents the drug loading percentage in the liposomes; Wn represents the amount of drug encapsulated in the liposomes; Wm represents the total weight of the drug carrier liposomes.
Cytotoxic effects on A549 cells
The sulforhodamine B (SRB) calorimetric assay was used to investigate the cytotoxicity of both free drugs and drug liposomes. Briefly, A549 cells (1.7 × 10⁴ cells/well) were seeded in 96-well plates and cultured for 24 h in an environment of 5% CO2 at 37 °C. Fresh medium containing serial concentrations of various drug formulations, including free epirubicin (0–5 µM), free dihydroartemisinin (0–5 µM), free dihydroartemisinin (0–50 µM) plus free epirubicin (0–5 µM), were added into the wells. In the liposome treatment groups, the cells were treated with blank liposomes, dihydroartemisinin liposomes, epirubicin liposomes, epirubicin–dihydroartemisinin liposomes, and R8 modified epirubicin–dihydroartemisinin liposomes. The concentration of epirubicin was in the range of 0–10 µM. The final concentration of the epirubicin liposomes was 10 µM (epirubicin/dihydroartemisinin = 1:5, molar ratio). The culture medium was used as blank control. The cytotoxic effects were assessed by the SRB colorimetric assay after incubation for an additional 48 h. After 1 h, the cells were mixed with trichloroacetic acid at 4 °C and washed with distilled water 5 times. Thereafter, A549 cells were stained with 0.4% SRB dye, and Tris base solution was added to dissolve the combined dye. The absorbance of the samples was measured at 540 nm using a microplate reader (HBS-1096A, DeTie, Nanjing, China). The cell viability was calculated as follows: Cell viability (%) = (Atre/Acon) × 100%, where Atre and Acon are the absorbance values of the treated cell samples and control cell samples, respectively. Subsequently, dose-effect curves were plotted. This assay was repeated in triplicate.
Cellular uptake and effects in A549 cells
To investigate uptake in A549 cells, semi-quantitative flow cytometry was used [Citation28]. Briefly, A549 cells (1.8 × 10⁵ cells/well) were seeded in 6-well plates and cultured for 24 h at 37 °C. A549 cells were treated with various drug-loaded liposomes at an epirubicin concentration of 10 µM (epirubicin/dihydroartemisinin = 1:5, molar ratio) and the culture medium was used as the blank control. After treatment for 3 h, the A549 cells were washed 3 times, trypsinized, and harvested in 0.3 ml of PBS. The fluorescence intensity of epirubicin in the cells (1 × 10⁴ cells) was analyzed with the FACScan flow cytometer (Becton Dickinson, San Jose, CA, USA). Each sample was assayed in triplicate.
To assess the intracellular distribution of the various liposomal formulations, fluorescence microscopy was used. Briefly, A549 cells (1.8 × 10⁵ cells/well) were seeded in a 6-well plate and cultured for 24 h at 37 °C. Thereafter, A549 cells were treated with various drug-loaded liposomes for an additional 3 h at an epirubicin concentration of 10 µM, and culture medium was used as the blank control. The cells were washed 3 times with cold PBS and fixed with paraformaldehyde. The nuclei were stained with Hoechst 33258 (1.5 µg/mL) for 6 min in a dark environment. The intracellular distribution of the various liposomal formulations was observed with a fluorescence microscope (Ti-Eclipse, Nikon, Japan).
In vitro release rates of drugs
In vitro release rates (RRs) of epirubicin and dihydroartemisinin from the varying liposomes were dialysed with PBS containing 10% plasma or normal saline. Briefly, 1.0 ml liposomes and 1.0 ml release medium were added into the dialysis tubing (MW cutoff =12,000–14,000 Da). After being sealed and soaked in 40 ml release medium, dialysis tubing vibrated at 37 °C with gentle shaking (100 rpm). Afterward, 0.5 ml release medium was sampled at 6, 12, 24, and 48 h, respectively. The same volume of fresh release medium was replaced immediately after each sampling. As described above, the content of epirubicin or dihydroartemisinin in samples was determined by HPLC method. RR was calculated using the following formula: RR% = (drug concentration at the time point/drug concentration in an equal volume of liposomes) × 100%. Each assay was repeated in triplicate.
Inhibitory effect on VM channels and tumor cell migration
The inhibitory effect on VM channels was evaluated by a Matrigel®-based tube formation assay as previously published by us [Citation29]. Briefly, A549 cells (4.6 × 10⁵ cells/well) were seeded in 6-well plates in PRMI-1640 medium in an environment with 5% CO2 at 37 °C for 24 h. Thereafter, the cells were treated with various drug-loaded liposomes for 12 h at an epirubicin concentration of 10 µM (epirubicin/dihydroartemisinin = 1:5, molar ratio). The A549 cells (4.5 × 10⁴ cells/well) were then resuspended in the serum-free culture medium, seeded in 96-well plates pre-coated with 60 µL Matrigel for 30 min, and cultured at 37 °C for 6 h. The formation of capillary-like structures was captured with an inverted optical microscope (XDS-1B; Photoelectric Co., Ltd., Chongqing, China).
The migration of A549 cells in vitro was assessed with a 24-well transwell®. Briefly, A549 cells (5.5 × 10⁴ cells/well) were resuspended and added into the upper chamber of a transwell unit containing 180 µL of serum-free PRMI-1640 medium, whereas 600 µL of 15% FBS-containing PRMI-1640 medium was added into the lower chamber, which served as the chemoattractant. The A549 cells in the upper chamber were incubated with various drug-loaded liposomes at 37 °C for 8 h at an epirubicin concentration of 10 µM (epirubicin/dihydroartemisinin = 1:5, molar ratio). After treatment, the transwell unit was washed, and the cells on the upper membrane were removed. The cells on the lower membrane were fixed with 4% formaldehyde for 25 min, stained with crystal violet for 35 min, and washed 4 times with cold PBS. The number of A549 cells on the lower membrane was observed in three random visual fields with an inverted optical microscope.
Inhibitory effect on A549 cell invasion
As previously reported, an in vitro wound healing assay was performed to evaluate the inhibitory effect of various formulations on A549 cell invasion [Citation30]. Briefly, A549 cells were seeded in 6-well plates (2.5 × 10⁶ cells/well) and cultured overnight. When the cells were approximately 60% confluent, three straight lines were made in the center of each well with the tip of a sterile pipette. The cells were washed with PBS and treated with various formulations at an epirubicin concentration of 10 µM (epirubicin/dihydroartemisinin = 1:5, molar ratio). Blank liposomes were used as blank control. The cells were incubated at 37 °C and observed with an inverted microscopy at 0, 12, and 24 h.
Effect on A549 cell adhesion
A cell adhesion assay was performed to inhibit tumor metastasis. Briefly, 40 µL of Matrigel (2.5 mg/ml) was added into the wells of a 96-well plate at room temperature. Thereafter, A549 cells were seeded in a 6-well plate and cultured for 24 h. The cells were treated with various drug-loaded liposomes (dihydroartemisinin liposomes, epirubicin liposomes, epirubicin–dihydroartemisinin liposomes, and R8 modified epirubicin–dihydroartemisinin liposomes) at concentrations of 10 µM for an additional 12 h (epirubicin/dihydroartemisinin = 1:5, molar ratio). Blank liposomes were used as blank control. After treatment, the cells were detached with trypsin, harvested, resuspended in 0.1 ml of culture medium containing 10% FBS, and seeded into the wells of the 96-well plate. A549 cells were incubated in an environment of 5% CO2 at 37 °C for 1 h. The number of cells was assessed with the 3–(4, 5-dimethylthiazol-2-yl)-2, 5-diphenyltetrazolium bromide (MTT) colorimetric assay. The cell adhesion rate was calculated as follows: AR (%) = (Atre/Auntre) × 100%, where Atre are the wells washed with the PBS buffer and Auntre are the unwashed wells.
In vivo imaging and pharmacodynamics study in tumor-bearing mice
To observe the real-time distribution of the R8 modified drug-loaded liposomes in A549 cells of xenograft mice, a noninvasive optical imaging system was used. DiR was encapsulated into liposomes as the fluorescent probe. BALB/c nude mice were housed under standard laboratory conditions. Briefly, 1.5 × 10⁶ cells were suspended in 200 µL of RPMI-1640 and injected into the right forelimb of mice. When the tumor volume reached 400–500 mm3, mice (n = 3 per group) were injected with the blank control, free DiR, DiR liposomes, and R8 modified DiR–dihydroartemisinin liposomes (0.2 mg/kg) via the tail vein. The mice were anaesthetized and scanned at 1, 3, 6, 12, 24, and 48 h using an in vivo imaging system (Carestream FX PRO; Carestream Health Inc., Rochester, NY, USA) equipped with an excitation and emission band-pass filters of 750 nm and 780 nm, respectively. The exposure times were 60 s for X-ray images and 30 s for fluorescent images, respectively.
A tumor-bearing mice model was established by inoculating the A549 cells in BALB/c nude mice as earlier described. After 10 day post-inoculation, the tumor-bearing mice were randomly distributed into 5 groups and received physiological saline (blank control), dihydroartemisinin liposomes, epirubicin liposomes, and epirubicin–dihydroartemisinin liposomes, and R8 modified epirubicin–dihydroartemisinin liposomes via intravenous injection into the tail. The dosage was 3 mg/kg epirubicin (epirubicin/dihydroartemisinin = 1:5, molar ratio) and the treatments were implemented every other day, four times in succession. To evaluate the anticancer efficacy of the liposome formulations, the tumor size was determined at different time points by using a vernier caliper. The tumor volume ratio was calculated using the following formula: tumor volume ratio = tumor volume measured in each group afterward/tumor volume measured in each group on day 0. To evaluate the toxicity of the different liposomes formulations, the body weight of mice was measured.
Regulation of the levels of VE-Cad, TGF-β1, MMP-2, and HIF-1α
Enzyme-linked immunosorbent assays (ELISA) (KeyGEN, Nanjing, China) were used to investigate the effects of the various formulations on the levels of VE-Cad, TGF-β1, MMP-2, and HIF-1α. A549 cells were cultured for 24 h. When the cells were approximately 80% confluent, they were incubated with blank liposomes, dihydroartemisinin liposomes, epirubicin liposomes, epirubicin–dihydroartemisinin liposomes, and R8 modified epirubicin–dihydroartemisinin liposomes. The concentration of epirubicin was 10 µM (epirubicin/dihydroartemisinin = 1:5, molar ratio). The cells were cultured for an additional 12 h, lysed, and harvested. The levels of VE-Cad, TGF-β1, MMP-2, and HIF-1α were measured with a microplate reader at 450 nm. This assay was repeated three independent times. The total protein concentration was measured at 540 nm with a bicinchoninic acid kit. The expression ratio was calculated as follows: expression ratio = (A450 nm for treated cells/A540 nm for treated cells)/(A450 nm for control cells/A540 nm for control cells), where A450 nm and A540 nm were the absorbance values.
Effects on A549 cell apoptosis
An Annexin V-FITC/propidium iodide (PI) double staining method was used to study the apoptotic- inducing effects of the various formulations on A549 cells. Briefly, A549 cells (2.5 × 10⁵ cells/well) were seeded in 6-well plates and cultured at 37 °C for 24 h. The cells were then treated with various formulations (dihydroartemisinin liposomes, epirubicin liposomes, epirubicin–dihydroartemisinin liposomes, and R8 modified epirubicin–dihydroartemisinin liposomes). The final concentration of epirubicin was 10 μM (epirubicin/dihydroartemisinin = 1:5, molar ratio). Blank liposomes were used as blank control. After incubation for an additional 24 h, the cells were trypsinized, harvested, and resuspended in binding buffer. The suspended cells were then stained with Annexin V-FITC and PI according to the manufacturer’s instructions. After incubation for 10 min at room temperature in a dark environment, a number of apoptotic cells were determined with a FACScan flow cytometer, and the results were plotted. This assay was repeated three independent times.
Statistical analysis
All data were presented as means ± standard deviation. One-way analysis of variance was used to determine the significance among groups, and the value of p<.05 was considered to be significant.
Results
Characterization of targeting molecule and liposomes
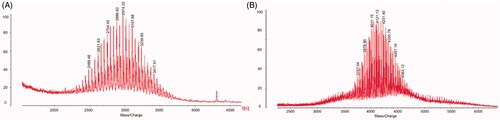
shows the MALDI-TOF-MS spectra of DSPE-PEG2000-NHS () and DSPE-PEG2000-R8 (). DSPE-PEG2000-R8 was synthesized by conjugating DSPE-PEG2000-NHS to R8. The average masses of DSPE-PEG2000 and DSPE-PEG2000-R8 were m/z 2974.32 () and m/z 4121.13 (). The differences in the masses of DSPE-PEG2000 and DSPE-PEG2000-R8 were consistent with the mass of the polypeptide chain R8.
Figure 1. Characterization of targeting liposomes. (A) MALDI-TOF-MS spectrum of DSPE-PEG2000-NHS. (B) MALDI-TOF-MS spectrum of DSPE-PEG2000-R8.
shows the characterization of the R8 modified epirubicin–dihydroartemisinin liposomes. shows the AFM and TEM morphology of the R8 modified epirubicin–dihydroartemisinin liposomes, respectively. By AFM, the targeting liposomes displayed a smooth surface with an approximate diameter of 0.1 μM and the results of TEM attested to the spherical morphology of the R8 modified epirubicin–dihydroartemisinin liposomes. shows the particle size of the R8 modified epirubicin–dihydroartemisinin liposomes, and shows the Zeta potential of the R8 modified epirubicin–dihydroartemisinin liposomes. shows the encapsulation efficiencies, particle sizes, polydispersity indexes, and zeta potentials of the various liposomes. The particle size of all liposomal formulations was approximately 100 nm and the encapsulation efficiency of epirubicin was greater than 90.00% with a narrow polydispersity index (<0.20). The loading capacity of dihydroartemisinin and epirubicin in R8 modified epirubicin–dihydroartemisinin liposomes were 5.5 ± 0.21% and 2.2 ± 0.29%, respectively.
Figure 2. Characterizations of R8 modified epirubicin–dihydroartemisinin liposomes. (A) AFM image of R8 modified epirubicin–dihydroartemisinin liposomes. (B) TEM image of R8 modified epirubicin–dihydroartemisinin liposomes. (C) Particle size of R8 modified epirubicin–dihydroartemisinin liposomes. (D) Zeta potential of R8 modified epirubicin–dihydroartemisinin liposomes.
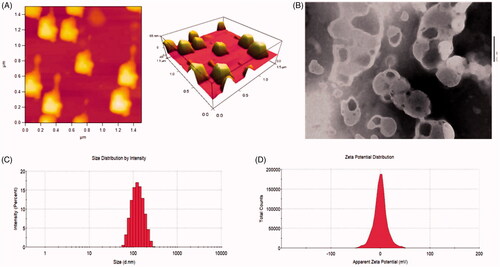
Table 1. Characterization of liposomes.
Intracellular uptake and effects in A549 cells
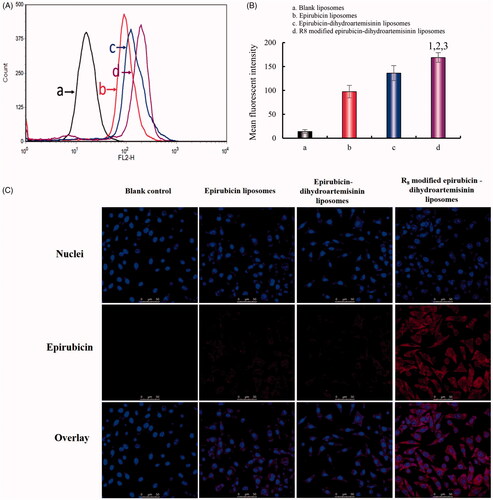
shows the fluorescent intensities in A549 cells after treatment with epirubicin liposomes, epirubicin–dihydroartemisinin liposomes, and R8 modified epirubicin–dihydroartemisinin liposomes. A semi-quantitative evaluation by flow cytometry showed that the geometric mean intensity value rank was as follows: R8 modified epirubicin–dihydroartemisinin liposomes > epirubicin–dihydroartemisinin liposomes > epirubicin liposomes > blank control. The fluorescent intensity of the R8 modified epirubicin–dihydroartemisinin liposomes was significantly higher than that of the epirubicin liposomes in A549 cells.
Figure 3. Intracellular uptake and targeting effects after incubation with varying formulations. (A) Cellular uptake of A549 cells. (B) Fluorescence intensity of epirubicin in A549 cells. (C) Fluorescence microscopy images of A549 cells incubated with varying formulations. (a) Blank control; (b) epirubicin liposomes; (c) epirubicin–dihydroartemisinin liposomes; (d) R8 modified epirubicin–dihydroartemisinin liposomes; p < .05. 1, vs. Blank control; 2, vs. epirubicin liposomes; 3, vs. epirubicin–dihydroartemisinin liposomes.
In vitro release rates of drugs
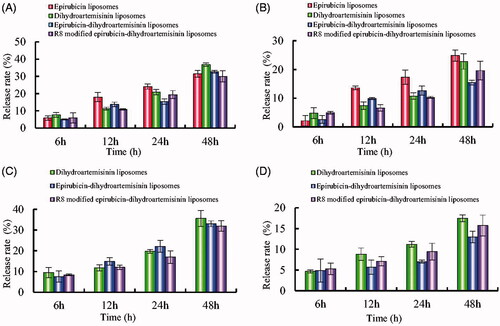
presents in vitro release results of the varying formulations with 10% plasma-containing PBS solution and with normal saline. Results showed that the RRs of epirubicin and dihydroartemisinin increased obviously after the addition of plasma into release medium. For R8 modified epirubicin–dihydroartemisinin liposomes, the RRs were 29.93 ± 3.24% for epirubicin and 31.92 ± 2.54% for dihydroartemisinin at 48 h with plasma-containing release medium, respectively.
Figure 4. In vitro release rates of drugs from varying liposomes in the simulated body fluids. (A) Release rate of epirubicin from varying formulations in PBS solution containing 10% mouse plasma; (B) release rate of epirubicin from varying formulations in normal saline; (C) release rate of dihydroartemisinin from varying formulations in PBS solution containing 10% mouse plasma; (D) Release rate of dihydroartemisinin from varying formulations in normal saline. Data are presented as mean ± standard deviation (SD) (n = 3).
Inhibitory effects in A549 cells
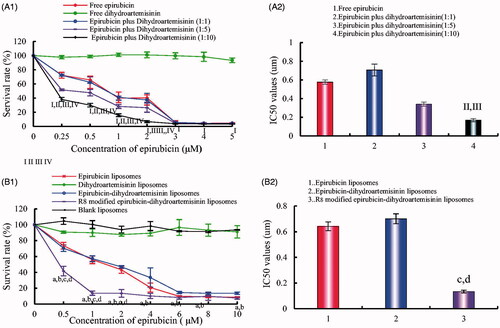
shows the cytotoxic effects of the various liposomal formulations in A549 cells. The results showed that free dihydroartemisinin and dihydroartemisinin liposomes had minimal cytotoxic effects (1 and 5(B)1). Furthermore, R8 modified epirubicin–dihydroartemisinin liposomes exhibited the most significant cytotoxic effects on A549 cells. After treatment with the various formulations, the inhibitory effects in A549 cells were as follows: R8 modified epirubicin–dihydroartemisinin liposomes > epirubicin–dihydroartemisinin liposomes > epirubicin liposomes > dihydroartemisinin liposomes. The IC50 values were 0.13 ± 0.07 for R8 modified epirubicin–dihydroartemisinin liposomes, 0.70 ± 0.08 for epirubicin–dihydroartemisinin liposomes, and 0.64 ± 0.20 for epirubicin liposomes.
Figure 5. Inhibitory effects on A549 cells after treatments with the varying formulations. (A) Inhibitory effects of free drugs; (B) Inhibitory effects of liposomal formulations. p < .05; I, vs. free dihydroartemisinin; II, vs. free epirubicin; III, vs. dihydroartemisinin: epirubicin = 1:1; IV, vs. dihydroartemisinin : epirubicin = 1:5; a, vs. blank liposomes; b, vs. dihydroartemisinin liposomes; c, vs. epirubicin liposomes; d, vs. epirubicin–dihydroartemisinin liposomes; data are presented as mean ± SD (n = 4).
Inhibitory effects on A549 cells invasion and VM channels
shows the inhibitory effects on cell invasion after treatment with various formulations. The invasive cells to the other side of the insert were dyed with crystal violet, and the inhibitory effects on A549 cells invasion were evaluated by the intensity of the calorimetric signal. The results demonstrated that the rank of the inhibitory effects on cell invasion was as follows: R8 modified epirubicin–dihydroartemisinin liposomes > epirubicin–dihydroartemisinin liposomes > epirubicin liposomes > dihydroartemisinin liposomes > blank control.
Figure 6. Destructive effects on VM channels and blocking effects on A549 cells migration in vitro after treatment with varying formulations. (A) Blocking effects on A549 cells migration; (B) destructive effects on VM channels, (a) blank control; (b) epirubicin liposomes; (c) dihydroartemisinin liposomes; (d) epirubicin–dihydroartemisinin liposomes; (e) R8 modified epirubicin–dihydroartemisinin liposomes.
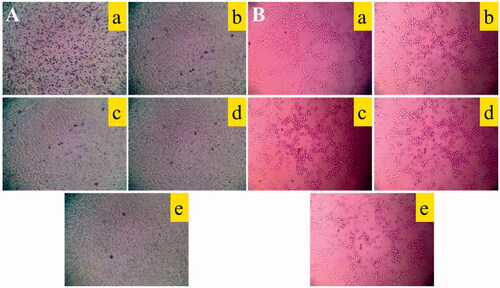
shows a destructive effect on the VM channels of A549 cells in three-dimensional Matrigel after treatment with various formulations. The results showed that the VM channels were significantly damaged after treatment with R8 modified epirubicin–dihydroartemisinin liposomes, which exhibited the strongest destructive effects on the VM channels compared with the other formulations. In addition, the epirubicin–dihydroartemisinin liposomes also disrupted the VM channels in A549 cells.
Wound healing assay on A549 cells
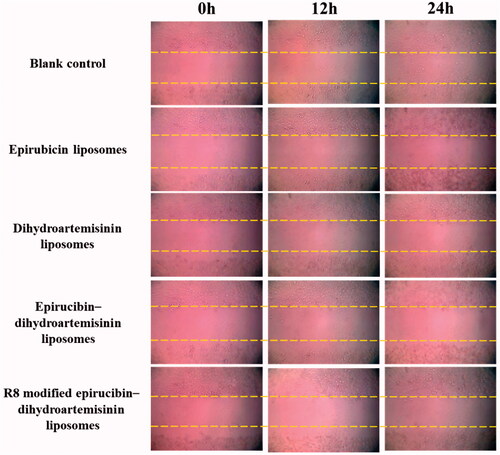
shows the effects of the various formulations on wound healing in A549 cells. Compared with the wound scratch at 0 h, the scratched area was smaller at 24 h after the addition of the blank control. By contrast, the healing effect was prevented by treatment with dihydroartemisinin liposomes, epirubicin liposomes, epirubicin–dihydroartemisinin liposomes and more evidently blocked by treatment with R8 modified epirubicin–dihydroartemisinin liposomes.
Figure 7. Blocking wound-healing effects in A549 cells after treatments with the varying liposomal formulations.
Cell adhesion assay
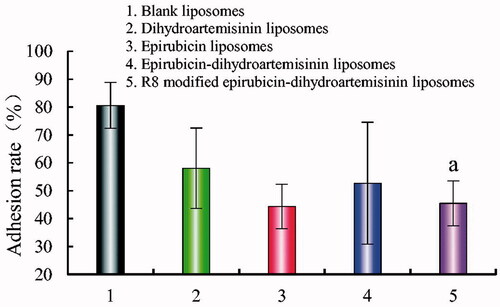
shows the adhesion rate of A549 cells on Matrigel after treatment with various formulations. The adhesion rates were 80.64 ± 7.94%, 58.10 ± 14.40%, 44.38 ± 21.84%, 52.72 ± 8.10%, and 45.49 ± 8.16% after treatment with blank liposomes, dihydroartemisinin liposomes, epirubicin liposomes, epirubicin–dihydroartemisinin liposomes, and R8 modified epirubicin–dihydroartemisinin liposomes, respectively. Compared with the blank control, the adhesion rate was reduced by 41.15% after treatment with the R8 modified epirubicin–dihydroartemisinin liposomes.
Figure 8. Adhesion rate of A549 cells on matrigel after incubation with the varying formulations. Adhesion rate of A549 cells on matrigel. p < .05; (1) blank liposomes; (2) epirubicin liposomes; (3) dihydroartemisinin liposomes; (4) epirubicin–dihydroartemisinin liposomes; (5) R8 modified epirubicin–dihydroartemisinin liposomes. a, vs. Blank liposomes.
In vivo imaging and pharmacodynamics study in tumor-bearing mice
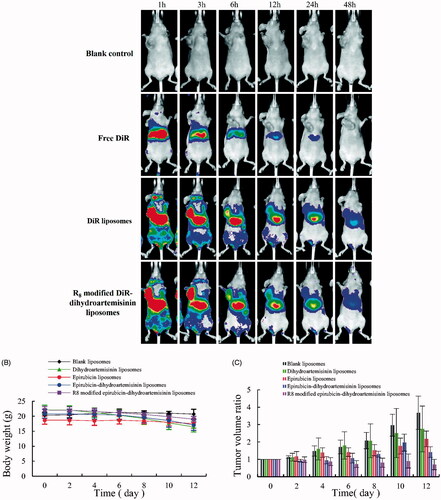
shows the in vivo real-time imaging of tumor-bearing mice after intravenous administration of the various DiR liposomes. After the administration of the R8 modified DiR–dihydroartemisinin liposomes, an intense tumor-associated fluorescent signal was observed, and the signal was maintained for 24 h. The rank of the DiR fluorescent signal at different time-points was as follows: R8 modified DiR–dihydroartemisinin liposomes > DiR liposomes > free DiR > blank control. shows that the weights of mice were 20.72 ± 1.61g, 16.46 ± 1.72g, 19.04 ± 1.52g, 17.06 ± 1.77g, and 19.04 ± 0.94g, respectively, after treatment with the blank liposomes, dihydroartemisinin liposomes, epirubicin liposomes, epirubicin–dihydroartemisinin liposomes and R8 modified epirubicin–dihydroartemisinin liposomes. indicates that the volume change ratios of the tumors were 2.75 ± 1.32% for dihydroartemisinin liposomes, 2.18 ± 0.45% for epirubicin liposomes, 1.41 ± 0.31% for epirubicin–dihydroartemisinin liposomes, and 0.70 ± 0.30% for R8 modified epirubicin–dihydroartemisinin liposomes.
Figure 9. In vivo real-time imaging observation after intravenous administration and antitumor effects in A549 cells xenografts mice after treatments with the varying formulations. (A) In vivo real-time imaging observation after intravenous administration of the varying formulations, (B) body weight changes, (C) tumor volume changes.
Regulating effects on metastasis related protein
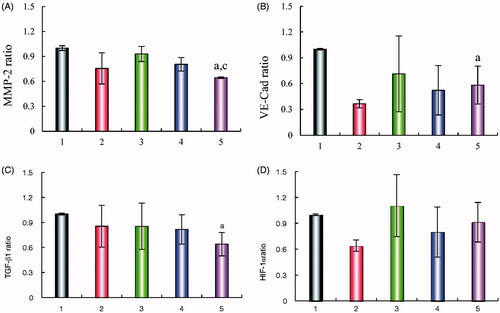
shows the expression of four metastasis-related proteins (VE-Cad, TGF-β1, MMP-2, and HIF-1α) in A549 cells after treatment with the various formulations. The results showed that the levels of the four metastasis-related proteins in A549 cells were down-regulated after treatment with R8 modified epirubicin–dihydroartemisinin liposomes. After treatment with R8 modified epirubicin–dihydroartemisinin liposomes, the levels of MMP-2, HIF-1α, E-Cad, and TGF-β1 were down-regulated to 0.64 ± 0.01, 0.91 ± 0.23, 0.58 ± 0.22, and 0.64 ± 0.14, respectively.
Figure 10. Regulating effects on VM related proteins. (A) MMP-2 protein expression ratio, (B) VE-Cad protein expression ratio, (C) TGF-β1 protein expression ratio, (D) HIF-1α protein expression ratio. Data are presented as the mean ± SD (n = 3). (1) Blank liposomes; (2) epirubicin liposomes; (3) dihydroartemisinin liposomes; (4) epirubicin–dihydroartemisinin liposomes; (5) R8 modified epirubicin–dihydroartemisinin liposomes. p<.05. a, vs. Blank liposomes; c, vs. Dihydroartemisinin liposomes. MMP-2: matrix metalloproteinase-2; VE-Cad: VE-Cadherin; TGF-β1: transforming growth factor-β1; HIF-1α: hypoxia inducible factor-1α.
Induced apoptosis in A549 cells
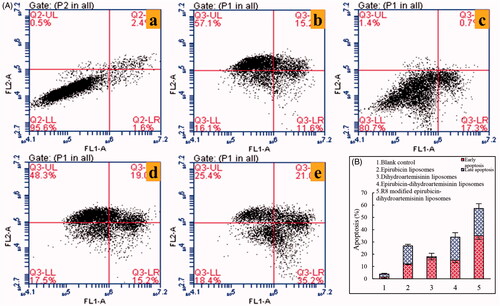
shows the in vitro apoptosis-inducing effects after treatment with various formulations. The apoptosis-inducing effects were expressed as a percentage of apoptotic cells in both the early and late periods. After the treatment with blank liposomes, dihydroartemisinin liposomes, epirubicin liposomes, epirubicin–dihydroartemisinin liposomes, and R8 modified epirubicin–dihydroartemisinin liposomes, the total percentages of apoptosis in A549 cells were 3.89 ± 0.23%, 26.83 ± 0.97%, 18.09 ± 0.68%, 33.99 ± 1.01% and 57.3 ± 0.72%, respectively. These results suggested that R8 modified epirubicin–dihydroartemisinin liposomes had the strongest apoptosis-inducing effect on A549 cells.
Figure 11. Apoptosis inducing effects on A549 cells after incubation with the varying formulations. (A) Plots by flow cytometry of apoptosis-inducing effects in A549 cells; (B) apoptosis-inducting effects after treatments with the varying formulations. Data are presented as the mean ± SD (n = 3). (1) Blank liposomes; (2) epirubicin liposomes; (3) dihydroartemisinin liposomes; (4) epirubicin–dihydroartemisinin liposomes; (5) R8 modified epirubicin–dihydroartemisinin liposomes.
Discussion
Currently, lung cancer is the most common cause of cancer death in men and the second most common cause in women. NSCLC represents a primary subgroup of lung cancer, and it is accompanied by high recurrence and mortality rates because of tumor metastasis, defects in VM channels, and side-effects caused by conventional chemoradiotherapy [Citation31,Citation32]. Surgical resection is considered to be the best choice for patients with lung cancer. However, most cases are not eligible for surgery. In addition, traditional drug delivery systems are highly ineffective due to limitations that include poor targeting, short drug half-lives, and destruction to healthy cells [Citation33]. Therefore, it is critical to identify new drug delivery strategies to overcome these limitations. With the development of medicine, the anticancer liposome system is one of the most effective ways to improve the solubility of hydrophobic drugs and to enhance the accumulation of drugs at the tumor site [Citation34,Citation35]. Hence, in this study, R8 modified epirubicin–dihydroartemisinin liposomes were developed to overcome these limitations.
In this study, R8 was modified on the liposomal surface via binding to DSPE-PEG2000-NHS to inhibit the proliferation of non-small lung cancer cells. MALDI-TOF-MS spectrum analysis confirmed that the DSPE-PEG2000-R8 conjugate was successfully synthesized (). The pharmacokinetics and biological distribution of the nanoparticles were considered to be significant factors in determining the physicochemical properties of the liposomes. The morphology of the R8 modified epirubicin–dihydroartemisinin liposomes was determined by TEM () and AFM (). The results indicated that the particle size range of the liposomes was suitable for the fenestrated vasculatures of cancer tissues via the enhanced permeability retention (EPR) effect (). Compared with normal liposomes, the effect of R8 on the size of the epirubicin–dihydroartemisinin liposomes could be ignored. The addition of DSPE-PEG2000 caused the zeta potentials of the R8 modified epirubicin–dihydroartemisinin liposomal formulation to become slightly negative ().
To evaluate cellular uptake, a semi-quantitative experiment was carried out using flow cytometry. The results demonstrated that the fluorescence intensity of the R8 modified epirubicin–dihydroartemisinin liposomes were stronger than that of the ordinary liposomes, which indicated an increased cellular uptake by cancer cells. The results showed that R8 modified on the liposome surface could increase the intracellular uptake (). To obtain the evidence, the intracellular distribution of the various formulations was observed with a fluorescent microscope. The nuclei stained with Hoechst 33258 were observed as blue fluorescence, and epirubicin was observed as red fluorescence. Bright purple fluorescence was used to indicate the localization of epirubicin in cancer cells. A549 cells containing R8 modified epirubicin–dihydroartemisinin liposomes exhibited the brightest purple, indicating that the targeting liposomes were accumulated in the cells (). Delayed RRs of liposomal drugs () would be conducive to prevent rapid drug leakage during the process of drug delivery and drug accumulation in tumor tissues.
An SRB assay was used to investigate A549 cell cytotoxicity in vitro by evaluating the inhibitory effect of the different liposomal formulations. The results showed that the cytotoxicity of epirubicin combined with dihydroartemisinin at various concentrations was stronger than that of epirubicin alone, whereas the survival rate of A549 cells was less affected by dihydroartemisinin alone (), indicating that dihydroartemisinin could improve the therapeutic effect of epirubicin. The cytotoxicity of liposomes on A549 cells was investigated after treatment with various liposomal formulations (). The IC50 values of the different formulations varied significantly after the addition of dihydroartemisinin or R8, further suggesting that the modification of R8 and the addition of dihydroartemisinin could improve the targeting and cytotoxicity of A549 cells.
To evaluate the inhibition of tumor migration by liposomal formulations, a transwell migration experiment was performed. The results showed that A549 cell migration was significantly inhibited in the presence of liposomes modified with dihydroartemisinin (). In order to assess the disruptive effect on angiogenesis, a VM channel model was established with A549 cells in a three-dimensional Matrigel model [Citation36]. It was found that both epirubicin–dihydroartemisinin liposomes and R8 modified epirubicin–dihydroartemisinin liposomes could significantly inhibit the formation of VM channels, indicating that the addition of dihydroartemisinin could destroy the VM channels (). It has also been reported that dihydroartemisinin can inhibit tumor metastasis. Therefore, wound-healing assays were further performed to evaluate the inhibitory effect on tumor migration [Citation37]. After the incubation with R8 modified epirubicin–dihydroartemisinin liposomes, wound healing was inhibited, further validating the inhibition of tumor migration ().
Inhibition of tumor cell adhesion to the basement membrane is an important approach to inhibit tumor metastasis [Citation38]. In this study, the adhesion of A549 cells was evaluated using Matrigel, which imitates the extracellular matrix. As shown in , all of the epirubicin liposomes could inhibit the adhesion of A549 cells to Matrigel with negligible cytotoxicity to tumor cells. Among all of the liposomal formulations, R8 modified epirubicin–dihydroartemisinin liposomes showed the most obvious inhibitory effects on adhesion, indicating that the targeting liposomes could prevent tumor metastasis.
The distribution of R8 modified DiR–dihydroartemisinin liposomes in tumor-bearing mice was investigated by real-time imaging, and the fluorescent DiR dye was used as the probe. After the administration of free DiR, the fluorescent signal gradually weakened and disappeared by 24 h. By contrast, on account of the PEG chain on the liposomal surface, R8 modified DiR–dihydroartemisinin liposomes exhibited prolonged stability in the blood circulation up to 48 h (). Enhancing drug transport and increasing intracellular uptake of R8 and dihydroartemisinin resulted in the increased accumulation of R8 modified DiR–dihydroartemisinin liposomes within tumor masses. There was negligible systemic toxicity after treatment with R8 modified epirubicin–dihydroartemisinin liposomes (). The tumor-bearing mice that received R8 modified epirubicin–dihydroartemisinin liposomes exhibited the strongest tumor inhibitory activity compared with mice of the other control groups, which indicated an improved treatment efficacy after treatment with the targeting liposomes ().
Tumor metastasis is a complicated process that is regulated by a variety of factors and the metastatic cascade is initiated by a series of protein expression alterations [Citation39]. MMP-2 is a proteolytic enzyme that is overexpressed in various human cancers. One of the major implications of MMPs in cancer progression is their role in extracellular matrix degradation, which allows tumor cells to migrate out of the primary tumor. The decreased expression of MMPs has been shown to suppress tumor metastasis [Citation40]. Under hypoxic conditions, HIF-1α is stabilized and promotes the expression of genes, which participate in the formation of VM channels. VE-Cad is an important protein involved in the adhesion between cells and matrix, thereby inhibiting cell dispersion. The down-regulation or deletion of VE-Cad expression can inhibit the infiltration of cancer cells, as well as metastasis. TGF-β1 can decrease the expression of VE-Cad. Therefore, the expression of MMP-2, VE-Cad, TGF-β1, MMP-2 and HIF-1α was investigated to further evaluate tumor metastasis. The results showed that R8 modified epirubicin–dihydroartemisinin liposomes significantly decreased the expression of MMP-2, VE-Cad, TGF-β1, MMP-2 and HIF-1α in A549 cells, and the down-regulation of these indicators may underlie the mechanism responsible for the inhibition of tumor migration ().
Apoptosis is the process of programmed cell death [Citation41]. For a human adult, 60 billion cells die each day as a result of apoptosis. Apoptosis is initiated through two pathways, namely, the intrinsic pathway and the extrinsic pathway, both of which are activated caspases [Citation42]. In this study, A549 cell apoptosis was measured. The results demonstrated that the effect of R8 modified epirubicin–dihydroartemisinin liposomes on the apoptosis of A549 cells was the most significant ().
Conclusion
In this study, we prepared R8 modified epirubicin–dihydroartemisinin liposomes and assessed the physical characteristics, targeting effect, cytotoxicity, and inhibitory effect on tumor metastasis from different perspectives and anticancer efficacy in vivo. The results testified that the R8 modified epirubicin–dihydroartemisinin liposomes prepared in this study were associated with the following characteristics: (i) the ideal particle size (∼100 nm) was favored aggregation in tumor tissues; (ii) the modification of R8 on the surface of liposomes was convenient for cellular uptake and improved targeting; and (iii) the addition of dihydroartemisinin inhibited the invasion of A549 cells and destroyed the VM channels by down-regulating the expression of various proteins. In vivo assays showed that the targeting liposomes exhibited a conspicuous anticancer efficacy. Meanwhile, systemic toxicity could be neglected. Therefore, the R8 modified epirubicin–dihydroartemisinin liposomes prepared in this study provided a treatment strategy with high efficiency for NSCLC.
Disclosure statement
There are no conflicts of interest about this work.
Additional information
Funding
Related Research Data
References
- Singh C, Qian JM, Yu JB, et al. Local tumor response and survival outcomes after combined stereotactic radiosurgery and immunotherapy in non-small cell lung cancer with brain metastases. J Neurosurg. 2019;15:1–6.
- Parchment RE, Doroshow JH. Theory and practice of clinical pharmacodynamics in oncology drug development. Semin Oncol. 2016;43:427–435.
- Agustoni F, Suda K, Yu H, et al. EGFR-directed monoclonal antibodies in combination with chemotherapy for treatment of non-small-cell lung cancer: an updated review of clinical trials and new perspectives in biomarkers analysis. Cancer Treat Rev. 2019;72:15–27.
- Naito Y, Yoshioka Y, Yamamoto Y, et al. How cancer cells dictate their microenvironment: present roles of extracellular vesicles. Cell Mol Life Sci. 2017;74:697–713.
- Dearing KR, Sangal A, Weiss GJ. Maintaining clarity: Review of maintenance therapy in non-small cell lung cancer. World J Clin Oncol. 2014;5:103–113.
- Wu H, Zhong Q, Zhong R, et al. Preparation and antitumor evaluation of self-assembling oleanolic acid-loaded Pluronic P105/d-alpha-tocopheryl polyethylene glycol succinate mixed micelles for non-small-cell lung cancer treatment. Int J Nanomed. 2016;11:6337–6352.
- Dubey P, Gidwani B, Pandey R, et al. In vitro and in vivo evaluation of PEGylated nanoparticles of bendamustine for treatment of lung cancer. Artif Cells Nanomed Biotechnol. 2016;44:1491–1497.
- M, Li Z J, Lin Z, et al. Antitumor activity of the novel HDAC inhibitor CUDC-101 combined with gemcitabine in pancreatic cancer. Am J Cancer Res. 2018;8:2402–2418.
- Partridge AH, Carey LA. Unmet needs in clinical research in breast cancer: where do we need to go? Clin Cancer Res. 2017;23:2611–2616.
- Shen J, Wang B, Zhang T, et al. Suppression of non-small cell lung cancer growth and metastasis by a novel small molecular activator of RECK. Cell Physiol Biochem. 2018;45:1807–1817.
- Zhu Y, Zhu R, Wang M, et al. Anti-metastatic and anti-angiogenic activities of core-shell SiO2@LDH loaded with etoposide in non-small cell lung cancer. Adv Sci. 2016;3:1600229.
- Xiang T, Lin YX, Ma W, et al. Vasculogenic mimicry formation in EBV-associated epithelial malignancies. Nat Commun. 2018;9:5009.
- Quiros-Gonzalez I, Tomaszewski MR, Aitken SJ, et al. Optoacoustics delineates murine breast cancer models displaying angiogenesis and vascular mimicry. Br J Cancer. 2018;118:1098–1106.
- Yeung CL A, Co NN, Tsuruga T, et al. Exosomal transfer of stroma-derived miR21 confers paclitaxel resistance in ovarian cancer cells through targeting APAF1. Nat Commun. 2016;7:11150.
- Wang X, Cheng L, Xie HJ, et al. Functional paclitaxel plus honokiol micelles destroying tumour metastasis in treatment of non-small-cell lung cancer. Artif Cells Nanomed Biotechnol. 2018;46:1154–1169.
- Liu JY, Wu XY, Wu GN, et al. FOXQ1 promotes cancer metastasis by PI3K/AKT signaling regulation in colorectal carcinoma. Am J Transl Res. 2017;9:2207–2218.
- Chida T, Miura Y, Cabral H, et al. Epirubicin-loaded polymeric micelles effectively treat axillary lymph nodes metastasis of breast cancer through selective accumulation and pH-triggered drug release. J Control Release. 2018;292:130–140.
- Zhou S, Zhang T, Peng B, et al. Targeted delivery of epirubicin to tumor-associated macrophages by sialic acid-cholesterol conjugate modified liposomes with improved antitumor activity. Int J Pharm. 2017;523:203–216.
- Baek SH, Ko JH, Lee JH, et al. Ginkgolic acid inhibits invasion and migration and TGF-beta-induced EMT of lung cancer cells through PI3K/Akt/mTOR inactivation. J Cell Physiol. 2017;232:346–354.
- Zhang S, Ma Y, Jiang J, et al. Inhibition of urokinase-type plasminogen activator expression by dihydroartemisinin in breast cancer cells. Oncol Lett. 2014;7:1375–1380.
- Liu Y, Gao S, Zhu J, et al. Dihydroartemisinin induces apoptosis and inhibits proliferation, migration, and invasion in epithelial ovarian cancer via inhibition of the hedgehog signaling pathway. Cancer Med. 2018;7:5704–5715.
- Zheng C, Ma C, Bai E, et al. Transferrin and cell-penetrating peptide dual-functioned liposome for targeted drug delivery to glioma . Int J Clin Exp Med. 2015;8:1658
- Liu Y, Ran R, Chen J, et al. Paclitaxel loaded liposomes decorated with a multifunctional tandem peptide for glioma targeting. Biomaterials. 2014;35:4835–4847.
- Kamei N, Yamaoka A, Fukuyama Y, et al. Noncovalent strategy with cell-penetrating peptides to facilitate the brain delivery of insulin through the blood-brain barrier. Biol Pharm Bullet. 2018;41:546–554.
- Carita AC, Eloy JO, Chorilli M, et al. Recent Advances and Perspectives in Liposomes for Cutaneous Drug Delivery. CMC. 2018;25:606–635.
- Song XL, Liu S, Jiang Y, et al. Targeting vincristine plus tetrandrine liposomes modified with DSPE-PEG2000-transferrin in treatment of brain glioma. Eur J Pharm Sci. 2017;96:129–140.
- Gu MM, Gao D, Yao PA, et al. P53-inducible gene 3 promotes cell migration and invasion by activating the FAK/Src pathway in lung adenocarcinoma. Cancer Sci. 2018;109:3783–3793.
- Mei D, Zhao L, Chen B, et al. α-Conotoxin ImI-modified polymeric micelles as potential nanocarriers for targeted docetaxel delivery to α7-nAChR overexpressed non-small cell lung cancer. Drug Deliv. 2018;25:493–503.
- Li XT, Ju RJ, Li XY. Multifunctional targeting daunorubicin plus quinacrine liposomes, modified by wheat germ agglutinin and tamoxifen, for treating brain glioma and glioma stem cells. Oncotarget. 2014;5:6497–6511.
- Ju RJ, Cheng L, Peng XM, et al. Octreotide-modified liposomes containing daunorubicin and dihydroartemisinin for treatment of invasive breast cancer. Artif Cells Nanomed Biotechnol. 2018;46:616–628.
- Zhao MH, Yuan L, Meng LY, et al. Quercetin-loaded mixed micelles exhibit enhanced cytotoxic efficacy in non-small cell lung cancer in vitro. Exp Therap Med. 2017;14:5503–5508.
- Song XL, Ju RJ, Xiao Y, et al. Application of multifunctional targeting epirubicin liposomes in the treatment of non-small-cell lung cancer. IJN. 2017;12:7433–7451.
- Gu QY, Qiu X, Liu JJ, et al. Nanostructured layered terbium hydroxide containing NASIDs: in vitro physicochemical and biological evaluations. J Nanosci Nanotechnol. 2018;18:5320–5326.
- Deshpande P, Jhaveri A, Pattni B, et al. Transferrin and octaarginine modified dual-functional liposomes with improved cancer cell targeting and enhanced intracellular delivery for the treatment of ovarian cancer. Drug Deliv. 2018;25:517–532.
- Wan X, Kong Z, Chu K, et al. Co-expression analysis revealed PTCH1-3'UTR promoted cell migration and invasion by activating miR-101-3p/SLC39A6 axis in non-small cell lung cancer: implicating the novel function of PTCH1. Oncotarget. 2018;9:4798–4813.
- Liu S, Zhang SM, Ju RJ, et al. Antitumor efficacy of Lf modified daunorubicin plus honokiol liposomes in treatment of brain glioma. Eur J Pharm Sci. 2017;106:185–197.
- Hu J, Chen LJ, Liu L, et al. Liposomal honokiol, a potent anti-angiogenesis agent, in combination with radiotherapy produces a synergistic antitumor efficacy without increasing toxicity. Exp Mol Med. 2008;40:617–628.
- Yuan R, Li S, Geng H, et al. Reversing the polarization of tumor-associated macrophages inhibits tumor metastasis. Int Immunopharmacol. 2017;49:30–37.
- Shen KH, Hung JH, Chang CW, et al. Solasodine inhibits invasion of human lung cancer cell through downregulation of miR-21 and MMPs expression. Chem Biol Interact. 2017;268:129–135.
- Li Y, Guo M, Lin Z, et al. Polyethylenimine-functionalized silver nanoparticle-based co-delivery of paclitaxel to induce HepG2 cell apoptosis. Int J Nanomed. 2016;11:6693–6702.
- Yu S, Sheu HM, Lee CH. Solanum incanum extract (SR-T100) induces melanoma cell apoptosis and inhibits established lung metastasis. Oncotarget. 2017;8:103509–103517.
- Sadat Shandiz SA, Shafiee Ardestani M, Shahbazzadeh D, et al. Novel imatinib-loaded silver nanoparticles for enhanced apoptosis of human breast cancer MCF-7 cells. Artif Cells Nanomed Biotechnol. 2017;45:1–10.