
Abstract
MicroRNAs (miRNAs) play essential functions in pathogenesis of Ewing sarcoma (ES). However, the molecular mechanisms responsible for ES occurrence and development through the regulation of miRNAs remain largely unknown. This study is aimed to explore the differential expressed miRNAs and mRNAs that play vital roles in ES. GSE80201 miRNA and GSE68776 mRNA microarray dataset were selected to carry out a series of bioinformatics analysis such as GEO 2R, gene ontology, pathway enrichment analysis, Venn analysis and PPI network construction to predict hub genes. Furthermore, using quantitative real-time PCR, RNA interference and luciferase reporter assay we demonstrated that activated leukocyte cell adhesion molecule (ALCAM/CD166) is a direct target of miR-21-3p in human ES cell lines. Our results suggest that the miR-21/CD166 axis has the potential to serve as both diagnostic markers and therapeutic targets for ES.
Introduction
Ewing sarcoma (ES), the second most common primary bone cancer, is a soft malignant tumour that mainly affects children and adolescents with poor outcomes [Citation1,Citation2]. Up to 40% of the patients will eventually relapse after initial treatment [Citation3]. The symptoms are unremarkable in early stages, high metastasis and recurrence rate have become the main obstacles in the treatment of ES [Citation4]. Further understanding of the mechanisms responsible for metastasis and recurrence will lead to the development of more effective therapy.
MicroRNAs (miRNAs) are 18–22 nucleotide non-coding RNAs that inhibit protein translation and promote mRNA degradation through complementary binding the 3′-untranslated region (3′-UTR) of their target mRNAs [Citation5]. It has been shown that miRNAs are involved in regulating multiple physiological processes as well as oncogenesis [Citation6,Citation7]. miRNAs influence tumour development by regulating tumour cell proliferation, growth, differentiation, metabolism and apoptosis, therefore, miRNAs can serve as both diagnostic marker and therapeutic targets for ES [Citation8]. Although miRNAs have been implicated in the pathogenesis of ES, the underlying molecular pathways that link miRNAs to the development ES remains undefined.
In our study, we combined bioinformatics analysis and research techniques of molecular biology to identify vital miRNAs and target genes involved in the prevention and treatment of ES. GEO2R analysis was used to identify differential expressed miRNAs (DEMs) and mRNAs between ES and normal tissues. Then, we used target gene prediction tools to screen out target genes corresponding to the vital DEMs. In addition, functions of differential expressed genes (DEGs) were annotated and pathway analysis was carried out. Furthermore, Venn analysis was adopted to select co-expressed DEGs between predicted target genes with DEMs, PPI networks of co-expressed DEGs were constructed using GeneMANIA. Finally, a series of confirmatory experiments were employed to identify ALCAM/CD166 as a direct target of miR-21, which functions as a tumour suppressor for in ES.
Materials and methods
Microarray data information
The human miRNA microarray dataset GSE80201 (GPL17603, Agilent-069978 miRXplore TM Microarray; Miltenyi Biotec GmbH, Cologne, Germany) and GSE68776 (GPL5175, Affymetrix Human Exon 1.0 ST Array; Affymetrix, Inc, USA) were downloaded from the Gene Expression Omnibus database (GEO, http://www.ncbi.nlm.nih.gov/geo/), a public genomics data repository [Citation9]. There were 24 samples in GSE80201, including 20 primary untreated ES and 4 normal human mesenchymal stromal cells (hMSCs). The gene expression profile of GSE68776 contained 74 samples, including 32 Ewing sarcoma tumours and 3 hMSCs (). The overall analysis process for this study is shown in .
Figure 1. The analysis process of this study.
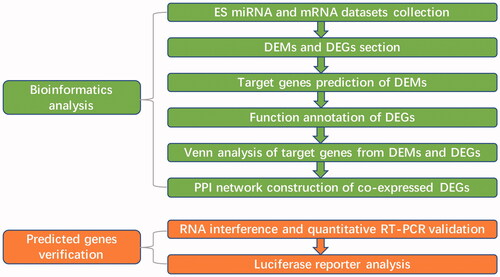
Table 1. The information of expression profiles.
Differential expression analysis
GEO2R (https://www.ncbi.nlm.nih.gov/geo/geo2r/) is a web application [Citation10] that allows users to perform sophisticated R-based analysis of GEO data to detect and analyse DEMs and identify up- and down-regulated DEGs between ES samples and normal controls. ES samples were allocated to test group and MSCs samples were allocated to control group in both GSE80201 and GSE68776 datasets. p values were adjusted using by the Benjamini and Hochberg test, p < 0.05 and |Log FC| ≥ 1 were considered as the cutoff values.
Target gene prediction of differential expressed miRNAs
TargetScan (www.targetscan.org) and miRDB (http://mirdb.org) were used to accomplish top 10 up- or down-regulated miRNAs target genes prediction. Then, miRNA-predicted target gene networks were constructed by Cytoscape, one of the most popular open-source software tools that offer researchers a versatile and interactive visualization interface, to visualize their interactions.
Gene ontology and pathway enrichment analysis
The significantly up- and down-regulated DEGs (p < .05 and FC ≥ 2) were further analysed by GO and KEGG in order to identify the DEGs at the functional level using the Database for Annotation, Visualization and Integrated Discovery (DAVID, https://david.ncifcrf.gov/), an online bioinformatics resource website that aims to provide tools for the functional interpretation of large lists of genes or proteins [Citation11]. We collected top 10 enrichment score (−log10 p value) in each analysis as the cutoff point.
Venn analysis
The DEGs (p < 0.05 and |Log FC| ≥ 1) of the gene expression profile and predicted miRNA target genes were imported into Functional Enrichment analysis tool (FunRich), which provides information on functional enrichment and interaction network of genes and proteins [Citation12]. Then, we used Venn to analyse function to obtain the co-expression genes.
PPI network construction
The protein–protein interaction (PPI) networks of co-expressed DEGs was generated using the GeneMANIA (http://www.genemania.org/), which is a web-based database tool for the prediction of gene functions on the basis of multiple networks derived from different genomic or proteomic data/sources, such as Bio-GRID, GEO, I2D and Pathway Commons.
Cell lines and cell culture
The human Ewing sarcoma cell lines A673 SK-ES-1 RD-ES and the hMSC cell line was obtained from the American Type Culture Collection (ATCC). A673 SK-ES-1 RD-ES cell lines were cultured in high glucose (Dulbecco minimum essential medium) (DMEM; GIBCO), and hMSC cell lines were cultured in low glucose DMEM (GIBCO) mixed with 10% fetal bovine serum (GIBCO) and 1% antibiotics (penicillin and streptomycin). All cell lines demonstrated above were cultured in 37 °C and 5% CO2 incubator.
RNA extraction and quantitative real-time polymerase chain reaction (qRT-PCR)
Total RNA was extracted using TRIzol (Invitrogen) following the manufacturer’s instructions. The hsa-miR-21-3p complementary DNAs (cDNAs) were synthesized using All-in-one miRNA First-Strand cDNA Synthesis Kit (GeneCopoeia, Rockville, MD, USA). To quantitate the mRNA expression of ALCAM, total RNA was reversely transcribed using All-in-one First-Strand cDNA Synthesis kit (GeneCopoeia). qRT-PCR was performed using SYBR Green qPCR Master Mix (Thermo Fisher Scientific). The expression level of ALCAM and hsa-miR-21-3p were normalized to the endogenous control of human glyceraldehyde-3-phosphate dehydrogenase (GAPDH) and U6 separately as the endogenous control. The expression levels of related RNAs were evaluated using the 2 − ΔΔCt method. All the primers were displayed in .
Table 2. The primers of miRNAs and mRNA.
RNA interference and oligonucleotide transfection
Small interfering RNAs (siRNAs), which can target the back-splice junction of hsa-miR-21-3p was designed. Then, miR-21-3p mimic, miR-21-3p mimic-control, miR-21-3p inhibitor and miR-21-3p inhibitor-control oligonucleotides were purchased from GenePharma (GenePharma, Shanghai, China) and transfected into A673 SK-ES-1 and RD-ES cells cultured with Opti Reduced Serum Medium (Opti-MEM, Gibco) using GoldenTran-R (Golden Trans Technology, Changchun, China). Opti-MEM was changed to DMEM 12-h after transfection. Then, we extracted total RNA and performed reverse transcription and qRT-PCR per manufacturer’s instructions.
Vector construction and luciferase reporter analysis
To determine whether ALCAM was regulated by miR-21 through targeting its 3′-UTR, the reporter gene recombinant plasmids were first constructed, the wild type or mutant type ALCAM 3′-URT were cloned into the Kpnl and HindIII sites of the pGL6-miR vector (Beyotime, China). About 2 × 10⁴ 293 T cells were seeded into each well of 24-well plates for 24 h before transfection. Firefly luciferase reporter gene assay kit (Beyotime) was adopted for the luciferase reporter analysis following the manufacturer’s protocols, pGL6-ALCAM-wt and pGL6-ALCAM-mut were co-transfected with miR-21mimics or miR-21 mimics-control into 293 T cells. The maximum luminescence wavelength of luciferin catalysed by firefly luciferin is 560 nm.
Data analysis
Each experiment was repeated at least three times. Fold-changes ≥2 and p values <0.05 in miRNA and gene microarray data were regarded as significantly differentially expressed. The volcano map and frequency distribution maps of DEGs were conducted using GraphPad Prism 7.0. p Values <0.05 were considered statistically significant.
Results
Differential expressed miRNAs and genes
The differential expression profile of miRNAs (DEMs) or mRNAs was generated using GEO2R tool. For the data set GSE80201, based on the thresholds of Fold-changes≥ 2 and p values <0.05, a total of 59 DEMs were obtained in the ES group compared with the control group, including 24 up-regulated and 35 down-regulated miRNAs. Volcano plots revealed that miRNAs were differentially expressed between ES patients and control subjects (. For the dataset GSE68776, 4786 DEGs, including 2000 up-regulated and 2786 down-regulated differential expressed genes (DEGs), were collected ().
Figure 2. Overview of aberrantly expressed miRNAs in ES. The Volcano plots of miRNA expression. Each point represented one miRNA. The red points (up-regulated) and green points (down-regulated) indicated the change in miRNA expression of more than 2.0-fold.
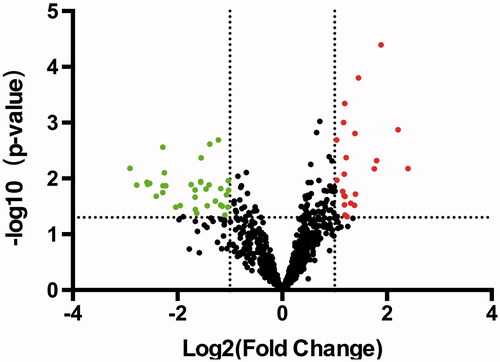
Table 3. The differential expressed miRNAs and mRNAs of the downloaded expression profiles.
Target gene prediction
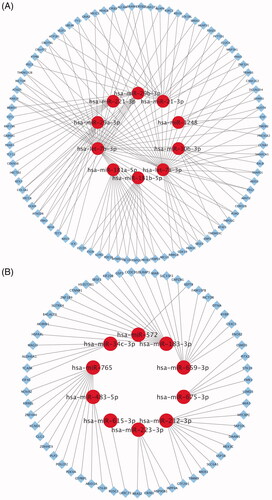
The potential target genes were identified using online bioinformatics database miRDB and TargetScan. Ten most up- and down-regulated miRNA-target gene networks were constructed using Cytoscape separately. There were 135 predicted target genes in the network of 10 most down-regulated miRNAs with high target score (). Meanwhile, 60 predicted target genes in the network of 10 most up-regulated miRNAs were collected with high target rank ().
Figure 3. The interactive network of 10 most up- and down-regulated miRNAs. (A) The interactive network consists of 10 most down-regulated miRNAs and 135 predicted target mRNAs. The red circle and blue diamond respectively represent miRNAs and target mRNAs. Solid lines represent relationship between two nodes. (B) The interactive network consists of 10 most up-regulated miRNAs and 60 predicted target mRNAs.
GO and pathway enrichment analysis of DEGs
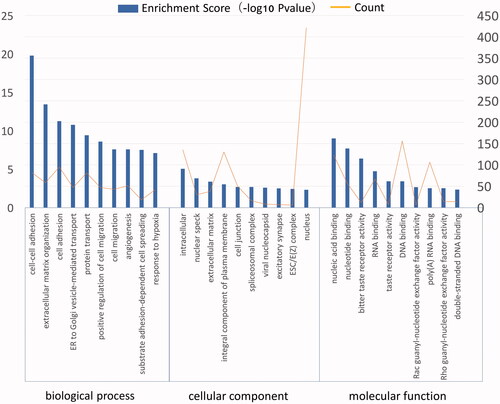
Functional annotations of up- and down-regulated DEGs were applied using DAVID. Top ten biological processes and pathways with p < 0.05 were selected. Enriched processes of up-regulated DEGs were significantly associated with cell-cell adhesion and cell adhesion in ES (), suggesting that up-regulated DEGs are primarily involved in enhancing ES tumour cells adhere to normal tissue. Down-regulated DEGs mainly played a role in taste process ().
Figure 4. GO analysis of up-regulated DEGs in ES. The GO annotation included biological process, cellular component and molecular function.
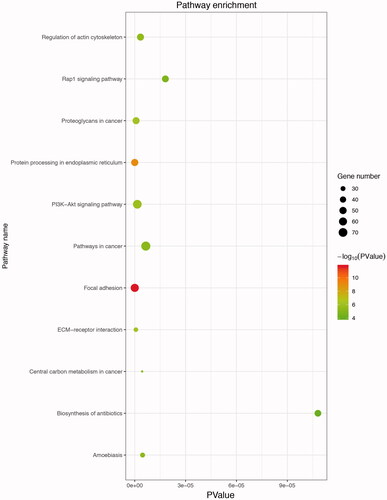
KEGG analysis of DEGs was also performed using DAVID. The pathway analysis (p < .05) revealed that up-regulated DEGs were mainly associated with focal adhesion, protein processing in endoplasmic reticulum, ECM-receptor interaction, proteoglycans in cancer and cancer signalling pathway, indicating up-regulated DEGs are involved in various cancer pathogenesis in ES (). However, the significantly enriched pathway of down-regulated DEGs was taste transduction, which seemed not relative to ES function.
Figure 5. Kyoto Encyclopedia of Genes and Genomes (KEGG) enrichment analysis of up-regulated DEGs. The gradual colour represents the p values; the size of the black spots represents the gene number.
The co-expressed DEGs
Up- and down-regulated DEGs were collected from predicted target genes and GSE68776 gene expression profile separately using Funrich. According to Venn analysis, 2 co-expressed down-regulated DEGs () and 20 co-expressed up-regulated DEGs () were found and presented in .
Figure 6. The Venn analysis of up- and down-regulated DEGs. (A) The Venn analysis of down-regulated DEGs and predicted up-regulated miRNAs target mRNAs display 2 co-expressed DEGs. (B) The Venn analysis of up-regulated DEGs and predicted down-regulated miRNAs target mRNAs shows 20 co-expressed DEGs.
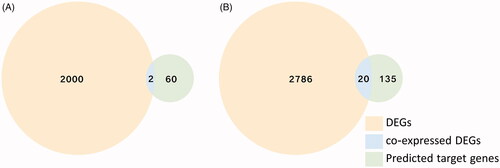
Table 4. The co-expressed DEGs of GSE68776 gene expression profile and predicted target genes.
PPI network of co-expressed DEGs and interested genes confirmation
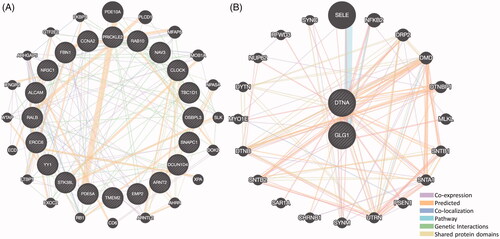
PPI networks of 20 up- and 2 down-regulated co-expressed genes were constructed using GeneMANIA online data sets. The genes related to the up-regulated DEG ALCAM were associated with guanyl nucleotide binding (), while the genes related to down-regulated DEGs were associated with dystrophin-associated glycoprotein complex, muscle construction and muscle system process ().
Figure 7. The protein-protein interaction (PPI) networks of co-expressed up- and down-regulated DEGs. (A) The PPI networks of 20 co-expressed up-regulated DEGs. (B) The PPI networks of 2 co-expressed down-regulated DEGs.
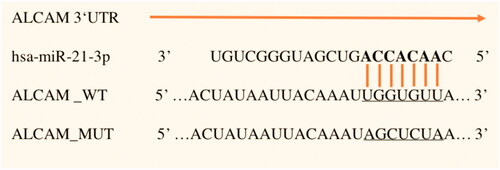
Activated leukocyte cell adhesion molecule (ALCAM), also known as CD166 (cluster of differentiation 166) [Citation13] has caught our attention because it was an up-regulated DEG of the mRNA microarray dataset that is also the predicted target gene of miR-21, which was the top 10 down-regulated miRNAs of the ES miRNA microarray dataset. Furthermore, both of them served vital roles in many kinds of tumours. The predicted binding sites of 3′-UTR using miRDB and TargetScan are displayed in .
Figure 8. miR-21 probable target binding site of 3′-UTR of ALCAM. The vertical lines represented binding sites of miR-21 in the 3′UTR of ALCAM.
Quantitative RT-PCR validation and RNA interference
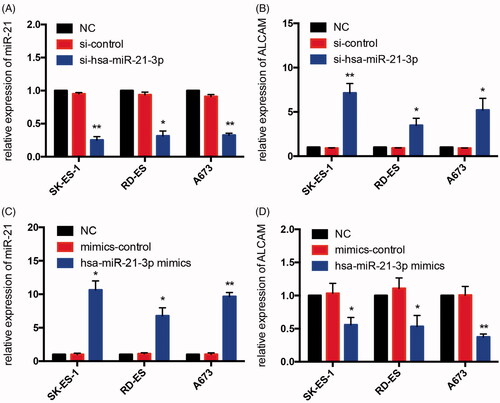
We validated the expression of miR-21 using qRT-PCR in three human Ewing sarcoma cell lines (A673, SK-ES-1, RD-ES) and the human MSC cell line. The expression of miR-21 was down-regulated significantly in three human Ewing sarcoma cell lines compared with the hMSC cell line (). The siRNAs were used to knockdown the expression of miR-21 and then the expression of ALCAM was analysed in each ES cell line. The expression of miR-21 was significantly decreased, whereas the expression of ALCAM was found significantly up-regulated in cells transfected with miR-21 inhibitor. On the contrary, miR-21 was up-regulated and the expression of ALCAM was found significantly down-regulated when the cells were transfected with miR-21 mimics ().
Figure 9. The expression of miR-21 in Ewing sarcoma cell lines. The expression levels of miR-21 were lower in each ES cell line contrasted with hMSC cell line by quantitative real-time PCR analysis.
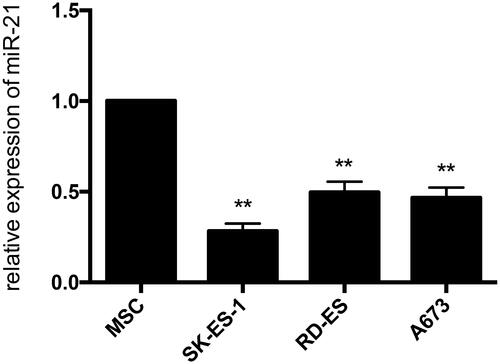
Figure 10. Validation of miR-21 and related mRNA ALCAM in three human Ewing sarcoma cell lines after transfecting mimics, mimics control, inhibitor and inhibitor control. (A,B) The expression of miR-21 was suppressed significantly and the expression levels of ALCAM were high in each ES cell line after treating with miR-21-3p inhibitor. (C,D) The expression levels of miR-21 and ALCAM were respectively up and down-regulated in ES cells after transfecting with miR-21-3p mimics; *p < 0.05; **p < 0.01.
miR‑21 targets ALCAM/CD166 gene in human ES cell lines
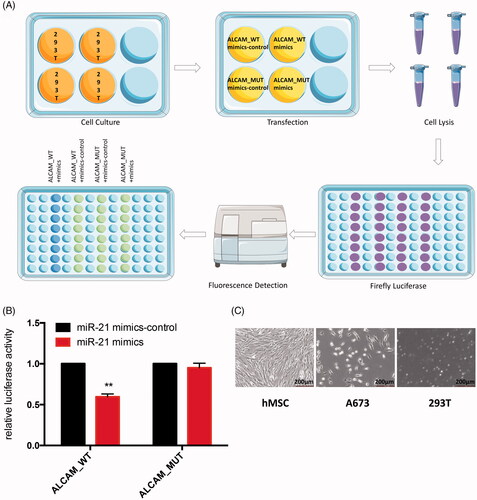
To prove AlCAM/CD166 was the target of miR-21 in human Ewing sarcoma cells, we performed luciferase assay. After the co-transfection with miR-21 mimics and wild type ALCAM reporter gene recombinant plasmids, the luciferase activity was significantly repressed compared with the mutant groups in 293 T cells ().
Figure 11. (A) Schematic diagram of luciferase reporter assay. The green dots represent stronger fluorescence signal, the blue dots represent weak fluorescence signal. (B) Relative luciferase activity of indicated ALCAM reporter constructs in 293 T cells. Transfection of miR-21 suppressed the activity of the luciferase reporter which contained the 3′-UTR of ALCAM significantly but did not influence the luciferase activity of the mutated 3′-UTR structure in 293 T cells. **p < .01. (C) Microscopic observation of hMSC cell line, A673 cell line and 293 T cells.
Discussion
Ewing sarcoma is a high malignant aggressive tumour of the bone and soft tissue affecting children and young adults, which have very poor prognosis [Citation14]. Although many genes have been reported to play a role in the development of ES, the molecular mechanisms remain largely unknown.
Generally, miRNAs can affect tumour cells growth, differentiation and apoptosis by repressing the expression of multiple target genes [Citation15]. Jedlicka et al. identified a group of miRNAs that negatively regulate the expression of multiple pro-oncogenic components of the IGF pathway in ES [Citation16]. Stamenkovic et al. showed that deregulation of miRNA-143 or miRNA-145 is involved in t cancer stem cell (CSC) self-renewal and tumour maintenance by targeting TARBP2 pathway [Citation17]. Moreover, Zhang et al. suggested that miR-638 may inhibit tumour growth by suppressing the activity of VEGFA [Citation18]. Nonetheless, the identification of specific miRNAs that play important roles in tumour development remains a complex and difficult task. With the development of new bioinformatics and molecular biology tools and gene chips, we are now in a better position to analyse a large number of samples to screen out vital DEMs of ES.
In this study, we employed microarray and bioinformatics tools to detect and analyze differential expressed miRNAs/mRNAs in Ewing sarcoma. A total of 59 DEMs and 4798 DEGs were identified between ES and hMSC samples through GES80201 and GSE68776 from GEO database using GEO2R online tool. Top 10 most up- and down-regulated miRNAs were performed target gene prediction using miRDB and TargetScan. Then, 22 co-expressed DEGs were selected via Venn analysis, which is more convincing with more evidence that plays significant role of ES.
In order to provide an in-depth analysis of DEGs function in ES, we first performed GO and KEGG analysis. Gene ontology (GO) is a comprehensive resource that collects a large number of gene annotation terms, including biological process (BP), cellular component (CC) and molecular function (MF) [Citation19]. Kyoto Encyclopedia of Genes and Genomes (KEGG) is an integrated database resource that provides biological interpretation of genome sequences and other high-throughput data [Citation20]. The up-regulated DEGs were mostly enriched in the BP term associated with cell adhesion. In addition, pathway enrichment analysis showed that down-regulated DEGs were mainly associated with metabolic pathways, focal adhesion, protein processing in endoplasmic reticulum, proteoglycans in cancer, endocytosis and cancer signalling pathways. According to the previous study, focal adhesion signalling pathway could regulate cell behaviour and influence tumour cell survival, which could serve as potential cancer targets [Citation21]. In order to understand the potential function of DEGs in ES, we separately analysed the up-regulated and down-regulated DEGs using Venn.
Interestingly, one DEG named ALCAM is found not only in the 22 co-expressed DEGs group as mention above but is also enriched in up-regulated BP term cell adhesion, suggesting that ALCAM may act as a significant molecular in ES. PPI networks also revealed that co-expressed up-regulated gene function was associated with guanyl nucleotide binding, which was consistent with the result of previous analysis showing ALCAM and miR-21 binding site consisted of 3 guanines among the seven binding sites. It is convenient and accurate enough using GeneMANIA to predict gene functions with the comprehensive datasets including organism-specific functional genomics datasets.
Our results of qRT-PCR validation showed the expression of miR-21 was lower in ES cell lines compared with hMSCs. Furthermore, the predicted miR-21 target gene ALCAM was up-regulated nearly three to seven times when the cells were transfected with miR-21 inhibitor. On the contrary, the expression of ALCAM was down-regulated almost two times when the cells were transfected with miR-21 mimics. Finally, luciferase reporter analysis further proved that miR-21 regulates ALCAM expression directly.
Previous studies of miRNA profiling experiments showed that miR-21 was found differentially expressed in human tumours [Citation22,Citation23]. Medina et al. explored the function of miR-21 in vivo and demonstrated miR-21 was a genuine oncogene, which indicated certain tumours are oncomiRs dependent [Citation24]. We now provide further evidence to support the role of miR-21 as a biological marker for ES. Previous studies indicated ALCAM expression correlated positively with cancer progression in various types of cancers [Citation25,Citation26] such as lung cancer, gastric cancer, pancreatic cancer and prostate cancer [Citation27–30]. Thus, over-expression of ALCAM may result in high metastasis and poor prognosis in ES. However, the mechanisms whereby ALCAM influencing tumour cells proliferation and metastasis in ES need to be confirmed in future studies.
Overall, we identified 59 miRNAs and 4786 mRNAs differentially expressed in ES. Moreover, we found ten most up- and down-regulated miRNAs and their 22 co-expressed mRNAs were more relative to ES pathological process, which is worthy to continue further research. According to bioinformatics analysis and experimental verification of qRT-PCR and luciferase reporter assay, we for the first time identified hsa-miR-21-3p as the potential regulator of ALCAM/CD166. miR-21/CD166 signalling axis may be adopted as novel biomarkers in the diagnosis and molecular therapy for Ewing sarcoma.
Disclosure statement
No potential conflict of interest was reported by the authors.
Additional information
Funding
References
- Bernstein M, Kovar H, Paulussen M, et al. Ewing's sarcoma family of tumours: current management. Oncologist. 2006;11:503–519.
- Brasme JF, Morfouace M, Grill J, et al. Delays in diagnosis of paediatric cancers: a systematic review and comparison with expert testimony in lawsuits. Lancet Oncol. 2012;13:e445–59.
- Burchill SA. Ewing's sarcoma: diagnostic, prognostic, and therapeutic implications of molecular abnormalities. J Clin Pathol. 2003;56:96–102.
- Gaspar N, Hawkins DS, Dirksen U, et al. Ewing sarcoma: current management and future approaches through collaboration. Jco. 2015;33:3036–3046.
- Thomson DW, Dinger ME. Endogenous microRNA sponges: evidence and controversy. Nat Rev Genet. 2016;17:272–283.
- Shenoy A, Blelloch RH. Regulation of microRNA function in somatic stem cell proliferation and differentiation. Nat Rev Mol Cell Biol. 2014;15:565–576.
- Dragomir M, Mafra ACP, Dias SMG, et al. Using microRNA networks to understand cancer. Int J Mol Sci. 2018;19:E1871.
- Li Z, Yu X, Shen J, et al. MicroRNA expression and its clinical implications in Ewing's sarcoma. Cell Prolif. 2015;48:1–6.
- Barrett T, Troup DB, Wilhite SE, et al. NCBI GEO: mining tens of millions of expression profiles–database and tools update. Nucleic Acids Res. 2007;35:D760–D765.
- Barrett T, Wilhite SE, Ledoux P, et al. NCBI GEO: archive for functional genomics data sets–update. Nucleic Acids Res. 2012;41:D991–D995.
- Huang DW, Sherman BT, Tan Q, et al. DAVID Bioinformatics Resources: expanded annotation database and novel algorithms to better extract biology from large gene lists. Nucleic Acids Res. 2007;35:W169–W175.
- Pathan M, Keerthikumar S, Ang CS, et al. FunRich: an open access standalone functional enrichment and interaction network analysis tool. Proteomics. 2015;15:2597–2601.
- Ohneda O, Ohneda K, Arai F, et al. ALCAM (CD166): its role in hematopoietic and endothelial development. Blood. 2001;98:2134–2142.
- Grier HE, Krailo MD, Tarbell NJ, et al. Addition of ifosfamide and etoposide to standard chemotherapy for Ewing's sarcoma and primitive neuroectodermal tumour of bone. N Engl J Med. 2003;348:694–701.
- Rupaimoole R, Slack FJ. MicroRNA therapeutics: towards a new era for the management of cancer and other diseases. Nat Rev Drug Discov. 2017;16:203–222.
- McKinsey EL, Parrish JK, Irwin AE, et al. A novel oncogenic mechanism in Ewing sarcoma involving IGF pathway targeting by EWS/Fli1-regulated microRNAs. Oncogene. 2011;30:4910–4920.
- De Vito C, Riggi N, Cornaz S, et al. A TARBP2-dependent miRNA expression profile underlies cancer stem cell properties and provides candidate therapeutic reagents in Ewing sarcoma. Cancer Cell. 2012;21:807–821.
- Zhou X, Chen J, Xiao Q, et al. MicroRNA-638 inhibits cell growth and tubule formation by suppressing VEGFA expression in human Ewing sarcoma cells. Biosci Rep. 2018;38:BSR20171017.
- Expansion of the gene ontology knowledgebase and resources. Nucleic Acids Res 2017;45:D331–d338.
- Kanehisa M, Sato Y, Kawashima M, et al. KEGG as a reference resource for gene and protein annotation. Nucleic Acids Res. 2016;44:D457.
- Eke I, Cordes N. Focal adhesion signaling and therapy resistance in cancer. Semin Cancer Biol. 2015;31:65–75.
- Pfeffer SR, Yang CH, Pfeffer LM. The role of miR-21 in cancer. Drug Dev Res. 2015;76:270–277.
- Si ML, Zhu S, Wu H, et al. miR-21-mediated tumour growth. Oncogene. 2007;26:2799–2803.
- Medina PP, Nolde M, Slack FJ. OncomiR addiction in an in vivo model of microRNA-21-induced pre-B-cell lymphoma. Nature. 2010;467:86–90.
- Wai Wong C, Dye DE, Coombe DR. The role of immunoglobulin superfamily cell adhesion molecules in cancer metastasis. Int J Cell Biol. 2012;2012:1.
- Weidle UH, Eggle D, Klostermann S, et al. ALCAM/CD166: cancer-related issues. Cancer Genom Proteom. 2010;7:231–243.
- Willrodt AH, Beffinger M, Vranova M, et al. Stromal expression of activated leukocyte cell adhesion molecule promotes lung tumour growth and metastasis. Am J Pathol. 2017;187:2558–2569.
- Ye M, Du YL, Nie YQ, et al. Overexpression of activated leukocute cell adhesion molecule in gastric cancer is associated with advanced stages and poor prognosis and miR-9 deregulation. Mol Med Rep. 2015;11:2004–2012.
- Kahlert C, Weber H, Mogler C, et al. Increased expression of ALCAM/CD166 in pancreatic cancer is an independent prognostic marker for poor survival and early tumour relapse. Br J Cancer. 2009;101:457.
- Hansen AG, Arnold SA, Jiang M, et al. ALCAM/CD166 is a TGF-beta-responsive marker and functional regulator of prostate cancer metastasis to bone. Cancer Res. 2014;74:1404.