
Abstract
This study aimed to explore the role of obestatin R gene-related protein (OB-RGRP) in autocrine signal transduction of adipocytes. Primary rat adipocytes were isolated and verified by microscopic observation and oil red O staining. OB-RGRP expression vector and OB-RGRP siRNA (si-OB-RGRP) were constructed and transfected into adipocytes. Adipocytes were then divided into five groups: (1) Control; (2) Vector (empty expression vector); (3) OB-RGRP (OB-RGRP expression vector); (4) si-OB-RGRP NC (si-OB-RGRP negative control); (5) si-OB-RGRP. mRNA and protein levels of OB-RGRP, JAK2, phosphorylated JAK2 (p-JAK2), STAT3 and phosphorylated STAT3 (p-STAT3) were examined using RT-PCR and western blot, respectively. Results showed that mRNA and protein levels of OB-RGRP in the Vector and si-OB-RGRP NC groups were similar to those in the Control group. Their levels in the si-OB-RGRP and OB-RGRP groups were significantly down-regulated and up-regulated (p < .05), respectively, in comparison with the control cells. There was no significant difference in the mRNA and protein levels of JAK2 and STAT3 among various groups. Moreover, the si-OB-RGRP NC and Vector groups induced similar ratios of p-JAK2 to JAK2 (p-JAK2/JAK2) and p-STAT3 to STAT3 (p-STAT3/STAT3) to the Control group. However, these two ratios in the si-OB-RGRP and OB-RGRP groups were significantly reduced and elevated (p < .05), respectively, in comparison with the Control group. These results suggested that OB-RGRP overexpression enhanced the levels of p-JAK2 and p-STAT3 while OB-RGRP silencing lowered their levels. In conclusion, OB-RGRP regulated the phosphorylation of JAK2 and STAT3 in primary rat adipocytes.
Introduction
Obesity is a common chronic metabolic disorder caused by many factors. When the body eats more calories than it consumes, the excess calories is stored as the fat in the body. When the amount exceeds the normal physiological requirement and reaches a certain value, it becomes obese. Obesity seriously endangers people's physical and mental health. It is also an independent risk factor for many chronic diseases such as type 2 diabetes mellitus, cardiovascular disease, hypertension, stroke and multiple cancers [Citation1].
Leptin is an endocrine hormone closely related to obesity, which is encoded by the obesity gene and secreted by adipocytes. The discovery of leptin has opened up a new field for the research of pathogenesis, prevention and treatment of obesity [Citation2]. Initially, the role of leptin is thought to be mediated only by the hypothalamic center [Citation3]. With the discovery of extensive existence of leptin receptor (OB-R) in peripheral tissues, more and more attention has been paid to the role of leptin in peripheral tissues. The presence of functional leptin receptor in adipocytes suggests the possibility of autocrine signaling pathway in adipocytes. In addition to leptin-hypothalamic regulatory pathway, leptin has a direct peripheral effect on body weight regulation. Leptin can directly regulate adipocyte metabolism, including inhibiting adipose synthesis and inducing adipose decomposition [Citation4]. Specific reduction of leptin receptor expression in adipocytes of mice leads to obesity, which provides direct evidence for the metabolic regulation of leptin-receptor autocrine pathway in adipocytes [Citation5]. Leptin-receptor autocrine signaling pathway in adipocytes plays an important role in body weight regulation and energy metabolism.
Obestatin (OB) is a 23-amino acid peptide hormone derived from the same gene as ghrelin [Citation6]. OB can reduce appetite, decrease body weight, and slow down gastric emptying. After birth, the levels of insulin and OB in the pancreas are significantly correlated [Citation7]. OB-R gene-related protein (OB-RGRP) is an OB-related receptor expressed in adipocytes. OB can regulate insulin secretion stimulated by high glucose concentration by influencing OB-RGRP [Citation8]. Regulation of autocrine signal transduction can prevent obesity. OB-RGRP regulates the expression in the membrane and signal transduction of OB-Rb in Hela cells and hypothalamus, and it regulates signal transduction in hepatocytes and myoblasts [Citation9].
Therefore, in this study, we explored the role of OB-RGRP in the autocrine signal transduction of adipocytes.
Materials and methods
Materials and animals
Dulbecco's Modified Eagle Medium: nutrient mixture F-12 (DMEM/F-12) media and fetal bovine serum (FBS) were bought from Gibco (Carlsbad, CA, USA). Lipofectamine 3000 reagent was purchased from Invitrogen (Carlsbad, CA, USA). Type I collagenase was obtained from Solarbio (Beijing, China). Oil red O staining kit was gotten from KeyGen Biotech (Nanjing, Jiangsu, China). EcoRI and XhoI were bought from Thermo Scientific (Waltham, MA, USA). Trizon reagent, Ultrapure RNA extraction kit, HiFiScript cDNA synthesis kit and UltraSYBR Mixture were bought from CWBIO (Beijing, China). Mouse anti-glyceraldehyde-3-phosphate dehydrogenase (GAPDH) monoclonal antibody (TA-08) and horseradish peroxidase (HRP) conjugated goat anti-mouse IgG(H + L) (ZB-2305), HRP-conjugated goat anti-rabbit IgG(H + L) (ZB-2301) were obtained from ZSGB-BIO (Beijing, China). Rabbit anti-OB-RGRP polyclonal antibody (DF7139) was gotten from Affinity (Cincinnati, OH, USA). Rabbit anti-signal transducer and activator of transcription 3 (STAT3) polyclonal antibody (A1192) was obtained from ABclonal (Wuhan, Hubei, China). Rabbit anti-Janus kinase 2 (JAK2) monoclonal antibody (ab108596), rabbit anti-phosphorylated JAK2 (p-JAK2) monoclonal antibody (ab32101) and rabbit anti-phosphorylated STAT3 (p-STAT3) monoclonal antibody (ab32143) were bought from Abcam (Cambridge, MA, USA).
Ten Sprague Dawley (SD) rats were purchased from Hunan SJA Laboratory Animal Co., Ltd. (license No. SCXK (Xiang) 2016–0002, Changsha, Hunan, China). The rats were housed in an environment with 22–25 °C, 40–60% relative humidity, and 12 h/12 h light/dark cycle and they had free access to food and water. The study protocol was approved by the Ethics Committee of Jiangxi Provincial People’s Hospital.
Isolation of primary rat adipocytes
The rats were euthanized by cervical dislocation and rapidly immersed in 75% ethanol for 3 min. The rats were taken out and placed on plates. The abdomen was wiped with 75% ethanol and the abdominal cavity was opened by low transverse incision. The fat in the groin was clamped with tweezers and cut off with surgical scissors. The fat was washed several times with Dulbecco's phosphate-buffered saline (D-PBS) containing 10% penicillin-streptomycin, and then the adherent tissue was carefully removed by sterile surgical scissors. The cleaned adipose tissue was minced and sucked into 10 ml centrifugal tubes. Type I collagenase was added to a working concentration of 0.1% and blended evenly. The mixture was incubated in 37 °C water bath for 75 min, during which it was blended once every 15 min. DMEM/F-12 media containing 20% FBS was added to stop digestion. The mixture was filtrated by 200 mesh screen. The filtrate was collected and centrifuged at 1800 rpm for 5 min. The upper layer of grease was carefully collected and resuspended in DMEM/F-12 media containing 20% FBS and 1 × penicillin-streptomycin. The suspension was seeded in culture plates and cultured at 37 °C and 5% CO2.
Oil red O staining
The culture media was removed and cells were fixed in 4% paraformaldehyde at room temperature for 15 min. Then cells were washed with distilled water, immersed fully in 60% isopropanol and stained in oil red O staining buffer for 8 min. After removing the staining buffer, cells were differentiated in 60% isopropanol, washed with distilled water and stained in hematoxylin solution for 2 min. After removing the staining solution, cells were washed with distilled water, air dried, mounted with glycerogelatin and observed under a microscope (CX41, Olympus, Japan).
Construction of OB-RGRP expression vector and interference vector
The sequence of OB-RGRP gene was searched on NCBI (https://www.ncbi.nlm.nih.gov/nuccore/AF139209.1). After introduction of restriction enzyme cutting sites EcoRI/XhoI, the gene fragment was synthesized and cloned into pcDNA3.1(+) vector. The sequences of the gene fragment was as follows: GAATTCATGGCGGGCGTTAAAGCTCTTGTGGCACTCTCCTTCAGTGGGGCAATTGGGCTGACCTTTCTTATGCTGGGATGTGCCTTGGAGGACTATGGCGTTTACTGGCCCCTGTTCGTCTTGATTTTCTACGTCATCTCCCCCATCCCCTACTTCATTGCCAAAAGGGTCACCTATGACTCGGACGCGACTAGCAGTGCCTGTCGGGAACTGGCATATTTCTTCACCACTGGGATTGTTGTTTCTGCCTTTGGATTTCCTGTTATTCTTGCTCGCGTGGCTGTGATCAAGTGGGGAGCCTGTGGTCTTGTGCTGGCTGGCAATGCTGTTATTTTCCTCACGATCCAAGGCTTCTTCCTCGTCTTTGGGAGAGGAGATGATTTCAGTTGGGAACAGTGGTAGCTCGAG.
The sequence of OB-RGRP gene was searched on NCBI (https://www.ncbi.nlm.nih.gov/nuccore/AF139209.1). siRNA was designed and synthesized by General Biosystems (Chuzhou, Anhui, China). The sequences of OB-RGRP siRNA are shown in .
Table 1. The sequences of OB-RGRP siRNA.
Cell transfection
Cells were seeded into 12-well plates at 8 × 10⁴ cells per well and cultured at 37 °C and 5% CO2. When the confluence reached about 70%, the cell culture media was replaced by 0.5 ml serum-free media. Lipofectamine 3000 (5 μl) was diluted in 125 μl serum-free media. siRNA/DNA was dissolved in diethylpyrocarbonate water and 12.5 μl siRNA/DNA solution was also diluted in 125 μl serum-free media. The lipofectamine 3000 was mixed with siRNA/DNA at room temperature for 15 min. The mixture was then added into the corresponding wells in the 12-well plates. The cells were cultured at 37 °C and 5% CO2 for 4 h. After addition of 1 ml culture media containing 20% FBS, the cells were cultured at 37 °C and 5% CO2 for another 48 h. Cells were observed under a fluorescence microscope (MF53, Guangzhou Micro-shot Technology Co., Ltd, China).
Experimental grouping
Cells were divided into five groups: (1) Control (normal primary rat adipocytes); (2) Vector (primary rat adipocytes transfected with empty expression vector); (3) OB-RGRP (primary rat adipocytes transfected with OB-RGRP expression vector); (4) si-OB-RGRP NC (primary rat adipocytes transfected with OB-RGRP-siRNA negative control); (5) si-OB-RGRP (primary rat adipocytes transfected with OB-RGRP-siRNA).
RT-PCR
Total RNA of cells in various groups was extracted using Trizon reagent and reversely transcribed to cDNA using HiFiScript cDNA synthesis kit per the manufacturer’s manuals. Sequences of primers are displayed in . Reaction system (25 μl) was made of 9.5 μl RNase free ddH2O, 1 μl cDNA/DNA, 1 μl forward primer, 1 μl reverse primer and 12.5 μl UltraSYBR Mixture. Reaction parameters included pre-denaturation at 95 °C for 10 min, denaturation at 95 °C for 10 s, annealing at 58.5 °C for 30 s and elongation at 72 °C for 30 s (40 circles). Dissociation curve was analyzed as follows: 15 s at 95 °C, 1 min at 58.5 °C, 15 s at 95 °C, 15 s at 58.5 °C, 15 s at 58.5 °C, measured stepwise from 95 °C, every 0.5 °C. Products were measured by a RT-PCR system (CFX Connect, Bio-Rad, Hercules, CA, USA). Relative mRNA expression was calculated per the 2−ΔΔCt method [Citation10]. GAPDH served as internal control.
Table 2. Primers of PCR.
Western blot
The cells in various groups were lysed in RIPA buffer at 4 °C for 30 min and then centrifuged at 4 °C and 10,000 rpm for 10 min. The supernatant was collected carefully to acquire total protein. Protein concentration was measured using BCA kit. Thereafter, the protein was denatured and loaded to perform SDS-PAGE for 1–2 h. Membrane transfer was conducted for 30–50 min by a wet method. Subsequently, the membrane was incubated with primary antibodies at 4 °C overnight. It was washed and incubated with secondary antibodies at room temperature for 2 h. After addition of enhanced chemiluminescence reagent, the protein bands were examined using a gel imaging system (ChemiDoc XRS+, Bio-Rad, Hercules, CA, USA). Quantity One software (v4.62, Bio-Rad, Hercules, CA, USA) was used to analyze gray values. GAPDH served as internal control.
Statistical analysis
Quantitative data were expressed as mead ± standard deviation. One way analysis of variance (ANOVA) followed by Tukey post-hoc test was performed using SPSS software (v19.0, SPSS Inc., USA). Significant difference was defined at P < 0.05.
Results
Isolation and identification of primary rat adipocytes
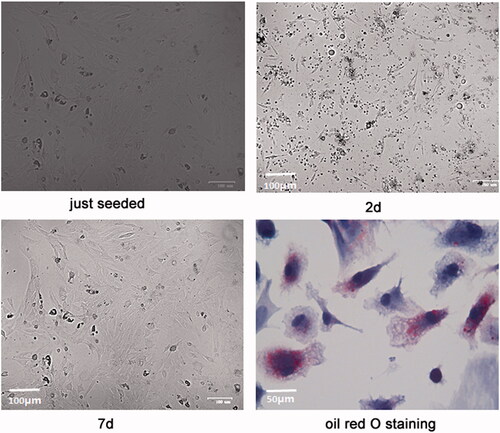
showed the morphology of the isolated primary rat adipocytes. Adipocytes were round-like and suspended in the culture media when they were just seeded. After 2 days, the cells began to stretch and gradually became polygonal spindle. At about 7 days, the cells entered the exponential growth phase and showed a whirlpool shape. After oil red O staining, the reflective granules in the cytoplasm were orange, so the cells were identified as adipocytes.
Figure 1. Isolation and identification of primary rat adipocytes. The morphology of the isolated primary rat adipocytes at 0 day (just seeded), 2 days (2d) and 7 days (7d) and after oil red O staining was showed.
Interference sequences screening and overexpression verification
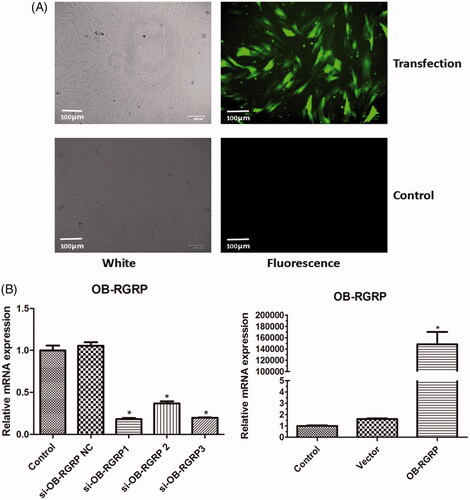
showed the fluorescence image of cells after OB-RGRP was transfected. The green fluorescence confirmed the successful transfection of OB-RGRP into cells. showed the mRNA level of OB-RGRP in the cells transfected with different siRNAs of OB-RGRP and overexpression vector of OB-RGRP. The relative mRNA expression of OB-RGRP in the cells transfected with OB-RGRP-siRNA negative control and empty expression vector was similar to that in the control cells. Compared with the control cells, the relative mRNA expression of OB-RGRP in the cells transfected with OB-RGRP-siRNA-1, OB-RGRP-siRNA-2 and OB-RGRP-siRNA-3 decreased significantly (p < .05), and the relative mRNA expression of OB-RGRP in the cells transfected with OB-RGRP expression vector increased sharply (p < .05). These verified the successful transfection of the interference sequences and the overexpression vector. Moreover, OB-RGRP-siRNA-1 induced the most obvious decline, so it was recognized as the most effective siRNA of OB-RGRP which was used in the following experiment.
Figure 2. Fluorescence images of cells after OB-RGRP was transfected (A) and mRNA levels of OB-RGRP in the cells transfected with different siRNAs of OB-RGRP and overexpression vector of OB-RGRP which were determined by RT-PCR (B). si-OB-RGRP1: OB-RGRP-siRNA-1; si-OB-RGRP2: OB-RGRP-siRNA-2; si-OB-RGRP3: OB-RGRP-siRNA-3; si-OB-RGRP NC: OB-RGRP-siRNA negative control; Vector: empty expression vector; OB-RGRP: OB-RGRP expression vector. *p < .05 vs. Control.
OB-RGRP level
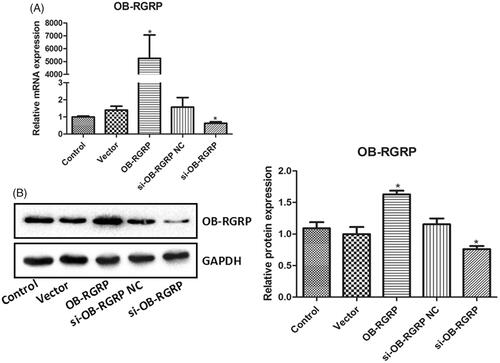
showed the relative mRNA and protein levels of OB-RGRP in the cells transfected with OB-RGRP siRNA and expression vector. The transfection of OB-RGRP-siRNA negative control and empty expression vector induced similar mRNA and protein levels of OB-RGRP in the cells to the control. Their levels in the cells transfected with OB-RGRP siRNA and OB-RGRP expression vector were significantly down-regulated and up-regulated (p < .05), respectively, in comparison with the control cells.
Figure 3. The relative mRNA (A) and protein (B) levels of OB-RGRP in the cells transfected with OB-RGRP siRNA and expression vector which were determined by RT-PCR and western blot, respectively. si-OB-RGRP1: OB-RGRP-siRNA-1; si-OB-RGRP2: OB-RGRP-siRNA-2; si-OB-RGRP3: OB-RGRP-siRNA-3; si-OB-RGRP NC: OB-RGRP-siRNA negative control; Vector: empty expression vector; OB-RGRP: OB-RGRP expression vector. *p < .05 vs. Control.
Levels of JAK2, p-JAK2, STAT3 and p-STAT3
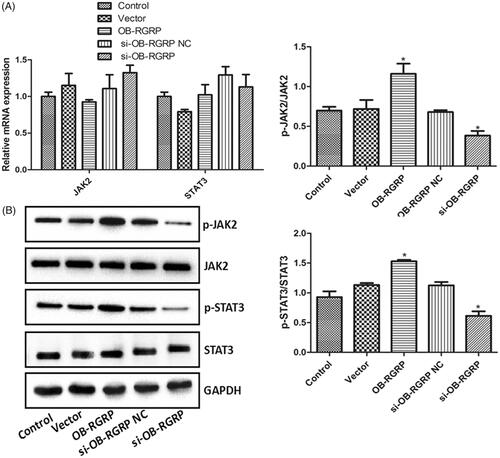
showed the relative mRNA and protein levels of JAK2, p-JAK2, STAT3 and p-STAT3 in the cells transfected with OB-RGRP siRNA and expression vector. There was no significant difference in the mRNA and protein levels of JAK2 and STAT3 among various groups. The transfection of OB-RGRP-siRNA negative control and empty expression vector induced similar ratios of p-JAK2 to JAK2 (p-JAK2/JAK2) and p-STAT3 to STAT3 (p-STAT3/STAT3) to the control. However, these two ratios in the cells transfected with OB-RGRP siRNA and OB-RGRP expression vector were significantly reduced and elevated (p < .05), respectively, in comparison with the control cells. It was suggested that OB-RGRP overexpression enhanced the levels of p-JAK2 and p-STAT3 while OB-RGRP silencing lowered their levels.
Figure 4. The relative mRNA (A) and protein (B) levels of JAK2, p-JAK2, STAT3 and p-STAT3 in the cells transfected with OB-RGRP siRNA and expression vector which were determined by RT-PCR and western blot, respectively. si-OB-RGRP1: OB-RGRP-siRNA-1; si-OB-RGRP2: OB-RGRP-siRNA-2; si-OB-RGRP3: OB-RGRP-siRNA-3; si-OB-RGRP NC: OB-RGRP-siRNA negative control; Vector: empty expression vector; OB-RGRP: OB-RGRP expression vector. *p < .05 vs. Control.
Discussion
In this study, primary adipocytes were isolated from rats. Microscopic observation and oil red O staining verified the correctness of the isolated cells. Subsequently, OB-RGRP siRNA and expression vector were successfully transfected into the primary rat adipocytes, silencing and overexpressing OB-RGRP, respectively.
OB-RGRP is a transmembrane protein receptor encoded by diabetes-related genes [Citation11]. OB-RGRP mainly transports leptin among different tissues and has the function of binding free leptin and buffering blood circulation concentration [Citation12,Citation13]. It was reported that leptin-receptor signal regulation is mainly mediated by JAK/STAT cascade pathway [Citation14]. JAK/STAT pathway contains four tyrosine kinases (JAKs) and seven transcription factors (STATs), which are regulated by specific phosphorylation of serine and tyrosine residues [Citation15–17]. Leptin receptor has no intrinsic tyrosine kinase region, so it mainly binds to JAK2. After the receptor binds to leptin, the conformational changes cause the juxtaposition and activation of JAKs and the phosphorylation of the tyrosine residues of other JAKs and receptor. JAK2 is activated by the phosphorylation, which subsequently phosphorylates the tyrosine residues in the intracellular segment of the receptor. The signal is transmitted downstream. Phosphorylation of tyrosine residue Tyr1138 recruits transcription factor STAS3 to become a substrate for receptor-related JAKs. Phosphorylated STATs separate from the receptors and form activated dimers, which are then translocated to the promoter of the target gene in the nucleus to regulate gene expression and participate in energy balance and metabolic regulation [Citation18–21]. A previous study has shown that either mutation of Tyr985 or Tyr1077 residues of leptin receptors leads to the weakening of STAT3 phosphorylation activation and affects signal transduction, while the simultaneous mutation of these two residues blocks signal transduction and induces leptin resistance [Citation22]. In this study, we revealed that the expression of p-JAK2 and p-STAT3 increased significantly after OB-RGRP overexpression, while the expression of p-JAK2 and p-STAT3 decreased significantly after OB-RGRP silencing, which indicated that the change of OB-RGRP expression could regulate the activation of JAK/STAT signaling pathway. In addition to affecting receptor expression, leptin works more through the mutual regulation of JAK-STAT3 signaling pathways [Citation23].
In conclusion, OB-RGRP regulated the phosphorylation of JAK2 and STAT3 in primary rat adipocytes. This might contribute a lot to the exploration of the role of OB-RGRP-JAK2-STAT3 autocrine regulatory pathway in leptin resistance.
Disclosure statement
No potential conflict of interest was reported by the authors.
Data availability
The analyzed data sets generated during the study are available from the corresponding author on reasonable request.
Additional information
Funding
Related Research Data
References
- Working Group on Obesity in China. The guidelines for prevention and control of overweight and obesity in Chinese adults. Acta Nutr Sin. 2004;26:1–4.
- Enriori PJ, Sinnayah P, Simonds SE, et al. Leptin action in the dorsomedial hypothalamus increases sympathetic tone to brown adipose tissue in spite of systemic leptin resistance. J Neurosci. 2011;31:12189–12197.
- Knobelspies H, Zeidler J, Hekerman P, et al. Mechanism of attenuation of leptin signaling under chronic ligand stimulation. BMC Biochem. 2010;11:2.
- Guohui W, Zhao F, Yuan K, et al. The direct effect of leptin on adipocyte. Chinese J Aesth Med. 2007;16:1346–1349.
- Huan JN, Li J, Han Y, et al. Adipocyte-selective reduction of the leptin receptors induced by antisense RNA leads to increased adiposity, dyslipidemia, and insulin resistance. J Biol Chem. 2003;278:45638–45650.
- Cowan E, Burch KJ, Green BD, et al. Obestatin as a key regulator of metabolism and cardiovascular function with emerging therapeutic potential for diabetes. Br J Pharmacol. 2016;173:2165–2181.
- Rozzo A, Meneghel-Rozzo T, Delakorda SL, et al. Exocytosis of insulin: in vivo maturation of mouse endocrine pancreas. Ann N Y Acad Sci. 2009;1152:53–62.
- Couturier C, Sarkis C, Séron K, et al. Silencing of OB-RGRP in mouse hypothalamic arcuate nucleus increases leptin receptor signaling and prevents diet-induced obesity. Proc Natl Acad Sci USA. 2007;104:19476–19481.
- Bailleul B, Akerblom I, Strosberg AD. The leptin receptor promoter controls expression of a second distinct protein. Nucleic Acids Res. 1997;25:2752–2758.
- Livak KJ, Schmittgen TD. Analysis of relative gene expression data using real-time quantitative PCR and the 2(-Delta Delta C(T)) Method. Methods. 2001;25:402–408.
- Bailleul B, Rouille Y, Seron K, et al. LEPROTL1 and OB-RGRP genes for screening compounds that act on the gain or loss of weight or on diabetes in a human or animal subject. 2006. PAT - US2006068429. Publication: 2006-03-30.
- Bailleul B, Rouille Y, Seron K, et al. Use of the genes leprotl1 and ob-RGRP for the screening of active compounds for weight gain or loss or diabetes in human or animal subjects. 2004. PAT - CA2518761. Publication: 2004-09-23.
- Crippen TL. Insecticide resistance of Alphitobius diaperinus to β-Cyfluthrin and commercial insecticides on various surfaces common in poultry operations. Proc Natl Acad Sci USA. 2013;104:19476–19481.
- Mullen M, Gonzalez-Perez RR. Leptin-Induced JAK/STAT Signaling and Cancer Growth. Vaccines (Basel). 2016;4:26.
- Erkasap S, Erkasap N, Bradford B, et al. The effect of leptin and resveratrol on JAK/STAT pathways and Sirt-1 gene expression in the renal tissue of ischemia/reperfusion induced rats. Bll. 2017;118:443–448.
- Landry DA, Sormany F, Haché J, et al. Steroidogenic genes expressions are repressed by high levels of leptin and the JAK/STAT signaling pathway in MA-10 Leydig cells. Mol Cell Biochem. 2017;433:79–95.
- Zheng XJ, Yang ZX, Dong YJ, et al. Downregulation of leptin inhibits growth and induces apoptosis of lung cancer cells via the Notch and JAK/STAT3 signaling pathways. Biology Open. 2016;5:794–800.
- Wu K, Tan XY, Xu YH, et al. JAK and STAT members of yellow catfish Pelteobagrus fulvidraco and their roles in leptin affecting lipid metabolism. Gen Comp Endocrinol. 2016;226:14–26.
- Ding CH, Shi YF, Ru D, et al. Influence of acupuncture on gastrointestinal front-mu points on leptin receptor and JAK-STAT signaling pathway. Acta Univ Tradit Med Sin Pharmacol Shanghai 2017;31:81–84.
- Wang T, Fahrmann JF, Lee H, et al. JAK/STAT3-regulated fatty acid β-oxidation is critical for breast cancer stem cell self-renewal and chemoresistance. Cell Metab. 2018;27:136–150.
- Rogers LJ, Basnakian AG, Orloff MS, et al. 2-Amino-1-methyl-6-phenylimidazo(4,5-b) pyridine (PhIP) induces gene expression changes in JAK/STAT and MAPK pathways related to inflammation, diabetes and cancer. Nutr Metab (Lond). 2016;13:54.
- Yan L, Zhang Z, Song M. Nucleus accumbens microinjection Jak/Stat3 inhibitor regulate energy metabolism of Lasiopodomys brandtii. Sichuan J Zool. 2018;37:57–61.
- Hosoi T, Kohda T, Matsuzaki S, et al. Key role of heat shock protein 90 in leptin-induced STAT3 activation and feeding regulation. Br J Pharmacol. 2016;173:2434–2445.