
Abstract
Cervical cancer is one of the most common gynecological tumors in females. DNA methylation alteration is a type of epigenetic decoration that controls the gene transcriptional regulation and is essential for the pathological progression of cervical cancer to reflect the prognosis and therapeutic sensitivity in clinical practice. Beyond DNA methylation, DNA hydroxymethylation considered as a more stable biomarker draws the outline of the reversible cycle from DNA methylation and demethylation. However, the landscape of 5-hydroxymethylcytosine (5hmC) distributed in the genome is never characterized in cervical cancer. In this study, we presented the whole 5-methylcytosine (5mC) and 5hmC profile in cervical cancer of I-IIa and IIb to IV stages and cervicitis tissues as control by dot plot assay and immunohistochemistry. We observed that the total 5mC was up-regulated while 5hmC was down-regulated in cervical cancer group compared to the control group. Furthermore, we investigated the distribution of 5mC and 5hmC on genomic DNA by MeDIP- and hMeDIP-Seq. 53 differential methylation/hydromethylation regions (DMRs/DHMRs) displayed a continuously increasing or decreasing trend of 5mC or 5hmC from cervicitis to I–IIa and from I–IIa to IIb–IV stages of cervical cancer. Thirty-seven DMRs and DHMRs have a similar variation trend while the other 8 have the opposite trend compared between CSCC and cervicitis. Moreover, the DMR/DHMR associated genes were closely related to Wnt, MAPK, Rap1 and other important signaling pathways. Finally, 5hmC beyond 5mC at the genes such as ACTG1, SALL3, DNAJA3, SERPINB6, CDC14B and CALN1 were considered as the putative novel hallmarks for cervical cancer diagnosis and prognosis. Altogether, this study first describes the DNA hydroxymethylation atlas of cervical cancer and shows a list of novel genes transcriptionally regulated by DNA methylation and hydroxymethylation.
Introduction
Cervical cancer is the second most common gynecological tumors among women worldwide with an estimated 520,000 newly diagnosed cases and 260,000 deaths globally every year, which clearly affected youth trends [Citation1]. Almost all of the cervical cancer cases were HPV-associated, including 70% squamous cell carcinomas and 25% adenocarcinomas [Citation2]. So far, vaccines still face the problems of function limitation and unachieved full-type coverage upon HPV infections. Moreover, only about 15% 5-year survival rate among advanced patients indicates the poor prognosis in the late stages of cancers [Citation3]. Therefore, it cries out for elucidating the underlying molecular mechanisms on to understand the development of cervical cancer.
DNA methylation, the most widely studied epigenetic regulation mainly occurs at CpG loci or islands via transferring a methyl group to cytosines to generate 5-methylcytosine (5mC) by methyltransferase DNMT family. The presence of aberrant DNA methylation including hypo- and hypermethylation in cervical cancer and high-grade cervical intraepithelial neoplasia suggests that most genes are hypermethylated [Citation4]. However, direct removal of the methyl from 5mC is infeasible in terms of the energy consumption for DNA demethylation. Recent studies revealed that 5mC could be further oxidized into 5-hydroxymethylcytosine (5hmC), 5-formylcytosine (5foC), and 5-carboxylcytosine (5caC) by ten-eleven translocation (TET) proteins and finally return to regular cytosine for one manner of DNA demethylation process [Citation5–7]. Thus, 5hmC, a more stable epigenetic mark compared to 5mC, plays a crucial role in methylation recycle maintenance as an intermediate [Citation8].
To date, many studies have attempted to bridge 5mC to the diagnostic and prognostic biomarker of cervical cancer [Citation9–12]. Nevertheless, the 5hmC pattern in cervical cancer is less investigated. Only both studies reported that the overall 5hmC level is decreased in cervical squamous cell carcinoma tissues [Citation13,Citation14]. However, current research progress only reflects the global level of 5hmC by immunostaining or high-performance liquid chromatography, but never figures out the 5hmC pattern on the genetic loci from the genome-wide level. Herein, we first describe the DNA hydroxymethylation atlas in different stages of human cervical cancer tissues using genomic high-throughput sequencing. Our data determines that 5hmC in some genes displays a more sensitive and specific characteristic for evaluating the malignancy of cervical cancer compared to the levels of transcription or 5mC.
Materials and methods
Patients and tissues
The tissue specimens from three cervicitis and twelve cervical squamous cell carcinoma (CSCC) patients were selected from the medical records of the Department of Gynecology of Yuhuangding Hospital from January to July 2017. Six tumor specimens were surgically excised from the patients with I–IIa stage, while four cervicitis and the other six tumor specimens with IIb–IV were harvested by cervical biopsy. Tumor stage was evaluated according to the FIGO staging standards [Citation15]. The age of the patients was 38.4 ± 4.82 years for cervicitis and 42.6 ± 7.15 years for CSCC. None of the patients in this study received chemotherapy or radiotherapy before surgery. All the patients understood and signed the informed consent. Signed informed consent and ethics committee documents of Ethics Committee of The Affiliated Yantai Yuhuangding Hospital of Qingdao University were all provided to approve this study.
Dot blot assay
Dot blot assay was performed as previously described [Citation16]. In brief, the patients’ cervicitis or CSCC tissues were extracted by genomic DNA using QIAquick Gel Extraction Kit (Qiagen, Dusseldorf, Germany). After quantifying and diluting the equal DNA concentration, each sample (2 μl) was dropped on nitrocellulose (NC) membranes with double proportion dilution (0, 5, 10, 20 and 40 ng) for dot blot assay. NC membranes were naturally dried at room temperature (RT) and incubated with 5hmC (1:500 dilution, Abcam, ab106918, Cambridge, UK) or 5mC antibodies (1:500 dilution, Abcam, ab10805) in TBST 4 °C overnight, followed by washing by TBST three times for 10 min in room temperature. followed by appropriate secondary antibodies (1:5000 dilution, Beyotime, Shanghai, China) in 10 ml of TBST for 1 h at room temperature with gentle shaking and washed again for three times and washed again for three times. Finally, the spots on NC membranes were developed with 3 ml of DAB substrate/chromogen for 5 min in darkness and analyzed the gray values.
Immunohistochemical (IHC) analysis
Tissues were embedded in paraffin and cut into sections with 5 μm. After deparaffinization, antigen retrieval was conducted within 10 mmol/l citrate buffer (pH 6.0). After blocking with 5% horse serum albumin (Beyotime, China) at 37 °C for 30 min, the sections were washed by PBS and incubated with a rabbit anti-human 5-hmC monoclonal antibody (1:2000 dilution, Abcam) or a mouse anti-human 5-mC monoclonal antibody (1:2000 dilution, Abcam) at 4 °C overnight. After washing, samples were incubated with secondary anti-rabbit or anti-mouse antibodies (1:5000 dilution, Beyotime) in room temperature for 30 min. Sections were washed and incubated with freshly prepared DAB substrate/chromogen (Beyotime) mixture for 5 min and washed again. The sections were counterstained, dehydrated and mount prepared. The positive staining of each specimen was the mean value of the scores. Specimens were scored according to the intensity of the dye color and the number of positive cells. The intensity of the dye color was graded as 0 (no color), 1 (light yellow), 2 (light brown) or 3 (brown), as well as the number of positive cells, was graded as 0 (<5%), 1 (5–25%), 2 (26–50%), 3 (51–75%) or 4 (>75%). Both of these two indices were assessed together to assign the specimens as four categories: 0–1 (-), 2 (+), 3–4 (++) or 5 (+++). 0–2 and 3–5 were considered as low and high expression respectively.
Methylated and hydroxymethylated DNA immunoprecipitation (MeDIP/hMeDIP) assay
Briefly, genomic DNA from the tissues of two cervicitis and four CSCC (two I–IIa and two IIb–IV) were extracted and sonicated to generate DNA fragments less than 500 bp. Illumina barcode adapters (AmpliSeq Library PLUS, Illumina, San Diego, CA, USA) were ligated before MeDIP and hMeDIP. Approximately, 4 mg of adaptor-ligated gDNA from the CSCC and control samples were pooled together in one tube. DNA libraries were denatured and diluted (5% used as input). The denatured DNA was gently shaken with the antibodies of 1 μg 5mC or 5hmC antibodies at 4 °C overnight and captured by protein A/G beads (Thermo, Waltham, MA, USA). The hMeDIP and MeDIP products were purified and sequenced followed by standard Illumina protocols.
DNA libraries were sequenced on an Illumina Nextseq500 platform. The raw sequence reads of input, MeDIP and hMeDIP were trimmed adaptors and filter out low-quality reads using Cutadapt (v1.9.1) and Trimmomatic (v0.35) [Citation17], and checked the quality of clean reads using Fastqc [Citation18]. Next, clean reads were mapped to the human genome (assembly hg38) using the Bowtie 2 (v2.2.6) algorithm [Citation19]. The process of 5hmC and 5mC peak calling (p<.01) were performed by MACS 2 (v2.1.1) [Citation20] and analyzed the different binding domains based on FDR value less than 0.05 and annotated by DiffBind [Citation21]. The peaks on certain genomic loci were visualized by Integrative Genomics Viewer (IGV).
MeDIP and hMeDIP sequencing data were deposited to ArrayExpress assigned with the accession number E-MTAB-7810.
Statistical analysis
The experimental data were processed with SPSS 20 software (IBM, Armonk, NY, USA). One-way ANOVA was used for comparison of the difference among groups. Spearman rank correlation test was used to evaluate the relationship between 5mC/5hmC and tumor malignancy. p Values less than .05 was considered as statistical significance.
Results
The overall pattern of 5mC and 5hmC in cervical cancer tissues
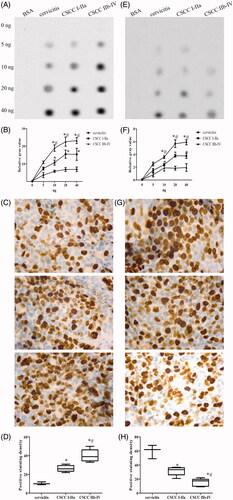
Initially, the contents of 5mC and 5hmC were investigated in twelve human CSCC (six I–IIa and six IIb–IV) and three normal tissues of cervicitis as a control group. Dot blot and IHC were employed to detect the whole DNA methylation and hydroxymethylation levels. We observed that the total 5mC was up-regulated () while 5hmC was down-regulated () with the increased malignancy of cervical cancer group compared to control group. Furthermore, we also found that 5mC (r = 0.648, p < .05) and 5hmC (r = −0.717, p < .05) levels were significantly correlated with the tumor stages analyzed by Spearman rank test. Altogether, our results presented the aberrant overall DNA methylation and hydroxymethylation levels in cervical cancers.
Figure 1. The overall levels of 5mC/5hmC in CSCC. The dot plot (A) and IHC staining (C) with the corresponding statistical analysis (B, D) of 5mC in CSCC. The dot plot (E) and IHC staining (G) with the corresponding statistical analysis (F, H) of 5hmC in CSCC. Experiments were performed in triplicates. “*” represents the comparison between I-IIa group of CSCC and cervicitis with p values less than 0.05. “#” represents the comparison between IIb and IV group of cervicitis and control with p values less than .05.
The global genomic distribution of 5mC and 5hmC in cervical cancer tissues
Next, genomic DNA from four CSCC tissues of two I–IIa and two IIb–IV stage as well as two cervicitis were isolated and conducted 5mC and 5hmC immunoprecipitation approach combined with deep sequencing to map genome-wide 5mC and 5hmC profiles in cervical cancers. Approximately, 29.6 M reads of 5mC and 28.8 M reads of 5hmC sequencing data were collected, respectively (). To compare the individuals in cervical cancer and control groups, 5mC and 5hmC densities were normalized. Also, MA plot for a genome-wide comparison of 5mC/5hmC levels between IIb and IV stage CSCC and cervicitis groups displayed that most of the scatter plots are symmetrically distributed at the two sides of the 0 axis, which means that 5mC/5hmC sites were similar between the groups. Thus, no significant genome-wide differences in the 5mC/5hmC densities between the CSCC and cervicitis groups were observed (). After calling peaks by MACS software (p < .01), we mapped the (h)MeDIP-seq signals of 5mC and 5hmC peaks according to their genomic location and we did observe that 5mC was highly enriched at gene body and TES more than promoter regions (), while 5hmC was majorly enriched at the promoter and TSS regions (). The variation trend of the 5mC/5hmC levels had no significant difference among the three groups.
Figure 2. The genomic distribution of 5mC/5hmC in CSCC. The MA plot of IIb–IV group of CSCC and cervicitis contrast of 5mC (A) and 5hmC (B) peaks normalized with tag density. The X axis indicates the normalized mean and the Y axis indicates the log2-fold change. The red pixels mean the differential peaks with FDR less than 0.05. The blue pixels mean the peaks with no significant difference. The genome-wide mapping of 5mC (C) and 5hmC (D) in cervicitis and different stages of CSCC. Normalized DMRs and DHMRs tag density distribution across the gene body. Each gene body was normalized to 0–100%. Normalized Tag density is plotted from 20% of upstream of transcription start sites (TSS) and 20% of downstream of transcription terminal sites (TTS). -3 kb to TSS and +3 kb to TTS is shown.
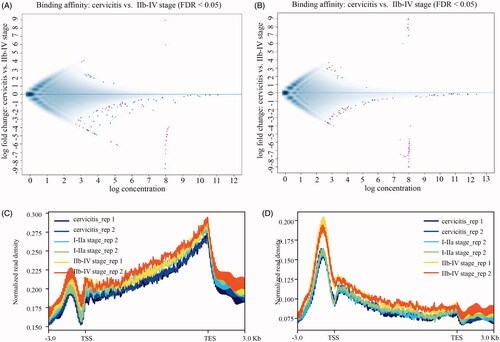
Table 1. The summary of MeDIP and hMeDIP-seq data.
Furthermore, the screening condition of significantly different enrichment of 5mC or 5hmC was set to meet the following requirements: cervicitis > I–IIa > IIb–IV or cervicitis < I–IIa < IIb–IV stages of CSCC in order with FDR < 0.05. We identified 53 differential peaks of 5mC and 5hmC among these samples, total of 9 down-regulated and 42 up-regulated differential methylation regions (DMRs) as well as 5 down-regulated and 42 up-regulated differential hydroxymethylation regions (DHMRs) (log2FC >1 or < -1 and FDR < 0.05) were observed in cervical cancer tissues compared to controls (). Thirty-seven DMRs and DHMRs have a similar variation trend while 8 have the opposite trend compared between CSCC and cervicitis (). The genomic distribution of these DMRs and DHMRs showed that 80% around domains were enrolled in 48 RefSeq genes, in which 31 genes only contained differential enrichment of 5mC at promoter regions (-2k to +2k of TSSs), 9 genes only included showed differential enrichment of 5mC at gene bodies and UTR regions as well as 8 genes had differential 5mC at both of these regions. Also, the rest 20% DMRs and DHMRs were associated with intergenic regions. (). In addition, gene ontology (GO) analysis showed to be closely related to Wnt signaling pathway, as well as hormone secretion and cell junction in the differential 5mC associated genes, while it is closely related to ERK/MAPK pathway in the differential 5hmC associated genes (). KEGG pathway enrichment analysis revealed that multiple important pathways were enriched, including Wnt pathway, ubiquitin-mediated proteolysis, necroptosis and cervical cancer in 5mC differential genes, while Rap1 pathway, cell junction and cytoskeleton in 5hmC differentia genes (). Altogether, we comprehensively analyzed the (h)MeDIP-seq data and determined the specific differential methylated and hydroxymethylated loci of cervical cancer.
Figure 3. The associated functions of DMR/DHMRs in CSCC. The count of selected DMRs/DHMRs with the similar or opposite variation trend of 5mC/5hmC compared among cervicitis, I–IIa and IIb–IV of CSCC (A). Upper and down arrow mean the up- and down-regulated 5mC compared among cervicitis, I–IIa and IIb–IV of CSCC. Left and right arrow mean the up- and down-regulated 5hmC compared among cervicitis, I–IIa and IIb–IV of CSCC. “-” means no variation of 5mC/5hmC among these three groups. The distribution of the selected DMRs/DHMRs in genomic regions (B). GO (C) and KEGG (D) analysis of the genes associated with DMRs/DHMRs.
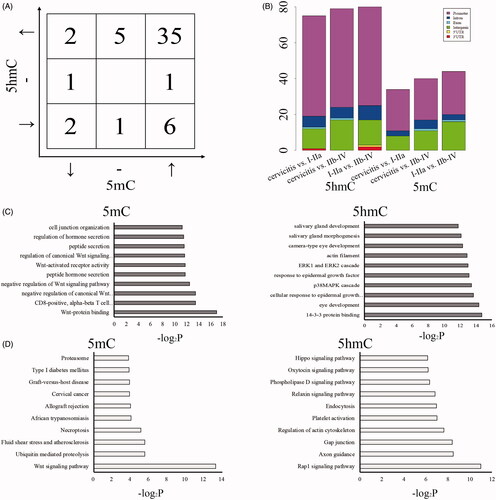
Table 2. The annotation of RefSeq genes associated with DMRs/DHMRs.
Verification of the novel hydroxymethylated markers of cervical cancers
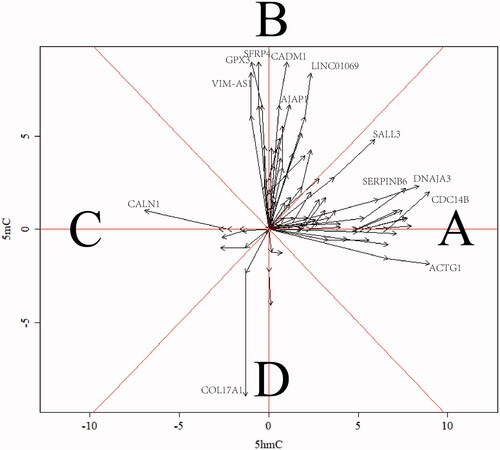
Finally, to find some novel potential biomarkers for cervical cancer diagnosis or prognosis, we drew the “vector picture” to clarify the sensitivity of variation trend of 5mC/5hmC (). The 5mC (Y-axis) and 5hmC (X-axis) levels of the differential DMRs and DHMRs in three groups of cervicitis, I–IIa and IIb–IV of CSCC were documented, respectively (all the values of cervicitis were normalized as the original point). These three points of each gene were linked with the orientation from cervicitis to I–IIa to IIb–IV of CSCC. Here, two parameters could be described as biological meanings. One was the slopes of each vector between cervicitis to I–IIa or I–IIa to IIb–IV, which indicated the differential speed of variation between 5mC and 5hmC and the area A and C suggested the faster change of 5hmC while area B and D suggested the faster change of 5mC in the malignancy of CSCC. Also, the other was the length of each vector, which indicated the differential amplitude of variation, namely, the detectability of 5mC and 5hmC in cervical cancer. Here, we observed the DHMRs with a sensitively increasing 5hmC enrichment in ACTG1, SALL3, DNAJA3, SERPINB6 and CDC14B as well as a sensitively decreasing 5hmC enrichment in CALN1 compared to 5mC in cervical cancer. Likewise, VIM-AS1, LINC01069, CADM1, GPX3, SFRP4, AJAP1 and COL17A1 had the sensitive change of 5mC in CSCC. These results above suggested a list of potential hallmarks for CSCC diagnosis and prognosis.
Figure 4. Vector picture for clarification of the sensitivity of variation trend of 5mC/5hmC. The area of A and C mean the associated genes with 5hmC sensitive change while area B and D mean the associated genes with 5mC sensitive change in the malignancy of CSCC. The X/Y axis indicates the normalized log2-fold change of 5mC/5hmC.
Discussion
DNA methylation as a well-studied epigenetic hallmark has been determined to play a crucial role in cancers and other human diseases. In general, the presence of aberrant DNA hypermethylation is observed to cause the abnormal chromosome activity and gene silencing in most of the cancers [Citation22]. As we know, DNA methyltransferases (DNMTs) contribute to the hypermethylation via the transfer of the methyl groups on the cytosines. Thus, DNMT inhibitors such as decitabine or azacytidine have been applied or combined with other drugs for the treatment of solid cancers [Citation23]. Nevertheless, the persistently accumulated hypermethylation status of cancers also implies the other side that the process of DNA demethylation is blocking. For DNA demethylation, passive demethylation reduces the global 5mC level via suppression of DNA methylation information inheritance in daughter cells, while the active demethylation happens in situ to restore the 5mC to regular cytosine. It is widely acknowledged that 5mC is oxidized to 5hmC, 5foC and 5caC step by step and finally is decarboxylated to regular cytosine by thymine-DNA glycosylase (TDG). Here, we determine that the global 5mC is up-regulated while 5hmC was down-regulated (), and 5hmC is negatively correlated with the malignancy of cervical cancer, which indicates that the active DNA demethylation is restrained in cervical cancer. We speculate that the active demethylation process is terminated and hydroxymethylation is blocked so that the overall hypermethylated DNA is abnormally accumulated in cervical cancer.
Since the overall 5mC/5hmC levels are investigated by dot plot and IHC, the genomic distribution of 5mC/5hmC are further addressed by (h)MeDIP. In general, 5mC are well studied in promoter regions for gene regulation, but our results show the pattern of the hypermethylated CpG loci or islands in gene body or UTR more than the promoter (). However, the hydroxymethylated CpG sites are majorly located at the promoter ( and ), which suggests that most of the hydroxymethylation active zone for the occurrence and function of 5hmC are the gene promoter regions. Also, we find a significant difference of 5hmC levels at promoters rather than other regions in IIb–IV stage of CSCC compared to I–IIa (p=.037) and control (p=.012), but no difference of 5mC among three groups (). Moreover, we notice that most of the DMRs/DHMRs have a variation trend in the genetic regions (). Nevertheless, the up-regulated 5mC and down-regulated 5hmC are observed in CSCC using dot plot and IHC, which seems paradoxical with the presence of genetic distribution variation of 5mC and 5hmC. We speculate that 5hmC is supposed to be reduced in intergenic regions more than the elevation in genetic regions. Previous studies suggest that 5hmC enriches in intergenic regions besides introns and exons [Citation24,Citation25] in other disease models, which indicates that the regulatory way of 5hmC in non-genetic regions is different and may play a complicated role in gene regulation compared to DHMRs at the genetic regions. Consistently, the associated signaling pathways and biological functions related to DMRs and DHMRs are also different. DMRs enriches in the genes closely associated with Wnt signaling pathway () while DHMRs may control ERK/MAPK, Rap1 and Hippo pathways (), which also implies the different roles of 5mC and 5hmC for gene regulation in CSCC.
Finally, we find that the 5hmC at the genes of ACTG1, SALL3, DNAJA3, SERPINB6, CDC14B and CALN1 are sensitive and specific to CSCC malignancy (), which may provide a batch of novel 5hmC biomarkers for cervical cancer diagnosis. The epigenetic hallmarks such as DNA methylation/hydroxymethylation can usually reflect the earlier pathological events in cells compared to the transcriptome when diseases happen. In our case, plenty of regions with stable hypermethylation among the three groups are difficult to understand the actual reason, permanent hypermethylation with no change or the suppressive hydroxymethylation mediated hypermethylation. Thus, 5hmC of hallmarks can improve this issue. Secondly, CpG loci with 5hmC modification are extremely rare in genome compared to 5mC and can be accurately detected for evaluating cancer status. Altogether, our study describes the genomic landscape of 5hmC in cervical cancer and provides the significant 5hmC biomarkers of CSCC.
Authors’ contributions
J.W. and Y.S. performed the experiments and analyzed the data; Y.T. and Y.D. helped perform the experiments; X.W. designed the overall study and drafted the manuscript.
Disclosure statement
The authors declare no competing financial interests exist.
Related Research Data
References
- Plummer M, de Martel C, Vignat J, et al. Global burden of cancers attributable to infections in 2012: a synthetic analysis. The Lancet Global Health.2016; 4:e609–16.
- Cutts FT, Franceschi S, Goldie S, et al. Human papillomavirus and HPV vaccines: a review. Bull World Health Organ. 2007;85:719–726.
- Zhao YB, Wang JH, Chen XX, et al. Values of three different preoperative regimens in comprehensive treatment for young patients with stage Ib2 cervical cancer. Asian Pacific Journal of Cancer Prevention: APJCP.2012; 13:1487–1489.
- Feng C, Dong J, Chang W, et al. The progress of methylation regulation in gene expression of cervical cancer. .2018;2018:1.
- Koh KP, Yabuuchi A, Rao S, et al. Tet1 and Tet2 regulate 5-hydroxymethylcytosine production and cell lineage specification in mouse embryonic stem cells. Cell Stem Cell. 2011;8:200–213.
- Zhang H, Zhang X, Clark E, et al. TET1 is a DNA-binding protein that modulates DNA methylation and gene transcription via hydroxylation of 5-methylcytosine. Cell Res. 2010;20:1390–1393.
- Wu SC, Zhang Y. Active DNA demethylation: many roads lead to Rome. Nat Rev Mol Cell Biol. 2010;11:607–620.
- Kantidze OL, Razin SV. 5-hydroxymethylcytosine in DNA repair: a new player or a red herring? Cell Cycle. 2017;16:1499–1501.
- Li X, Cai Y. Methylation-based classification of cervical squamous cell carcinoma into two new subclasses differing in immune-related gene expression. IJMS. 2018;19:3607.
- Yuan LY, Qin X, Li L, et al. The transcriptome profiles and methylation status revealed the potential cancer-related lncRNAs in patients with cervical cancer. J Cell Physiol. 2018;234:9756–9763.
- van Leeuwen RW, Ostrbenk A, Poljak M, et al. DNA methylation markers as a triage test for identification of cervical lesions in a high risk human papillomavirus positive screening cohort. Int J Cancer. 2018;144:746–754.
- Rogeri CD, Silveira HCS, Causin RL, et al. Methylation of the hsa-miR-124, SOX1, TERT, and LMX1A genes as biomarkers for precursor lesions in cervical cancer. Gynecologic Oncology.2018;150:545–551.
- Zhang LY, Han CS, Li PL, et al. 5-Hydroxymethylcytosine expression is associated with poor survival in cervical squamous cell carcinoma. Jpn J Clin Oncol. 2016;46:427–434.
- Bhat S, Kabekkodu SP, Varghese VK, et al. Aberrant gene-specific DNA methylation signature analysis in cervical cancer. Tumour Biol. 2017;39:1010428317694573.
- Pecorelli S. Revised FIGO staging for carcinoma of the vulva, cervix, and endometrium. Int J Gynaecol Obstet. 2009;105:103–104.
- Zhong J, Wei X. Characterization of DNA hydroxymethylation in hypothalamus of elderly mice with postoperative cognitive dysfunction. bioRxiv 2018;488007.
- Bolger AM, Lohse M, Usadel B. Trimmomatic: a flexible trimmer for Illumina sequence data. Bioinformatics. 2014;30:2114–2120.
- Andrews S. FastQC a quality control tool for high throughput sequence data. 2013.
- Langmead B, Salzberg SL. Fast gapped-read alignment with Bowtie 2. Nat Methods. 2012;9:3579.
- Zhang Y, Liu T, Meyer CA, et al. Model-based analysis of ChIP-Seq (MACS). Genome Biol. 2008;9:R137.
- Ross-Innes CS, Stark R, Teschendorff AE, et al. Differential oestrogen receptor binding is associated with clinical outcome in breast cancer. Nature. 2012;481:389–393.
- Zhou S, Shen Y, Zheng M, et al. DNA methylation of METTL7A gene body regulates its transcriptional level in thyroid cancer. Oncotarget. 2017;8:34652–34660.
- Liu N, Zhao R, Ma Y, et al. The development of epigenetics and related inhibitors for targeted drug design in cancer therapy. CTMC. 2018;18:2380–2394
- Shu L, Sun W, Li L, et al. Genome-wide alteration of 5-hydroxymenthylcytosine in a mouse model of Alzheimer's disease. BMC Genomics. 2016;17:381.
- Cheng Y, Li Z, Manupipatpong S, et al. 5-Hydroxymethylcytosine alterations in the human postmortem brains of autism spectrum disorder. Hum Mol Genet. 2018;27:2955–2964.