
Abstract
Cervical cancer is one of the most fatal malignancies in females. Acquired resistance to chemotherapeutic agent is one reason behind this lethality. In this study, we developed cisplatin resistance cell line, subsequently examined the molecular mechanisms linked. Transcriptome sequencing technology was utilized to compare the various expression models between the cisplatin-resistant cell line (Hela/DDP) and its parental cell line human cervical adenocarcinoma Hela. The present study has identified 2,312 differentially expressed genes (DEGs). Results showed there were 1,437 up-regulated genes and 875 down-regulated ones. Databases analysis including Gene ontology (GO), Cluster of Orthologous Groups of proteins (COG) and Kyoto Encyclopedia of Genes and Genomes (KEGG) pathway were performed to reveal potential molecular mechanisms. We studied AKT3, a crucial gene in the PI3K/AKT pathway which clustered the most DEGs. Silencing AKT3 in Hela/DDP could enhance its sensibility to cisplatin. Quantitative real-time reverse transcription PCR (qRT-PCR) and western blot experiments were showed that expression of AKT3 was decreased after siRNA interference and inhibitor treatment. CCK-8 experiments showed that low expression of Akt3/pAkt enhanced the sensitivity of drug-resistant cells to cisplatin. Apoptotic analysis demonstrated that inhibition of AKT3 increased the rate of Hela/DDP apoptosis. Our results suggest a novel mechanism by which upregulated expression of AKT3 in cervical cancer may lead to resistance to cisplatin.
Introduction
The incidence of cervical cancer ranks third among female malignant tumours, and its mortality rate ranks second. Therefore, it seriously harms women's health. For 2017, the estimated new cancer cases are 12,820, and deaths of uterine are 4,210 in America. Cervical cancer mortality increased by nearly 3% annually between 2010 and 2014 [Citation1]. Cisplatin is a first-line chemotherapy for the treatment of various solid tumours. This agent remains as the cornerstone in the systemic antineoplastic management of the malignancy. Combing cisplatin with paclitaxel is one of most commonly utilized regimens in the recurrent or metastatic disease setting [Citation2] although cisplatin acts with tumours to induce apoptosis. However, in actual clinical treatment, tumour cells will develop resistance. Studies have shown that patients with recurrent or metastatic swelling have a relatively poor prognosis, and their 1-year survival rate is only 15–20% [Citation3]. Resistance mechanism of cisplatin in tumours are multifactorial according to research studies, including drug metabolism: abnormal expression of transporters, cell detoxification mechanism: enhanced intracellular detoxification, gene level: increased the capacity of DNA repair and increase the ability to inhibit apoptosis. The above are the most significant recognized mechanisms [Citation4]. However, the molecular mechanism of how cisplatin resistance develops involved in cervical cancer need further study. Therefore, it is tremendously significant to clarify the potential molecular mechanism underlying resistance of cisplatin in cervical cancer cells.
PI3K/AKT signalling pathway involves several biological processes with cellular survival and apoptosis, tumour development as well as progression [Citation5,Citation6]. Activation of PI3K/AKT signalling pathway has been found in many various kinds of cancer. Moreover, it confers resistance to various cancer therapies [Citation7]. Akt, a kind of serine/threonine kinase which acts downstream of PI3K, which is well-known as a critical factor in PI3K/AKT signalling [Citation8], also recognized as another name: protein kinase B (PKB). It comprises three highly homologous isoforms: AKT1 (PKBα), AKT2 (PKBβ) and AKT3 (PKBγ). It acts pivotal parts in cellular survival and apoptosis [Citation9]. Acquired anti-tumour drug resistance cells of tumour tend to increase Akt activation. Past studies have shown that AKT overexpression regulates drug resistance in cancer cells during chemotherapy [Citation10]. AKT activity has been recognized as a factor associated with drug resistance closely in other type of cancer. For example, in breast cancer cells there was an activated AKT1 expression in drug resistance cells [Citation11]. AKT3 is one of the most pivotal members of AKT family; it is contributed to the process of proliferation, tumorigenesis, cellular differentiation, and apoptosis [Citation12–17]. AKT3 is also associated with chemoresistance of cancer cells [Citation18,Citation19]. Research study suggested that knockdown of AKT3 increases migration along with sensibility of breast cancer cells to cisplatin [Citation20]. Besides, AKT3 knockdown also induces mitochondrial dysfunction in A549 lung cancer cells [Citation21] However, the relationship between up-regulation of AKT3 expression in cervical cancer cells and its resistance of cisplatin need further research.
Next-generation sequencing (NGS) or high throughput sequencing technologies and parallel genomic sequencing facilities are utilized in a number of parts of cancer research [Citation22]. Previously, NGS has been reported to study the genetic regulation of cancer development, drug resistance and prognosis of cervical cancer research [Citation23]. Since RNA-Seq offers virtually unlimited possibilities in modern bioanalysis [Citation24], we used this technique to study the difference in gene expression levels between Hela/DDP Hela. The aim of our study was to figure out the mechanism underlying cisplatin resistance in cervical cancer. Results showed that AKT3 fromPI3K/AKT signalling pathway was up-regulated in the cisplatin resistant cell line Hela/DDP. With this found, we take AKT3 as a target gene involves the process of how resistance of cisplatin occurs. Furthermore, our work suggested that both inhibition of AKT3 and knockdown it contributes to Hela/DDP cells increase the sensitivity to cisplatin by inducing cellular apoptosis and reducing prefoliation. Tumour resistance to cisplatin is one of the causes of chemotherapy failure. Exploring the molecular mechanism of drug resistance is an important part of overcoming tumour resistance and will provide a theoretical basis for reversing tumour resistance and improving the efficacy of cancer chemotherapy. Research findings have confirmed that the PI3K/AKT signalling pathway is aberrantly activated in many solid tumours, especially in chemotherapy-resistant cells. Therefore, it is necessary to further explore the relationship between PI3K/AKT signalling pathway and chemoresistance from a new perspective.
Materials and methods
Cell culture
Human cervical squamous carcinoma cell line Hela was obtained from the American Type Culture Collection (ATCC, Rockville, MD, USA) and cultured in Dulbecco’s Modified Eagle Medium (DMEM) (Hyclone) supplemented with 10% FBS (Gibco) and antibiotics (Gibco). Hela cells were cultured in a couple of increasing concentrations of cisplatin (Sigma) for over 6 months to establish cisplatin-resistant cervical cancer cell lines, Hela/DDP. All cells were maintained at 37 °C in a humidified 5% CO2 atmosphere.
Cytotoxicity assay
Assessment of cell viability was carried out using CCK-8 assay. An adherence of Hela and Hela/DDP cells (1 × 10⁵ cells/well) was seeded into 96-well plate followed by incubating for 24 h. The cells were treated with 100 μL of media containing DDP of different concentrations, which were 0, 0.2, 0.39, 0.78, 1.56, 3.13, 6.25, 12.5, 25, 50, 100 μg/mL and further incubated for 48 h. Then, wells were replaced with 100 μL media which containing 0.5 mg/mL CCK-8 and incubated at 37 °C for additional 4 h. Absorbance at 450 nm was measured using a microplate reader. The inhibition rate for cell growth was calculated according to the following formula: inhibition rate (%) = (1−mean absorbance of treatment group/mean absorbance of untreated group) × 100%.
Transcriptome sequencing
RNA degradation and contamination were checked on 1% agarose gels. RNA purity was tested using the NanoPhotometer spectrophotometer (IMPLEN, CA, USA). RNA concentration was measured using Qubit RNA Assay Kit in Qubit 2.0 Flurometer (Life Technologies, CA, USA). RNA integrity was measured utilizing the RNA Nano 6000 Assay Kit of the Agilent Bioanalyzer 2100 system (Agilent Technologies, CA, USA). For RNA sample preparation, a total quantity of 1 μg RNA per sample was used as input material. Sequencing libraries were produced using NEBNext UltraTM RNA Library Prep Kit for Illumina (NEB, USA) based on the instructions from manufacturer. In brief, mRNA was purified from total RNA using poly-T oligo-attached magnetic beads. Fragmentation was carried out using divalent cations under elevated temperature in NEBNext First Strand Synthesis Reaction Buffer (5X). We used AMPure XP system (Beckman Coulter, Beverly, USA) to select cDNA fragments of especially 200–250 bp in length. Then, 3 μl USER Enzyme (NEB, USA) was utilized with size-selected, adaptor-ligated cDNA at 37 °C for 15 min followed by 5 min at 95 °C before PCR. PCR was performed with Phusion High-Fidelity DNA polymerase, Universal PCR primers and Index (X) Primer. Finally, PCR products were purified using AMPure XP system and library quality was assessed on the Agilent Bioanalyzer 2100 system.
The clustering of the index-coded samples was performed on a cBot Cluster Generation System using TruSeq PE Cluster Kit v4-cBot-HS (Illumia) according to the manufacturer’s recommendations. After cluster generation, the library preparations were sequenced on an Illumina Hiseq 2500 platform and paired-end reads were generated.
Differential expression analysis
Differential expression analysis of two conditions/groups was performed using the DESeq R package (1.10.1). p Values were adjusted using the Benjamini and Hochberg’s approach for controlling the false discovery rate.
p Values were adjusted using p Value < .005 and |log2 (fold change) | ≥1 was set as the threshold for significantly differential expression.
Gene functional annotation
Gene function was annotated based on the following databases: Nr (NCBI non-redundant protein sequences);Nt (NCBI non-redundant nucleotide sequences);Pfam (Protein family);KOG/COG (Clusters of Orthologous Groups of proteins);Swiss-Prot (A manually annotated and reviewed protein sequence database);KO (KEGG Ortholog database);GO (Gene Ontology).
RNA isolation, reverse transcription and qRT-PCR
Total RNA was extracted from cells using Trizol Reagent (Life Technologies). To detect different the relatively mRNA expression of 14 randomly chosen different expressive genes which were found after RNA sequencing, cDNA was synthesized using the Prime-Script RT reagent Kit (TaKaRa, Dalian, China). Quantitative reverse transcription-polymerase chain reaction (qRT-PCR) was carried out by utilizing SYBR Premix ExTaq (TaKaRa) with the ABI ViiA 7 Real Time PCR System (Thermo Lifetech). The relative expression of these 14 different expressive genes was quantified with the 2−ΔΔCT method. The mRNA level of tested genes was normalized to the level of ACTB, and was calculated by the 2−ΔΔCT method. PCR reactions for each gene were performed three times. Primers were used in qPCR reaction are presented in .
Table 1. Primer sequences used for qRT-PCR.
siRNA synthesis and cell transfection assays
Three human siRNAs (GenePharma, Shanghai, China) designed against AKT3 (GenBank NM_181690). There was one negative random siRNA, one negative control FAM siRNA and one GAPDH positive control siRNA (GenePharma, Shanghai, China). The sequences for AKT3-siRNAs and control siRNA are presented in .
Table 2. Sequences of AKT3-siRNAs.
The cells were first divided into seven groups, the mock group with only the transfection reagent, the negative control group added with a non-targeting control siRNA or the transfection reagent, and the other three groups supplemented with different AKT3 siRNA and the transfection reagents. Cells were seeded on 6-well plates (5 × 10⁵ cells for Hela/DDP) and were allowed to attach for 24 h, and then treated with 100 pmol siRNA per well. Using equimolar amounts of siRNAs were and Lipofectamine 2000 Transfection Reagent from Invitrogen (Madison, WI, United States). Transfected cells were grown at 37 °C for 6 h, followed by incubation with complete medium. Cells were maintained for 24 h for further experiments
Western blot
Total protein extracted from cell lines were parted by 12% sodium dodecyl sulfate gel electrophoresis (20 mg per lane) and transferred onto a nitrocellulose membrane by electroblotting in transfer buffer for 150 min at 120 V. To prevent non-specific binding of antibodies by blocking with 5% skim milk the membrane was incubated with primary antibodies that specific for Akt3 (Santa Cruz Biotechnology Inc, USA), and GAPDH (Santa Cruz Biotechnology Inc, USA) at 1:1,000 dilution in TBS solution at 4 °C overnight. The secondary antibody (CoWin Biosciences, China) at 1:15,000 dilution in skim milk was infrared at room temperature for 2 h. Result bands were visualized using an enhanced chemiluminescent substrate (Thermo Fisher Scientific, Inc., USA).
Cell apoptosis assays
Cells were seeded at a density of 5 × 10⁵ cells/60-mm Petri dish in complete medium for 24 h. Followed by treating with the designated concentrations of cisplatin for 24 h. To assess apoptotic cells, Apoptotic Cells Detection kits were used. Cells were accumulated and resuspended in 500 μl of binding buffer, 5 μl of Annexin V-FITC and 5 μl of PI. Then, they were cultured for 15 min at room temperature. CellQuest software (BD Biosciences) was used to analyze samples by flow cytometer.
Statistical analysis
p Values and false discovery rate (FDR) filtering were used to identify the mRNAs expression was significantly different between Hela and Hela/DDP cell lines. These differentially expressed mRNAs were identified through fold change filtering. Results from qPCR were analyzed using GraphPad Prism 5.
Results
Cisplatin exposure induces drug-resistance in cervical cancer
To study mechanism of cisplatin resistance in cervical cancer, we established in vitro cisplatin-resistance cervical model (Hela/DDP) through stepwise exposure Hela cells to cisplatin. As shown in . Hela/DDP displayed significant resistance to cisplatin treatment. IC50 (the half maximal inhibitory concentration) of Hela/DDP cells (10.66 ± 0.30 μg/mL, p < .05) increased 6.56 times compared to Hela cells (1.625 ± 0.78 μg/mL, p < .05). The resistant cell line displayed the same morphology as its parental cell line.
Figure 1. The inhibition rates of continuously variable concentrations of cisplatin on Hela and Hela/DDP. CCK-8 Assay was performed to do cytotoxicity test. Cell viability analyzed by measuring absorbance at 450 nm using a microplate reader. Data represent the mean ± SD of three individual experiments.
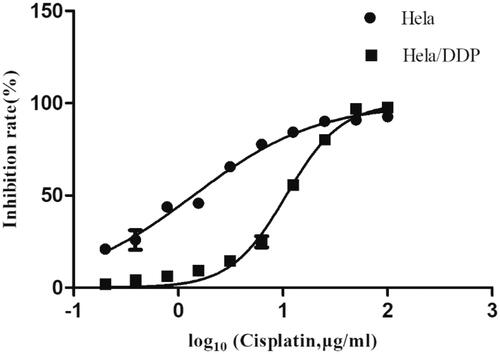
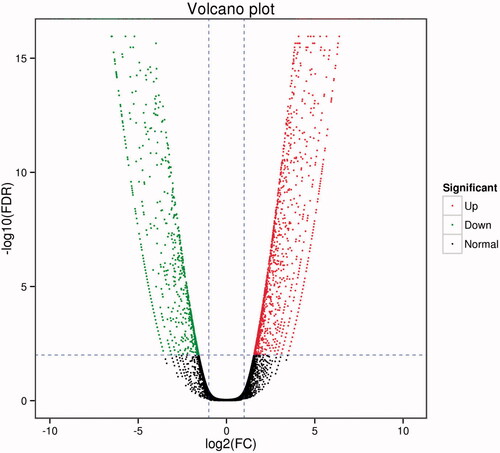
Figure 2. Volcano graphs of all DEG enrichment. Each point in the volcano diagram represents one differentially expressed gene, and the x-axis represents the log 2 (fold change) and the y-axis shows the –log 10 (1 − P). The greater the absolute value of the horizontal coordinate, the greater the difference between the two samples. The larger the ordinate value, the differential expression is more significant, and the differentially expressed gene is more reliable. In the green dots, the differentially expressed gene is down-regulated, and the red dots represent the differentially expressed genes. The black dots represent the non-differentially expressed genes.
Analysis of transcriptome sequencing
After removing reads with adapters, unknown nucleotides, and low-quality reads of sequencing, we acquired a total of 14.54 Gb clean data. As shown in , The Q30 percentage (accuracy rate of base identification > 99.9% and error rate of sequencing < 1‰) was more than 85.07%. Clean reads were mapped to reference through using TopHat2 [Citation25] which based on Bowtie2 [Citation26]. The average mapping ratio with reference genes was 71.51%. lists respective mapping rates of two samples. We normalized the number of Mapped Reads in the samples and the length of the transcript. FPKM (Fragments Per Kilobase of transcript) was an indicator of gene expression. Take Fold Change >2 and FDR < 0.01 as the screening criterion in the process of gene detection, the transcriptome sequencing analysis identified 2,312 differently expressed genes between Hela and Hela/DDP cells, including 1,437 up-regulated genes and 875 down-regulated ones. The volcano plot which illustrated different expression is shown in .
Table 3. Summary of sequencing data.
Table 4. Summary of comparative analysis.
Functional enrichment analysis of DEGs
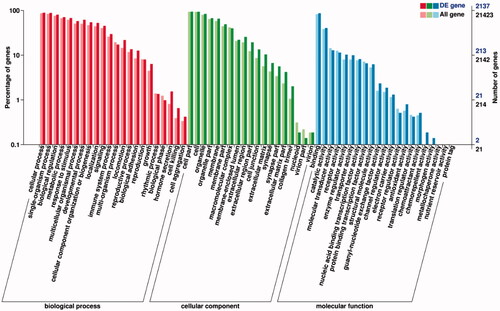
In Gene ontology analysis of DEGs, all of them were categorized into three major categories: biological processes, cellular components and molecular functions. The present study identified that the 2,137 DEGs were classified into 62 functional categories, 22 in biological processes, 21 in molecular functions and 19 in cellular components including reproduction, cellular processes and metabolic processes (p < .05; ).
Figure 3. Functional classification of gene ontology (GO) database on DEGs. The x-axis is the GO classification, the left of the y-axis is the percentage of the number of genes, and the right is the number of DEGs and all genes.
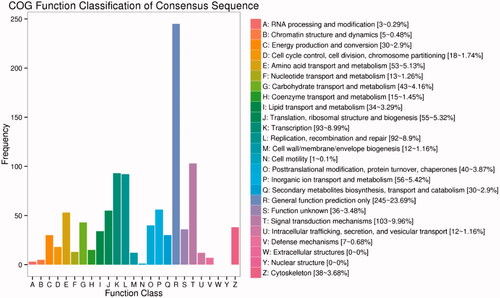
COG (Cluster of Orthologous Groups of proteins) database is a classification system based on orthologous relationships between genes of prokaryotes and eukaryotes. The results of the differential expression genes classified on COG system are shown in .
Figure 4. Functional classification of Cluster of Orthologous Groups of proteins (COG) database on DEGs. The x-axis shows the contents of COG, and the ordinate is the frequency of genes. Different functional classes reflect the corresponding period of genes and metabolism or physiological of environment.
KEGG pathway analysis of DEGs
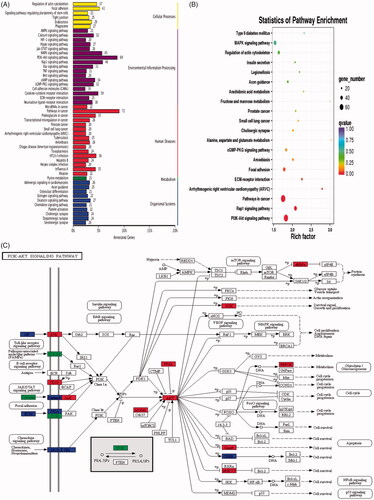
To investigate high-level functions of DEGs between Hela and Hela/DDP cells after transcriptome sequencing, signalling pathway analysis was performed. Totally, 1,344 DEGs were annotated into 277 pathways in the KEGG (Kyoto Encyclopedia of Genes and Genomes) database. The annotation results of gene KEGG were classified according to the pathway types in KEGG, and the top 50 enriched pathways are shown in . Except for pathways in cancer, the top 5 signalling pathways annotated with high numbers of DEGs were: PI3K/AKT signalling pathway, Rap1 signalling pathway, MAPK signalling pathway, Focal adhesion and Cytokine-cytokine receptor interaction. Pathway significance enrichment analysis used pathway in the KEGG database as a unit and applied hypergeometric test to find pathways of significant enrichment in the differential expression genes compared with the whole genome. The result of the statistics of pathway enrichment is shown in , showing 20 pathways with the least significant Q value. The pathway which involves the most DEGs annotation is displayed in .
Figure 5. Kyoto Encyclopaedia of Genes and Genomes (KEGG) database categorized DEGs. (A) KEGG functional annotation on DEGs. The x-axis represents the number of genes annotated to the pathway and the proportion of all genes. The y-axis shows the name of KEGG metabolic pathway. (B) Scatter plot of KEGG pathway enrichment. Each circle point represents a KEGG pathway. The ordinate is log10 (Q value), Q value is the p value after multiple hypothesis tests. Thus, the bigger the enrichment factor, the more significant the enrichment level of DEGs in the pathway. (C) Pathway map of PI3K/AKT. The PI3K-AKT signalling pathway is annotated with most DEGs among all the referred pathways.
Verification of significant DEGs
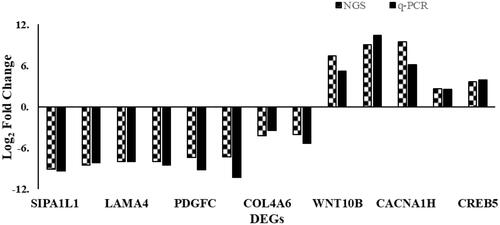
We selected 11 target genes (SIPAIL1, FLNC, LAMA4, CD70, PDGFC, CREB3L1, COL4A6, IL1A, INHBB, CACNA1H, HSP90B1, CREB5) which enriched on the top 5 DEGs-enriched KEGG pathways and verified their relative mRNA expression levels in Hela and Hela/DDP cells using qRT-PCR. Target DEGs are listed in . A evaluation was also performed between results of NGS and qRT-PCR, as shown in .
Table 5. Information of test genes from DEGs.
Figure 6. Differentially expressed genes revealed by deep sequencing validated using quantitative real-time reverse transcription PCR (qRT-PCR). Comparison of the relative expressions obtained using two platforms showed quite correspondence for most pairs. The left columns of every double bars represent the log 2 ratio fold change in each DEG with the application of next-generation sequencing (NGS) and right columns represent log 2 fold changes using qRT-PCR.
AKT3-siRNA and MK-2206 attenuated AKT3 expression
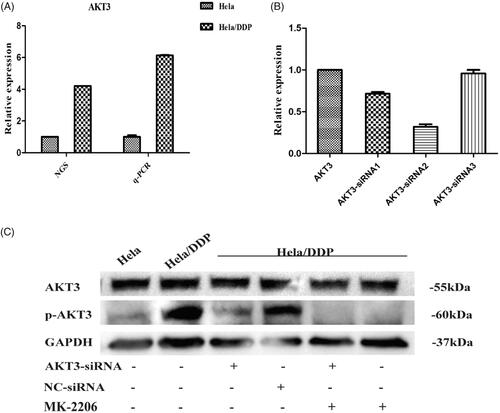
AKT3 has been suggested to be potential target of drug design as it plays a role in tumour migration [Citation27]. To investigate the potential role of AKT3 on drug resistance, and the genes responsible for the significant enrichment in PI3K/AKT signalling pathway, we performed qRT-PCR to assessed its mRNA expression levels in Hela/DDP cells and parental Hela cells. The relative expression of mRNA between transcriptome sequencing and qPCR were highly consistent, as shown in . In order to study whether AKT3 is related with cisplatin resistance in cervical cancer, we down-regulated AKT3 in Hela/DDP through siRNA or inhibitor. The efficiency of AKT3-siRNA was examined using real-time PCR and western blot. We demonstrated a decrease in AKT3 mRNA in Hela/DDP cells treated with AKT3-siRNAs at 24 h after transfection, respectively (28.38%, 68.22% and 4.17% decrease) (). Furthermore, AKT3-siRNA2 was used for high transfection rate. To test variation in the protein level, we also measured the activation of Akt using western blot. The result showed that Hela/DDP cells had a high level of phosphorylated Akt (p-Akt) while additional administration of AKT3-siRNA, MK-2206 significantly suppressed pAkt of Hela/DDP cells compared with control (). The data suggested that PI3K/AKT signalling pathway were activated in Hela/DDP cells.
Figure 7. mRNA and protein level alteration after treating with AKT3-siRNA or inhibitor. (A) qRT-PCR was performed for AKT3. The expression level of it was normalized to the level in Hela cells. Hela/DDP cells were treated with AKT3-siRNA, Nonsense-siRNA or MK-2206, and harvested after 24 h of transfection. (B) The effect of AKT3-siRNA on the levels of AKT3 mRNA expressions in Hela/DDP cells. (C) Immunoblot depicting Akt3 and pAkt protein levels.
MK-2206 treatment increased sensitivity of Hela/DDP to cisplatin and AKT3-siRNA treatment induced apoptosis
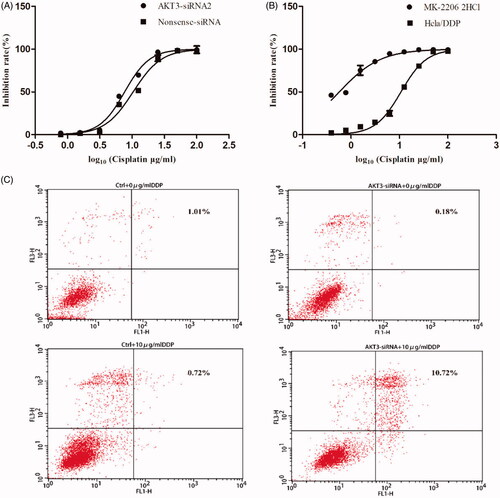
The CCK-8 assay revealed that Hela/DDP cells transfected with AKT3-siRNA exhibited slightly increased sensitivity to DDP compared to cells transfected with Nonsense-siRNA. Similarly, suppression of the AKT3 level in Hela/DDP cells by AKT inhibitor MK-2206 resulted in a rocketed sensitivity to DDP (). We examined apoptosis change of Hela/DDP cells using method of Annexin-V/PI staining. As shown in , comparing with only cisplatin treatment group, combination with cisplatin and AKT3-siRNA induced significantly higher apoptosis rate in Hela/DDP cells. Taken together, we demonstrated that downregulation of AKT3 enhanced the anti-tumour of cisplatin on Hela/DDP through apoptotic pathway.
Figure 8. Knockdown AKT3 in Hela/DDP cells increased its sensitivity to cisplatin and apoptotic rate. (A) CCK-8 assay showed that after treating with AKT3-siRNA Hela/DDP’s sensitive to cisplatin changed slightly. (B) CCK-8 assay was performed to examine cell survival. After treating with MK-2206 for 24 h, Hela/DDP cells showed more sensitive to cisplatin. (C) Apoptotic rate of Hela/DDP cells was measured through using Annexin-V/PI staining on a flow cytometry.
Discussion
In the present study, our aim was to obtain potential therapeutic strategies of resistance to cisplatin in cervical cancer by comparing transcriptome differences associated with cisplatin resistance cells (Hela/DDP) and Hela cell lines. Firstly, our data from next-generation sequencing pointed out 2,312 genes were significantly differentially expressed between the cisplatin-resistant cell line (Hela/DDP) and its parental cell line (Hela), including 1,437 up-regulated genes and 873 down-regulated genes in Hela/DDP compared with Hela. Second, the function of these DEGs was annotated and enriched by reference to the database like GO, COG and KEGG. The top-five DEGs-enriched relative signalling pathways in the KEGG database were investigated in order to find the molecular mechanism of cisplatin resistance. Based on the RNA-seq and statistical results, AKT3 was identified as the target gene which was possible involved in a potential resistance mechanism. Lastly, qRT-PCR and western Blot were performed to certify the AKT3 mRNA and protein expression. In addition, apoptotic rate was measured using performing flow cytometry.
Cisplatin is a cell cycle non-specific cytotoxic and a first-line drug for cervical cancer chemotherapy [Citation28]. It plays a role of anticancer via DNA damage response and apoptosis by generating DNA lesions [Citation29]. However, resistance to cisplatin results in limitations during treatment [Citation4]. Resistance of cisplatin has been proved to be associated with cellular contents up-taking, drug efflux, increasing the ability of detoxification, inhibition of apoptosis and increased DNA repair [Citation30].
In this work, we revealed a connection between the PI3K/AKT pathway and cisplatin resistance in cervical cancer. This specific signalling pathway enriched most DEGs. It shows that the activation state of the PI3K/AKT pathway results in tumours developing resistance to targeted therapies as well as to chemical/radiotherapy [Citation31]. Inhibition of certain components of the PI3K pathway not only synergizes with chemotherapy, radiation therapy, hormone therapy and targeted drugs in cancer therapy, but also overcomes its resistance [Citation32,Citation33]. In our study, there were three key genes in the pathway which were upregulated in cisplatin resistant cells: HSP90B1, AKT3 and CREB5.
Therefore, the connection between AKT3 and cisplatin resistance in cervical cells is further studied in this work. We first reported that AKT3 takes a crucial part in cisplatin resistance in cervical cells. It has been observed that AKT3 is highly expressed in cisplatin resistance Hela/DDP cells than cisplatin sensitive Hela cells both in mRNA and protein level. qPCR analysis also showed that mRNA measured matched their sequencing results. In addition, knockdown of AKT3 increased sensitivity to cisplatin and apoptosis. After treating with MK-2206 2HCl, Hela/DDP cells showed more sensitive to cisplatin as well. Western blot analysis further indicated that MK-2206 2HCl significantly decreased expression of p-AKT. Results suggested that AKT3 takes an important part in many aspects of cancer biology which involves proliferation, survival, apoptosis and drug resistance of cancer cells.
The activity of AKT3 may depend on upstream or downstream molecules that have network with it in particular kind of cancer cell. For instance, it has been reported that AKT3 contributed endocrine therapy resistance of ErbB2 (+) breast tumour cells by regulating the expression of ErbB2 [Citation34]. In human ovarian cancer, miR-489 has been demonstrated to inhibit cisplatin resistance and cell growth, and promote apoptosis by suppressing AKT3 expression [Citation35]. Additionally, it has been shown that expression of AKT3 is negatively correlated with miR-505, which, in turn, regulates drug sensitivity in MCF7-ADR [Citation36]. Therefore, microRNA-mediated AKT3 expression may play important roles in cisplatin resistance in cervical cancer cells.
In conclusion, our work analyzed transcriptome-related changes in cisplatin-resistant Hela cells and their progenitors. We found three new promising biomarkers in the PI3K/AKT signalling pathway (HSP90B1, AKT3 and CREB5). In addition, inhibition of AKT3 may have effects on the development of new therapeutic clinic strategies to overcome acquired cisplatin resistance in cervical cancer.
Acknowledgements
We thank core research facility support from Natural Sciences and Science Education Academic Group, National Institute Education, and we thank Department of Pharmacy, The Second Affiliated Hospital of Air Force Medical University for experimental materials.
Disclosure statement
No potential conflict of interest was reported by the authors.
Related Research Data
References
- Siegel RL, Miller KD, Jemal A. Cancer statistics, 2017. CA Cancer J Clin. 2017;67:7–30.
- Markman M. Advances in cervical cancer pharmacotherapies. Exp Rev Clin Pharmacol. 2014;7:219–223.
- Cadron I, Van Gorp T, Amant F, et al. Chemotherapy for recurrent cervical cancer. Gynecol Oncol. 2007;107:S1138.
- Siddik ZH. Cisplatin: mode of cytotoxic action and molecular basis of resistance. Oncogene. 2003;22:7265–7279.
- Franke TF, Hornik CP, Segev L, et al. PI3K/Akt and apoptosis: size matters. Oncogene. 2003;22:8983–8998.
- Aoki M, Fujishita T. Oncogenic roles of the PI3K/AKT/mTOR Axis. Curr Top Microbiol Immunol. 2017;407:153–189.
- LoPiccolo J, Blumenthal GM, Bernstein WB, et al. Targeting the PI3K/Akt/mTOR pathway: effective combinations and clinical considerations. Drug Resist Updat. 2008;11:32–50.
- Vivanco I, Sawyers CL. The phosphatidylinositol 3-kinase–AKT pathway in human cancer. Nat Rev Cancer. 2002;2:489.
- Hers I, Vincent EE, Tavare JM. Akt signalling in health and disease. Cell Signal. 2011;23:1515–1527.
- Cassinelli G, Zuco V, Gatti L, et al. Targeting the Akt kinase to modulate survival, invasiveness and drug resistance of cancer cells. Curr Med Chem. 2013;20:1923–1945.
- Steelman LS, Navolanic P, Chappell WH, et al. Involvement of Akt and mTOR in chemotherapeutic- and hormonal-based drug resistance and response to radiation in breast cancer cells. Cell Cycle. 2011;10:3003–3015.
- Stahl JM. Deregulated Akt3 activity promotes development of malignant melanoma. Cancer Res. 2004;64:7002–7010.
- Joy A, Kapoor M, Georges J, et al. The role of AKT isoforms in glioblastoma: AKT3 delays tumor progression. J Neurooncol. 2016;130:43–52.
- Lee JH, Huynh M, Silhavy JL, et al. De novo somatic mutations in components of the PI3K-AKT3-mTOR pathway cause hemimegalencephaly. Nat Genet. 2012;44:941–945.
- Davies MA, Stemke-Hale K, Tellez C, et al. A novel AKT3 mutation in melanoma tumours and cell lines. Br J Cancer. 2008;99:1265–1268.
- Wei W. miR-29 targets Akt3 to reduce proliferation and facilitate differentiation of myoblasts in skeletal muscle development. Cell Death Dis. 2013;4:e668–e668.
- Shao Y. Akt3-mediated resistance to apoptosis in B-RAF-targeted melanoma cells. Cancer Res. 2010;70:6670–6681.
- Gagnon V, Mathieu I, Sexton E, et al. AKT involvement in cisplatin chemoresistance of human uterine cancer cells. Gynecol Oncol. 2004;94:785–795.
- Gagnon V, Themsche C, Turner S, et al. Akt and XIAP regulate the sensitivity of human uterine cancer cells to cisplatin, doxorubicin and taxol. Apoptosis. 2008;13:259.
- Grottke A, Ewald F, Lange T, et al. Downregulation of AKT3 Increases Migration and Metastasis in Triple Negative Breast Cancer Cells by Upregulating S100A4. PloS One. 2016;11:e0146370.
- Kim M, Kim YY, Jee HJ, et al. Akt3 knockdown induces mitochondrial dysfunction in human cancer cells. Acta Biochim Biophys Sin (Shanghai). 2016;48:447–453.
- Yadav SS, Li J, Lavery HJ, et al. Next-generation sequencing technology in prostate cancer diagnosis, prognosis, and personalized treatment. Urol Oncol. 2015;33:267.e1–13.
- Lin W, Feng M, Li X, et al. Transcriptome profiling of cancer and normal tissues from cervical squamous cancer patients by deep sequencing. Mol Med Rep. 2017;16:2075–2088.
- Mutz KO, Heilkenbrinker A, Lonne M, et al. Transcriptome analysis using next-generation sequencing. Current Opinion in Biotechnology. 2013;24:22–30.
- Kim D, Pertea G, Trapnell C, et al. TopHat2: accurate alignment of transcriptomes in the presence of insertions, deletions and gene fusions. Genome Biol. 2013;14:R36.
- Langmead B, Trapnell C, Pop M, et al. Ultrafast and memory-efficient alignment of short DNA sequences to the human genome. Genome Biol. 2009;10:R25.
- Wadhwa B, Makhdoomi U, Vishwakarma R, et al. Protein kinase B: emerging mechanisms of isoform-specific regulation of cellular signaling in cancer. Anticancer Drugs. 2017;28:569–580.
- Dasari S, Tchounwou PB. Cisplatin in cancer therapy: molecular mechanisms of action. Eur J Pharmacol. 2014;740:364–378.
- Galluzzi L, Senovilla L, Vitale I, et al. Molecular mechanisms of cisplatin resistance. Oncogene. 2012;31:1869–1883.
- Shen DW, Pouliot LM, Hall MD, et al. Cisplatin resistance: a cellular self-defense mechanism resulting from multiple epigenetic and genetic changes. Pharmacol Rev. 2012;64:706–721.
- Hennessy BT, Smith DL, Ram PT, et al. Exploiting the PI3K/AKT pathway for cancer drug discovery. Nat Rev Drug Discov. 2005;4:988–1004.
- Kim D, Dan HC, Park S, et al. AKT/PKB signaling mechanisms in cancer and chemoresistance. Front Biosci. 2005;10:975–987.
- Brognard J, Clark AS, Ni Y, et al. Akt/protein kinase B is constitutively active in non-small cell lung cancer cells and promotes cellular survival and resistance to chemotherapy and radiation. Cancer Res. 2001;61:3986–3997.
- Grabinski N, Mollmann K, Milde-Langosch K, et al. AKT3 regulates ErbB2, ErbB3 and estrogen receptor alpha expression and contributes to endocrine therapy resistance of ErbB2(+) breast tumor cells from Balb-neuT mice. Cell Signal. 2014;26:1021–1029.
- Wu H, Xiao Z, Zhang H, et al. MiR-489 modulates cisplatin resistance in human ovarian cancer cells by targeting Akt3. Anticancer Drugs. 2014;25:799–809.
- Yamamoto Y, Yoshioka Y, Minoura K, et al. An integrative genomic analysis revealed the relevance of microRNA and gene expression for drug-resistance in human breast cancer cells. Mol Cancer. 2011;10:135.