
Abstract
The prevalence of obesity is increasing at an alarming rate worldwide with about 30% of the world population classified as obese. Obese body structure results when energy intake exceeds energy expenditure in an individual. Increase in the consumption of high-energy eatables, in the context of portion and energy provided, has resulted in obese populations which is becoming the leading cause of metabolic disorders related to morbidity. The obesity-related comorbidity is an enormous liability on health services and will affect measures taken in tackling the increasing obesity rate. Prevention of an obese phenotype is the most suitable long-term strategy. Another approach towards the treatment of obesity is weight management through phytotherapeutics. In this study, we explored the anti-obesity effects of Cinnamon (Cinnamomum zeylanicum) in adult male zebrafish. Through BMI measurements, blood glucose level analyses, serum triglyceride analyses, Oil Red O staining as well as quantitative Real Time-PCR, the ability of cinnamon to reduce metabolic disorders associated with obesity is investigated for the first time in a zebrafish model. Our studies indicate that cinnamon ameliorates the genotypic and phonotypic characteristics associated with obesity through lowering of BMI, blood glucose, triglyceride levels, lipid levels in the liver and through gene modulation.
Introduction
Obesity is a growing worldwide problem caused by changing lifestyle patterns, such as in dietary intake as global development increases. Owing to the increasing cases of obesity, the metabolic diseases, representing a group of disorders comprising increased levels of blood sugar and blood pressure, surplus abdominal fat along waistline and excessive cholesterol levels, are becoming quite common [Citation1]. Obesity is known to cause many non-communicable ailments like cardiac diseases, high blood glucose levels and musculoskeletal syndromes [Citation2]. The ability to ameliorate the effects of such diet-induced obesity would increase the lifespan and reduce health care expenditure drastically, showing the need for such a mechanism. Obesity has costed the US alone $117 billion in direct and indirect means [Citation3]. There is a direct positive proportion stuck between dietetic fat consumption and obesity as inferred by many epidemiological researches [Citation4]. A diet rich in saturated fat not only brings obesity in humans but also induces obesity in animal subjects in the laboratory [Citation5–7]. Among rodents, a positive connection was discovered between the fat percentage in the diet and body fat increase [Citation8–11]. The C57BL/6J mouse, that has been adopted as an important model used to study the interaction among ecological encounters and genetic history like high-calorie intakes, is prone to the growth of metabolic disorders [Citation12]. Zebrafish with the scientific name Danio rerio has organ and tissues that are alike humans with regards to anatomy and metabolic functionality. Therefore, as far as using a model for finding therapeutics to human ailments, the zebrafish is becoming quite popular as it is acquiescent to genetic operations, its captive breeding is simple and maintenance of its investigational clusters is economical [Citation13]. Various anatomical prototypes of zebrafish for testing monogenic human-inherited syndrome were produced with the use of accelerative-genomic screens, permitting an improved knowledge of elementary cell-biological progressions that trigger the syndrome phenotype past that evolved from prevailing prototypes. Numerous zebrafish transgenic methodologies have been utilized in sculpting developed ailments [Citation14,Citation15]. Additionally, numerous research findings postulate the zebrafish as an exceptional prototype for testing lipid metabolism for vertebrate organisms [Citation16,Citation17]. Excess assimilation of the visceral melanocortin contender agouti-type protein and the serine protein kinase Akt1 bring corpulence in zebrafish [Citation18,Citation19]. Additionally, Oka et al. [Citation20] demonstrated the effectiveness of zebrafish (that were fed in excess) as a prototype of nutritive corpulence that bonds conjoint pathophysiological corridors with corpulence in mammals. Undeniably, even Hasumura et al. [Citation21] was successful in establishing the reverse-corpulence influence of Green Tea Extract, through diet prompted obese prototype of zebrafish. These studies propose that zebrafish is a valuable animal prototype for research in the field of finding cure for obesity. For example, a number of PKD loci have been recognized from a section of zebrafish-derived prototype having cystic kidney syndrome, nonetheless only one supported an abrasion in an orthologous gene known in human genotype [Citation22]. A better hypothetical illustration is delivered though another zebrafish-derived prototype which was degenerated and which demonstrated retinal collapse that is indicative of the Hermansky–Pudlak disorder, nonetheless it mapped astray from any identified ailment loci [Citation23,Citation24].
The use of herbal medicine is an emerging paradigm among researchers and patients likewise. Results from the use of plant materials gives advantageous health outcomes, e.g. low triglyceride levels [Citation25]. There are quite a few studies that have shown the positive regulatory effects of herbal medicines on serum triglyceride levels and prevention of hyperlipidemic complications [Citation25–28]. Cinnamomum zeylanicum is a traditional medicinal herb used for a host of ailments like gastrointestinal issues, colds and flu symptoms, and infections of the urinary tract. Cinnamon has been shown to reduce fasting blood glucose levels, blood pressure including a plethora of risk factors that accompany obesity, diabetes and cardiovascular complications [Citation29]. The antidiabetic and insulin-mimetic action of cinnamon extract including regulation of expression of genes related to lipid and glucose metabolism has been shown in Wistar rats [Citation30]. It has been shown that the administration of cinnamon extract attenuates dyslipidemia by the regulation of LDL-R expression in hypercholesterolimic animals, thereby exhibiting a protective effect in hypercholesterolemia [Citation31]. In addition, the polyphenol extract of cinnamon has been demonstrated to lower inflammation, oxidative stress and hyperlipidemia via activation of antioxidant signaling and related transcription factors in high-fat diet rats [Citation32]. Cinnamon polyphenol extract is known to show adjuvant action with insulin, thereby affecting diacylglycerol acyltransferase and tristetraprolin expression in mouse adipocytes and macrophages; hence leading to a regulatory effect on inflammatory responses and fat biosynthesis [Citation33]. Cinnamon polyphenol extract also regulates immune cell function, thereby affecting the genes encoding proinflammatory cytokines, GLUT pathway and Tristetraprolin expression in RAW264.7 macrophages [Citation34].
This investigation will establish the zebrafish as a model for the analysis of genotypic and phenotypic characteristics in metabolic disease such as obesity through diet, and the potential of cinnamon in ameliorating the effects of adverse diet can be investigated. Cinnamon has been reputed to reduce the physical appearance of obesity, especially around the abdomen and to stabilize blood glucose levels, allowing subjects to feel fuller for a longer period. It is hypothesized that cinnamon would be able to reduce some of the genotypic and phenotypic characteristics associated with obesity in the established zebrafish model.
Materials and methods
Zebrafish husbandry
Zebrafish were maintained at a regulated temperature of 28 °C at a 14 h light: 10 h dark cycle. All animal experiments were performed according to the guidelines approved by Institutional Animal Care and Use Committee at Dr. B.R. Ambedkar Center for Biomedical Research, University of Delhi, Delhi, India.
Zebrafish feeding procedures
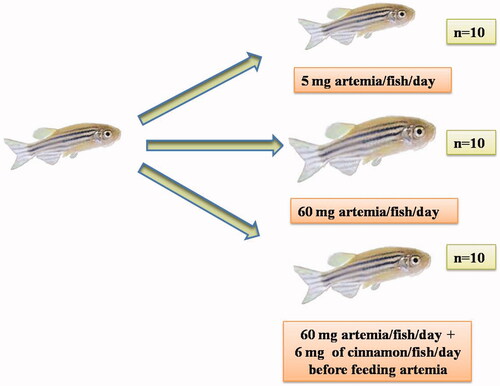
Three main groups of fishes were studied which were given differing foods (wild-type male zebrafish of the AB strain were used). Male AB zebrafish were divided into three groups: First group was established as a control by feeding a regular amount of the shrimp Artemia; second group was induced to have obesity through excessive feeding of Artemia; third group was induced to have obesity through excessive feeding of Artemia but which was also fed Cinnamon powder (Cinnamomum zeylanicum).
Normal feeding group (5mg of Artemia/fish/day) – NF group
Overfeeding group (60mg of Artemia/fish/day, fed 20mg thrice a day) – OF group
Overfeeding + Cinnamon group (60mg of Artemia/fish/day, fed 20mg thrice a day + 2mg cinnamon powder/fish/day, fed thrice a day 20 minutes before Artemia feeding) – C + OF group
Zebrafish were maintained at 5 fish per tank; 36 tanks of 5 fishes each were used, with 12 tanks for each feeding group over the course of the experimentation. The feeding procedures used in this study were followed from a previous study by Oka et al. [Citation20]. Blood glucose and plasma triglyceride analysis, as well as Oil red O staining and quantitative RT-PCR were carried out. Each procedure used 2 tanks of 5 fishes each. Since 10 fish per experiment were analyzed, individual tracking of fish was not possible, length and related parameters were averaged per sample. A 3–4 weeks overfeeding with Artemia is sufficient to induce obesity in zebrafish, and this model is in close resemblance to the reality of obesity in humans.
Measurement of body weight and length of fishes
Both before the start (week 0) and at end (week 4) of feeding experiments, body weight and length of anesthetized zebrafish were measured. In order to take measurements, fishes were anesthetized using buffered tricaine. Tricaine was prepared at 0.02% concentration in facility water and fish were transferred to a beaker containing the mixture. They were then monitored for stage III of anesthesia in which there was loss of equilibrium, loss of operculum movements and loss of reactivity. This stage was usually reached in a minute, after which measurements could be taken. Body weight in grams was measured by subtracting the weight of a beaker of facility water with the fish from the weight of the beaker of facility water only; using the Zebrafish Facility scale. Weight was determined every week during the experiment. Fish were allowed to recover from the anesthesia. Length in cm was measured from the anterior-most point of the mouth, to the most posterior-most region of the caudal peduncle using a ruler after body weight was taken. Length of each group was measured at week 0 and week 4 time-points.
Blood glucose levels analysis
Fasting blood glucose levels were analyzed from the dorsal artery using a Glucose meter (Accu-Chek, Roche). Fish were deprived of food overnight and anesthetized with tricaine, before a dorsal cut was made at the dorsal artery. Blood was drawn with a pipette and transferred to a glucose meter strip; in a way similar to that used by diabetics.
Serum triglyceride levels analysis
For the analysis of serum triglyceride levels, blood samples were collected from the dorsal artery and pooled from all zebrafish per feeding group for each feeding experiment. Blood was collected and transferred to a microcentrifuge tube and incubated at room temperature for 30 min. The microcentrifuge tubes were then centrifuged at 5000 rpm at room temperature for 15 min after which serum was separated and subjected to triglyceride level analysis using Serum Triglyceride Determination Kit (Sigma) according to the manufacturer’s instructions.
Histopathological analysis of zebrafish
Zebrafish were euthanized after anaesthesia with 0.1 mg/ml tricaine (Sigma-Aldrich) (baseline, after 2 weeks, after 4 weeks of diet). Livers were fixed using 10% buffered formalin solution (Histo-Fresh) to preserve tissue quality. Tissues were then placed in a sucrose solution at 4 °C for 3 h, then rapidly frozen in liquid nitrogen-cooled isopentane. They were then embedded in Tissue-Tek and dissected using cryostat. Frozen 5 μm cryostat sections were stained with 0.5% Oil Red O (BDH Laboratory Supplies) in propylene glycol and counterstained with Carazzi’s haematoxylin (Sigma-Aldrich). Samples were observed using light microscopy Zeiss Axiovert 40 CFL Microscope. Images were acquired with an in-built AxioCam color camera. Liver steatosis was quantified by measuring the area of hepatocytes using the National Institutes of Health ImageJ software (http://rsbweb.nih.gov/) [Citation35].
Quantitative RT-PCR
Liver tissues were dissected from the zebrafish and added in Trizol (Invitrogen) before homogenization. RNA isolation was carried out with 200 µl of chloroform, 500 µl of isopropyl alcohol, 500 µl of 75% ethanol and 30–50 µl of RNAse-free water. RNA quantification was done using Nanodrop Spectrophotometer. Subsequently, cDNA synthesis was performed with Oligo (dT)18, 10 mM dNTP, 5X buffer, 0.1 mM DTT, RNase OUT and SSIII Reverse Transcriptase. Finally, plating was done with 2X Sybr Green Master Mix (Bio-Rad) and the following metabolism-related genes were quantitated: PPARAB, NR2F2, PPARGC1AL, ALDOCA, LDLR, PDE4BA, FOXO1, SREBF1, SREBF2, RARGA, with ACTB as an endogenous control gene ().
Table 1. Primers for qRT-PCR.
Statistical analysis
All outcomes, including the final results are expressed as mean ± standard error. The data in the experiments were analyzed using the analysis of variance (one-way ANOVA). The p < .05 value were considered as statistically significant.
Results
Weight, length and BMI measurements
We assessed phenotypic and genotypic parameters in response to normal feeding, overfeeding and cinnamon-treated overfeeding groups (). Phenotypic measurements included body weight, length, BMI, blood glucose and serum triglyceride measurements. Histological analysis of liver was done in addition to genotypic studies by relative quantitation of gene expression.
Figure 1. Overview of feeding experiments for zebrafish obesity model. Three major feeding groups were taken up for this study. One was normal feeding group, second was overfeeding group, third was overfeeding group which was also fed cinnamon.
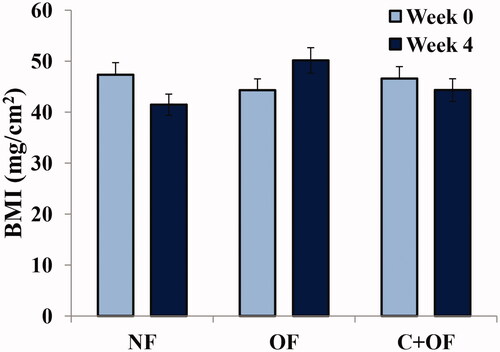
As shown in , weight of overfed group was remarkably higher as compared to the normally fed group. In cinnamon-treated overfeeding group, there was a significant decrease in the weight of the fishes. For the fishes fed for 0 weeks, the body mass index (BMI) values are comparable for the normal feeding and over feeding groups. For the fishes fed for 4 weeks, the BMI values for the overfeeding group were significantly higher than that of the normal feeding group. On the other hand, the BMI values for the cinnamon + overfeeding group were comparable to those of the normal feeding group (). Hence, BMI values were generally lower for the cinnamon + overfeeding group in comparison to the overfeeding group. This implicates that cinnamon lowers BMI in overfed zebrafish and hence helps in decrease of the overfeeding-induced effect on body weight and length parameters.
Figure 2. Overfeeding of fish with artemia leads to an obese phenotype. (A) Weight of the three feeding groups was measured at week 0 and week 4 endpoints. Overfeeding of fish with artemia leads to significant increase in weight. (B) Body length was measured at week 0 and week 4 endpoints. Values are presented as mean + SE.
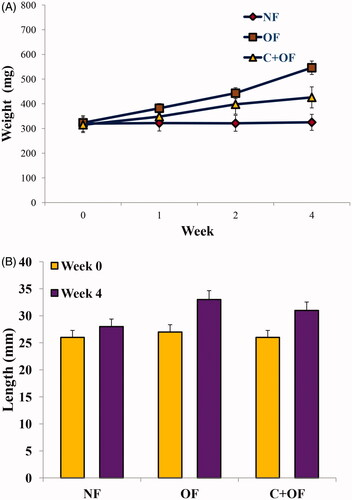
Figure 3. BMI values were calculated using weight and body length parameters at week 0 and week 4 endpoints. Values are presented as mean + SE.
Blood glucose levels
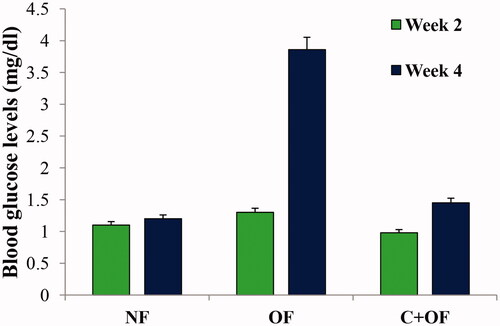
At week 2 measurements for blood glucose level, no significant difference was seen in the blood glucose levels between normal feeding, overfeeding and cinnamon + overfeeding group (). However, at week 4 endpoint, there was a significant increase in the blood glucose levels in the overfeeding group as compared to the normal feeding group. In the fish fed with cinnamon prior to overfeeding, the blood glucose levels were comparable to normal feeding group in a significant manner, which implicates that cinnamon has blood glucose lowering impact in zebrafish and hence helps in such aspect of amelioration of overfeeding-induced diabetic effect.
Figure 4. Phenotypic analysis of amelioration of diet induced obesity in zebrafish. Fasting blood glucose levels were measured at week 2 and week 4 endpoints and were found to be elevated in overfeeding experiments.
Serum triglyceride measurements
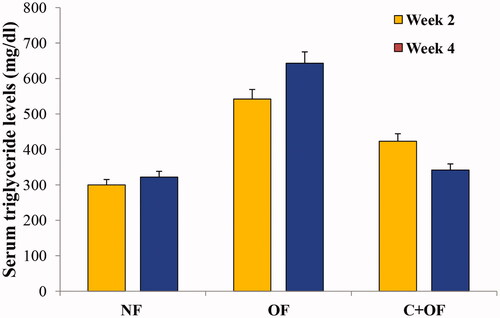
As shown in , the serum triglyceride levels were determined for normal feeding, overfeeding and cinnamon + overfeeding zebrafish groups at week 2 and week 4 endpoints. Cinnamon showed effective triglyceride lowering effect at both week 2 and week 4 endpoints, as is evident from the graph while comparing the values for normal feeding, overfeeding and cinnamon + overfeeding groups.
Figure 5. Phenotypic analysis of attenuation of diet induced obesity in zebrafish. Serum triglyceride levels were measured at week 2 and week 4 endpoints. The levels of triglycerides were observed to be increased in overfeeding group as compared to normal feeding group.
Histopathological analysis of zebrafish livers
To evaluate whether lipids accumulated in the liver, hepatic tissue was stained with Oil Red O. Microscopic evaluation of stained samples of control and overfed zebrafish liver tissue revealed the presence of hepatic steatosis (accumulation of fat vacuoles) in overfed zebrafish after the beginning of the overfeeding protocol (). No changes were observed in the liver of control animals throughout the study. In overfed zebrafish, most of the cell cytoplasm was occupied by large fat vacuoles, as shown by arrows (). A significant increase in Oil Red O staining was observed in all overfed groups except for normal feeding samples. A significant enlargement of hepatocyte area () was observed: the increase in hepatocyte size was rapid, being already present in all overfeeding groups (compared with the respective baseline for each subgroup). Thus, cinnamon reduced lipid accumulation (numbers and size of red spots) of liver tissues more than overfeeding with Artemia, corresponding to the results of plasma TG lowering.
Figure 6. Histology of liver using Oil Red O staining and haematoxylin staining. (A) Oil Red O staining at 2 weeks endpoint- Significant accumulation of fat was seen in overfeeding group, with reduction in fat accumulation in liver tissues at 4 weeks endpoint. (B) Oil Red O staining at 4 weeks endpoint - At the end of 4 weeks, immense increase in fat accumulation was observed in fishes subjected to overfeeding; however, cinnamon treatment along with overfeeding resulted in reduction of fat storage in liver tissues.
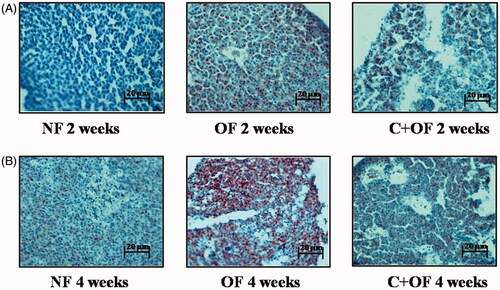
Figure 7. Histology images of Oil Red O staining and haematoxylin staining of overfeeding groups. Scale bar: 20 µm. Arrows indicate accumulation of fat vacuoles in zebrafish overfed with artemia over a period of 2 weeks and 4 weeks. 4 weeks overfeeding group showed higher accumulation as compared to 2 weeks overfeeding group.
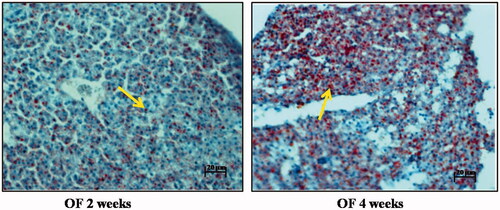
Table 2. Image J analysis of oil red O staining images.
Relative quantitation of gene expression
A total of 10 genes () were analyzed for their relative expression in response to normal feeding, overfeeding and cinnamon-treated groups at week 2 () and week 4 () endpoints.
Figure 8. Induction of obesity resulted in alterations in genes specific to metabolic processes and response to lipid accumulation. Genes were quantitated by Sybr Green-based real-time detection at both week 2 (A) and week 4 (B) endpoints.
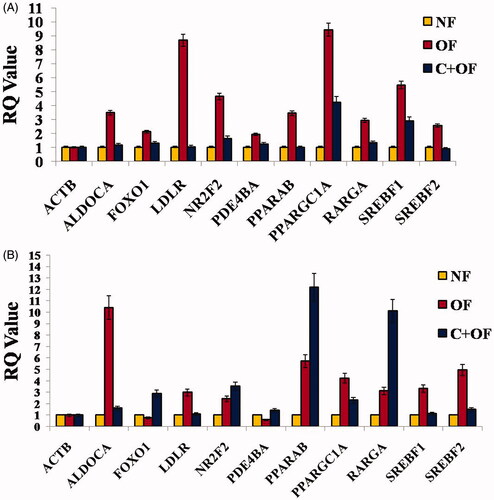
In the context of biological pathway of lipid metabolism (), sterol regulatory element-binding transcription factor 1 (SREBF1) and sterol regulatory element-binding transcription factor 2 (SREBF2) were observed to be upregulated in DIO zebrafish at both week 2 and week 4 endpoints. SREBF family is the most important transcriptional factor which regulates de novo lipogenesis in the liver, and is a major contributor in the pathogenesis of nonalcoholic fatty liver disease [Citation36,Citation37]. Regulation of SREBF1 and SREBF2 exhibits the effect of Cinnamon on de novo lipogenesis. Natural products are known to inhibit atherogenesis and fatty liver in LDL receptor knockout mice [Citation38] by the regulation of peroxisome proliferator-activated receptor (PPAR-γ) activity. Dysregulation of the LDLR pathway might lead to accelerating the onset of lipid disorder-mediated target organ injuries like non-alcoholic fatty liver disease (NAFLD). LDLR is a glycoprotein which functions in uptake and internalization of lipoproteins, specially LDL-cholesterol [Citation39]. Our studies showed upregulation of LDLR in DIO zebrafish and it was observed that LDLR gene expression levels were regulated when cinnamon was fed to the overfeeding groups (at both 2 weeks and 4 weeks endpoints). Similarly, we found upregulation in PPAR family genes (PPARAB and PPAR-γ) in DIO zebrafish, whereas PPAR expression levels were comparable to normal feeding group in cinnamon-fed DIO groups. In addition, we analyzed forkhead box O1 (FOXO1) expression. It has been reported that polyphenols present in peanuts and grapes alleviate alcoholic fatty liver via FOXO1 signalling pathway [Citation40]. This seems very similar to our result when cinnamon was fed to DIO zebrafish at 4 weeks; wherein we observed upregulation of FOXO1 mRNA levels. FOXO1 also represses PPAR-γ transactivation in adipocytes [Citation41], which might imply that cinnamon exerted further lipid-lowering property. Nuclear receptor subfamily 2, group F, member 2 (NR2F2) was also upregulated in DIO zebrafish. NR2F2 and RXR activate and bind the cholesterol 7 alpha-hydroxylase (CYP7A1) gene, a rate-limiting enzyme in the synthesis of bile acid from cholesterol via the classic pathway [Citation42]. Downregulation of NR2F2 in cinnamon-fed zebrafish shows that cinnamon affects cholesterol metabolism in a positive manner.
Figure 9. Biological networks identified by gene regulatory network analysis altered in Cinnamon treated diet induced obesity zebrafish. (A) Network 1, gene regulatory network related to lipid metabolism. (B) Network 2, gene regulatory network related to cancer. Solid arrows depict activation, dashed arrows depict suppression.
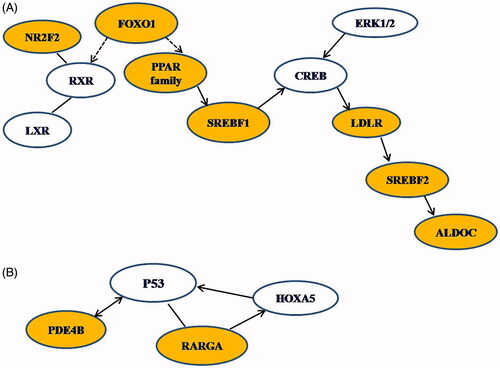
The second biological correlation identified was related to cancer. It is well reported that fatty liver disease caused by obesity might develop into nonalcoholic steatohepatitis progressing into liver cancer, and dietary administration of natural products aids in the inhibition of nonalcoholic hepatitis-promoted hepatocarcinogenesis in rat models induced by low volume of hepatic carcinogen diethylnitrosamine with high-fat diet [Citation43]. The mechanism of inhibition of carcinogenesis is thought to be dependent on reduction of oxidative stress, mainly by downstream genes like heme oxygenase-1. However, we observed that the effect of cinnamon on DIO-zebrafish seems to be related to retinoic acid receptor (RAR) signalling, especially RAR-γ in this network of cancer compromise. RAR-γ is a ligand-activated transcription factor for retinoic acid consisting of heterodimers of RARs and RXR. RAR-γ forms complexes with RAR-β that directly activate HOXA5 [Citation44] and may consequently increase the expression of TP53 [Citation45], as seen in this network. We observed that high-fat diet induced RAR-γ expression in DIO zebrafish. However, we observed that cinnamon further increased RAR-γ expression versus regular strain in DIO zebrafish. These results imply that dietary administration of cinnamon might aid in the amelioration of hepatocarcinogenesis associated with nonalcoholic steatohepatitis.
PDE4 metabolizes cAMP and is found in immune and inflammatory cells [Citation46,Citation47]. PDE4 family encodes for four subtypes PDE4A, PDE4B, PDE4C, and PDE4D [Citation5], but the PDE4B plays an important function in inflammation [Citation48]. However, we did not observe regulation of PDE4B in our studies, which implicates that diet-induced obesity did not induce inflammation in zebrafish animal model. ALDOCA, which plays a role in glycolysis and gluconeogenesis, was observed to be upregulated in DIO fish, indicating the effect of high-fat diet on glucose metabolism.
Discussion
Dramatic increases in the occurrence of obesity are a severe problem in developed countries. Obesity is associated with several adverse health consequences including type 2 diabetes mellitus, dyslipidemias, non-alcoholic fatty liver and gallstones, cardiovascular disease (CVD), Alzheimer’s disease, and certain types of cancer. Genetic analysis of human populations has identified variants associated with increased or decreased risk whilst epidemiological and clinical studies have indicated potential health benefits of certain organic products against obesity and metabolic diseases. We aimed to use the zebrafish as a model to perform a systems level analysis of the genetics and environmental factors underlying metabolic disease and to evaluate the potential beneficial effects of organic products. The high degree of genetic conservation and shared physiology makes zebrafish an attractive model for the analysis of human disease. We established a zebrafish obesity model based on overfeeding with artemia and used this to assay the effects both of genotypic variation and of diet supplementation with cinnamon on a number of parameters, such as blood glucose, plasma triglyceride, liver steatosis and gene expression. These data provided a comprehensive understanding and provided a basis for high throughput testing of compounds that can counter the effects of adverse genotype and/or diet.
As is evident from our data, cinnamon exhibited significant blood glucose lowering, triglyceride level lowering, lipid accumulation lowering effects both at week 2 and week 4 endpoints. Also, the body weight and length parameters (BMI values) were comparably reduced to the normal level by cinnamon as against the overfeeding group. Gene expression analyses also showed an amelioration of overfeeding induced obesity effects due to the different functions and possible time of expression of the quantified genes.
Kim et al. suggested that cinnamon extract has a regulatory role in blood glucose level and lipids and it may also exert a blood glucose-suppressing effect by improving insulin sensitivity or slowing absorption of carbohydrates in the small intestine [Citation49]. The findings by Kannappan et al. indicated the improvement of glucose metabolism in vivo by cinnamon bark extract in fructose-fed rats [Citation50]. It has also been shown that cinnamon extract improves fasting blood glucose and glycosylated hemoglobin level in Chinese patients with type 2 diabetes [Citation51]. Additionally, lean protein, vinegar, fish oil, tea, cinnamon, calorie restriction, weight loss, exercise and low-dose to moderate-dose alcohol each positively impact post-prandial dysmetabolism. Experimental and epidemiological studies indicated that eating patterns, such as the traditional Mediterranean or Okinawan diets, that incorporate these types of foods and beverages reduce inflammation and cardiovascular risk [Citation52]. Ashley et al. suggested that cinnamon may be effective in moderating postprandial glucose response in normal weight and obese adults [Citation53]. It has been shown that Naphthalenemethyl ester derivative of dihydroxyhydrocinnamic acid, a component of cinnamon, increases glucose disposal by enhancing translocation of glucose transporter 4 [Citation54]. Components of cinnamon may be important in the alleviation and prevention of the signs and symptoms of metabolic syndrome, type 2 diabetes, and cardiovascular and related diseases [Citation55]. Findings by Li et al. demonstrated that cinnamon polyphenols can exert the hypoglycemic and hypolipidemic effects through the mechanisms that may be associated with repairing pancreatic beta cells in diabetic mice and improving its anti-oxidative capacity, as well as attenuating cytotoxicity via inhibition of iNOS, NF-κB activation [Citation56]. Hence, our data and findings are in strong correlation with the previous reports though this is the first study of its kind to study the effect of cinnamon in zebrafish.
We conclude from these studies that cinnamon has significant blood glucose lowering, lipid level lowering, triglyceride level lowering, BMI and gene modulation effects when fed to the zebrafish prior to overfeeding as compared with the overfeeding group. Thus, the crucial metabolic parameters are brought comparable to the normal feeding group when the fish are fed with cinnamon. This study establishes cinnamon bark extract powder as a potential candidate in amelioration of diet-induced obesity effects, substantiating the previous reports done in mice and humans. Herein, we also show for the first time in zebrafish using a diet-induced obesity model that cinnamon has an effect on the various ill results induced by obesity, genotypically and phenotypically.
Future work will include the studies being carried out using other phyto-therapeutic substances besides cinnamon to find out their effectiveness in ameliorating effects of an adverse diet genotypically and phenotypically. Obesity can also be induced in other ways besides adverse diet, or other metabolic diseases like diabetes could be investigated.
| Abbreviations | ||
| Akt1 | = | AKT Serine/Threonine Kinase 1 |
| PKD | = | Polycystic kidney disease |
| AB strain | = | wild type zebrafish strain |
| cm | = | centimetres |
| rpm | = | rotations per minute |
| mg/ml | = | milligrams per milliliter |
| μm | = | micrometers |
| µl | = | microliters |
| Oligo (dT) | = | Oligo (dT)18 primer |
| dNTP | = | Deoxyribonucleotide triphosphate |
| DTT | = | Dithiothreitol |
| RNase | = | Ribonuclease |
| SSIII Reverse Transcriptase | = | Super Script III Reverse Transcriptase |
| iNOS | = | inducible Nitric Oxide Synthase |
| DIO | = | Diet Induced Obesity |
Acknowledgements
All the authors are thankful to Department of Chemistry, University of Delhi and Dr. B.R. Ambedkar Center for Biomedical Research, University of Delhi, for necessary infrastructure and facilities.
Disclosure statement
No potential conflict of interest was reported by the authors.
Additional information
Funding
References
- Eckel RH, Grundy SM, Zimmet PZ. The metabolic syndrome. Lancet. 2005;365:1415–1428.
- Meguro S, Hasumura T, Hase T. Body fat accumulation in zebrafish is induced by a diet rich in fat and reduced by supplementation with green tea extract. PLoS One. 2015;10:e0120142.
- World Health Organization [Internet]. Obesity and overweight. Fact sheet N311 [cited 2017 Jan 17]. Available from: http://www.who.int/mediacentre/factsheets/fs311/en/
- Hariri N, Thibault L. High-fat diet-induced obesity in animal models. Nutr Res Rev. 2010;23:270–299.
- Warwick ZS, Schiffman SS. Role of dietary fat in calorie intake and weight gain. Neurosci Biobehav Rev. 1992;16:585–596.
- Tschöp M, Heiman ML. Rodent obesity models: an overview. Exp Clin Endocrinol Diabetes. 2001;109:307–319.
- Buettner R, Schölmerich J, Bollheimer LC. High-fat diets: modeling the metabolic disorders of human obesity in rodents. Obesity (Silver Spring). 2007;15:798–808.
- Boozer CN, Schoenbach G, Atkinson RL. Dietary fat and adiposity: a dose–response relationship in adult male rats fed isocalorically. Am J Physiol. 1995;268:E546–550.
- Ghibaudi L, Cook J, Farley C. Fat intake affects adiposity, comorbidity factors, and energy metabolism of Sprague-Dawley rats. Obes Res. 2002;10:956–963.
- Bourgeois F, Alexiu A, Lemonnter D. Dietary-induced obesity: effect of dietary fats on adipose tissue cellularity in mice. Br J Nutr. 1983;49:17–26.
- Takahashi M, Ikemoto S, Ezaki O. Effect of the fat/carbohydrate ratio in the diet on obesity and oral glucose tolerance in C57BL/6J mice. J Nutr Sci Vitaminol. 1999;45:583–593.
- Collins S, Martin TL, Surwit RS, et al. Genetic vulnerability to diet-induced obesity in the C57BL/6J mouse: physiological and molecular characteristics. Physiol Behav. 2004;81:243–248.
- Song Y, Cone RD. Creation of a genetic model of obesity in a teleost. FASEB J. 2007;21:2042–2049.
- Amsterdam A, Hopkins N. Mutagenesis strategies in zebrafish for identifying genes involved in development and disease. Trends Genet. 2006;22:473–478.
- Lieschke GJ, Currie PD. Animal models of human disease: zebrafish swim into view. Nat Rev Genet. 2007;8:353–367.
- Hölttä-Vuori M, Salo VT, Nyberg L, et al. Zebrafish gaining popularity in lipid research. Biochem J. 2010;429:235–242.
- Anderson JL, Carten JD, Farber SA. Zebrafish lipid metabolism: from mediating early patterning to the metabolism of dietary fat and cholesterol. Methods Cell Biol. 2011;101:111–114.
- Udvadia AJ, Linney E. Windows into development: historic, current, and future perspectives on transgenic zebrafish. Dev Biol. 2003;256:1–17.
- Chu CY, Chen CF, Rajendran RS, et al. Overexpression of Akt1 enhances adipogenesis and leads to lipoma formation in zebrafish. PLoS One. 2012;7:e36474.
- Oka T, Nishimura Y, Zang L, et al. Diet-induced obesity in zebrafish shares common pathophysiological pathways with mammalian obesity. BMC Physiol. 2010;10:21.
- Hasumura T, Shimada Y, Kuroyanagi J, et al. Green tea extract suppresses adiposity and affects the expression of lipid metabolism genes in diet-induced obese zebrafish. Nutr Metab (Lond). 2012;9:73.
- Sun Z, Amsterdam A, Pazour GJ, et al. A genetic screen in zebrafish identifies cilia genes as a principal cause of cystic kidney. Development. 2004;131:4085–4093.
- Bahador R, Rinner O, Schonthaler HB, et al. The zebrafish fade out mutant: a novel genetic model for Hermansky–Pudlak syndrome. Invest Ophthalmol Vis Sci. 2006;47:4523–4531.
- Graham JL, Peter DC. Animal models of human disease: zebrafish swim into view. Nat Rev Gen. 2007;8:353–367.
- Sham TT, Chan CO, Wang YH, et al. A review on the traditional Chinese medicinal herbs and formulae with hypolipidemic effect. Biomed Res Int. 2014;2014:1.
- Belguith-Hadriche O, Bouaziz M, Jamoussi K, et al. Comparative study on hypocholesterolemic and antioxidant activities of various extracts of fenugreek seeds. Food Chem. 2013;138:1448–1453.
- Mohammadi A, Oshaghi EA. Effect of garlic on lipid profile and expression of LXR alpha in intestine and liver of hypercholesterolemic mice. J Diabetes Metab Disord. 2014;13:20.
- Rahman S, Begum H, Rahman Z, et al. Effect of cinnamon (cinnamomum cassia) as a lipid lowering agent on hypercholesterolemic rats. J Enam Med Col. 2013;3:94–98.
- Askari F, Rashidkhani B, Hekmatdoost A. Cinnamon may have therapeutic benefits on lipid profile, liver enzymes, insulin resistance, and high-sensitivity C-reactive protein in nonalcoholic fatty liver disease patients. Nutr Res. 2014; 34:143–148.
- Soliman MM, Attia HF, El-Shazly SA, et al. Biomedical effects of cinnamon extract on obesity and diabetes relevance in wistar rats. Am J Biochem Mol Biol. 2012;2:133–145.
- Kassaee SM, Goodarzi MT, Roodbari NH, et al. The effects of cinnamomum zeylanicum on lipid profiles and histology via up-regulation of LDL receptor gene expression in hamsters fed a high cholesterol diet. Jundishapur J Nat Pharm Prod. 2017;12:e37340.
- Tuzcu Z, Orhan C, Sahin N, et al. Cinnamon polyphenol extract inhibits hyperlipidemia and inflammation by modulation of transcription factors in high-fat diet-fed rats. Oxid Med Cell Longev. 2017;2017:1.
- Cao H, Sethumadhavan K, Li K, et al. Cinnamon polyphenol extract and insulin regulate diacylglycerol acyltransferase gene expression in mouse adipocytes and macrophages. Plant Foods Hum Nutr. 2019;74:115–121.
- Cao H, Urban JF Jr, Anderson RA. Cinnamon polyphenol extract affects immune responses by regulating anti- and proinflammatory and glucose transporter gene expression in mouse macrophages. J Nutr. 2008;138:833–840.
- Turola E, Petta S, Vanni E, et al. Ovarian senescence increases liver fibrosis in humans and zebrafish with steatosis. Dis Model Mech. 2015;8:1037–1046.
- Ahmed MH, Byrne CD. Modulation of sterol regulatory element binding proteins (SREBPs) as potential treatments for non-alcoholic fatty liver disease (NAFLD). Drug Discov Today. 2007;12:740–747.
- Donnelly KL, Smith CI, Schwarzenberg SJ, et al. Sources of fatty acids stored in liver and secreted via lipoproteins in patients with nonalcoholic fatty liver disease. J Clin Invest. 2005;115:1343–1351.
- Harari A, Harats D, Marko D, et al. A 9-cis beta-carotene-enriched diet inhibits atherogenesis and fatty liver formation in LDL receptor knockout mice. J Nutr. 2008;138:1923–1930.
- Ahuja KD, Pittaway JK, Ball MJ. Effects of olive oil and tomato lycopene combination on serum lycopene, lipid profile, and lipid oxidation. Nutr 2006;22:259–265.
- Wang GL, Fu YC, Xu WC, et al. Resveratrol inhibits the expression of SREBP1 in cell model of steatosis via Sirt1-FOXO1 signaling pathway. Biochem Biophys Res Commun. 2009;380:644–649.
- Fan W, Imamura T, Sonoda N, et al. FOXO1 transrepresses peroxisome proliferator-activated receptor gamma transactivation, coordinating an insulin-induced feed-forward response in adipocytes. J Biol Chem. 2009;284:12188–12197.
- Stroup D, Crestani M, Chiang JY. Orphan receptors chicken ovalbumin upstream promoter transcription factor II (COUP-TFII) and retinoid X receptor (RXR) activate and bind the rat cholesterol 7alpha-hydroxylase gene (CYP7A). J Biol Chem. 1997;272:9833–9839.
- Wang Y, Ausman LM, Greenberg AS, et al. Dietary lycopene and tomato extract supplementations inhibit nonalcoholic steatohepatitis-promoted hepatocarcinogenesis in rats. Int J Cancer. 2010;126:1788–1796.
- Chen H, Zhang H, Lee J, et al. HOXA5 acts directly downstream of retinoic acid receptor beta and contributes to retinoic acid-induced apoptosis and growth inhibition. Cancer Res. 2007;67:8007–8013.
- Raman V, Martensen SA, Reisman D, et al. Compromised HOXA5 function can limit p53 expression in human breast tumours. Nature. 2000;405:974–978.
- Baumer W, Hoppmann J, Rundfeldt C, et al. Highly selective phosphodiesterase 4 inhibitors for the treatment of allergic skin diseases and psoriasis. IADT. 2007;6:17–26.
- Souness JE, Aldous D, Sargent C. Immunosuppressive and anti-inflammatory effects of cyclic AMP phosphodiesterase (PDE) type 4 inhibitors. Immunopharmacology. 2000;47:127–162.
- Wang P, Ohleth KM, Wu P, et al. Phosphodiesterase 4B2 is the predominant phosphodiesterase species and undergoes differential regulation of gene expression in human monocytes and neutrophils. Mol Pharmacol. 1999;56:170–174.
- Kim SH, Hyun SH, Choung SY. Anti-diabetic effect of cinnamon extract on blood glucose in db/db mice. J Ethnopharmacol. 2006;104:119–123.
- Kannappan S, Jayaraman T, Rajasekar P, et al. Cinnamon bark extract improves glucose metabolism and lipid profile in the fructose-fed rat. Singapore Med J. 2006;47:858–863.
- Lu T, Sheng H, Wu J, et al. Cinnamon extract improves fasting blood glucose and glycosylated hemoglobin level in Chinese patients with type 2 diabetes. Nutr Res. 2012;32:408–412.
- O'Keefe JH, Gheewala NM, O'Keefe JO. Dietary strategies for improving post-prandial glucose, lipids, inflammation, and cardiovascular health. J Am Coll Cardiol. 2008;51:249–255.
- Magistrelli A, Chezem JC. Effect of ground cinnamon on postprandial blood glucose concentration in normal-weight and obese adults. J Acad Nutr Diet. 2012;112:1806–1809.
- Kim W, Khil LY, Clark R, et al. Naphthalenemethyl ester derivative of dihydroxyhydrocinnamic acid, a component of cinnamon, increases glucose disposal by enhancing translocation of glucose transporter 4. Diabetologia. 2006;49:2437–2448.
- Qin B, Panickar KS, Anderson RA. Cinnamon: potential role in the prevention of insulin resistance, metabolic syndrome, and type 2 diabetes. J Diabetes Sci Technol. 2010;4:685–693.
- Li R, Liang T, Xu L, et al. Protective effect of cinnamon polyphenols against STZ-diabetic mice fed high-sugar, high-fat diet and its underlying mechanism. Food Chem Toxicol. 2013;51:419–425.