
Abstract
Objective
To apply biological variation and six Sigma models to evaluate analysis performance of 6 HbA1c analyzers and design the new quality control strategy.
Method
We collected data of imprecision and inaccuracy from routine internal quality control (June 2017–December 2017) and proficiency test of NGSP, respectively. The coefficient of variance (CV)% and bias% were plotted in the biological variation and six sigma models. The new quality control strategy was designed by the sigma value and OPSpecs. The quality improvement was guided by the QGI.
Results
The analytical performance of 6 HbA1c analyzers in our laboratory were good in the routine model, However, 50% (3/6) and 67% (4/6) of the HbA1c analyzers reached the acceptable level in the biological variation and six Sigma model, respectively. We also design personalized control strategy and promote quality improvement by combining the sigma value, OPSpecs, and QGI.
Conclusions
Biological variation model and six sigma model could visually display the performance of 6 HbA1c analyzers and personalized control strategy could be designed based on the sigma value, OPSpecs, and QGI.
Introduction
HbA1c is a common index for long-term glycaemia monitoring and drug efficacy evaluation. The current guideline conducted by American Diabetes Association (ADA) recommended that HbA1c ≥6.5% was an important criteria for the diagnosis of diabetes. It had also been validated that lowering HbA1c to <7% could reduce microvascular complications of diabetes [Citation1]. Due to its important role in the diagnosis and treatment of diabetes, it is crucial to improve the accuracy of HbA1c detection.
The methods of detection used in clinical laboratories, such as high-performance liquid chromatography (HPLC) systems and electrophoresis, are mainly based on the different electric charges or glycosylation molecules on the HbA1c. Numerous traditional quality control (QC) programs were used to monitor the performances of the analyzers [Citation2,Citation3]. However, new QC models were still needed to better understand the accuracy of the instruments. Analytical–mathematical model was one of the key elements when developing the quality targets and could be divided to biological variation model and six sigma model. These two models had been widely used in evaluating the enzyme measurement procedures and methodologies in surgery [Citation4,Citation5]. Interestingly, a previous study had evaluated the QC within and between 3277 labs and 26 instruments by these two models and the results showed that the biological variation and sigma-metrics model were suitable for setting and evaluating quality targets within and between laboratories [Citation6]. However, the associations between QC and different HbA1c concentrations were still unclear.
In this study, two HbA1c specimens with different concentrations were used to test the QC by biological variation and six sigma models in six HbA1c analyzers. Furthermore, we used the six sigma theory to guide the design of quality control scheme and the continuous improvement of quality. In sum, our result could provide accurate references for effectively improving the quality management level of clinical laboratory.
Methods and materials
Instruments and reagents
Six HbA1c analyzers and their special reagents were purchased in our centre and listed as follows. (1) Variant II automatic HbA1c analyzer. (2) Variant II Turbo 2.0 automatic HbA1c analyzer. (3) Capillarys 2 Flex Piercing capillary protein electrophoresis analyzer. (4) Trinity Ultra2 automatic HbA1c analyser. (5) Trinity Hb9210 automatic HbA1c analyzer. (6) Roche Modular PPI automatic biochemical analyzer.
Calculation of CV% and bias%
We accumulated CV at two levels in the past 6 months to calculate the CV%. Then we selected 6.31% (number MM2068) and 9.64% (number MM2121) (certified by the National Glycohemoglobin Standardization Program (NGSP) I laboratory (PRL) in the United States) specimens for dilution mode detection in the above six HbA1c detection systems and compared to the NGSP target values calculate the Bias%. These two concentrations were chosen because they were close to the diagnostic threshold for diabetes (6.5%) and the medical decision level (10%).
Conventional evaluation mode
Conventional evaluation mode for performance analysis usually included CV%, Bias% and total error (TE%). We used 7% as HbA1c TEa% and chose CV% < 1/3 TEa%, Bias% < 1/3 TEa% and TE% < TEa% as acceptable criteria. TE% = Bias% + 2*CV%.
Biological variation model
In the biological variation mode, we set the analysis quality criteria according to intra-individual variation (CVI) and inter-individual variation (CVG) and divided them into the optimum, desirable, minimum levels. CVI and CVG of HbA1c were 1.9% and 5.7%, respectively. TE = B + 2I [Citation6] (TE was the total error, B was the absolute bias, I was the l minimum level). The calculation of HbA1c quality standard grade was performed according to the following formulas [Citation7,Citation8]. Optimum quality specification: CV < 0.25 CVI, TE < 1.65 * 0.25 CVI + 0.125 (CVI 2 + CVG 2) 0.5. Desirable quality specification: CV < 0.5 CVI, TE < 1.65 * 0.5 CVI + 0.25 (CVI 2 + CVG 2) 0.5. Minimum quality specification: CV < 0.75 CVI, TE < 1.65 * 0.75 CVI + 0.375 (CVI 2 + CVG 2) 0.5. Next, we used CV% as abscissa and Bias% as ordinate to draw the biological variation performance. We also used the values of “optimum,” “desirable” and “minimum” levels to divide the regions of biological variation performance () [Citation6].
Figure 1. Quality target models. Quality targets are shown in colours for the biological variation model (panel A: optimum, desirable, minimum) and with lines for the six sigma-metrics model (panel B: 2–6 σ). Panel C combines both models. The red star represents the Variant II system.
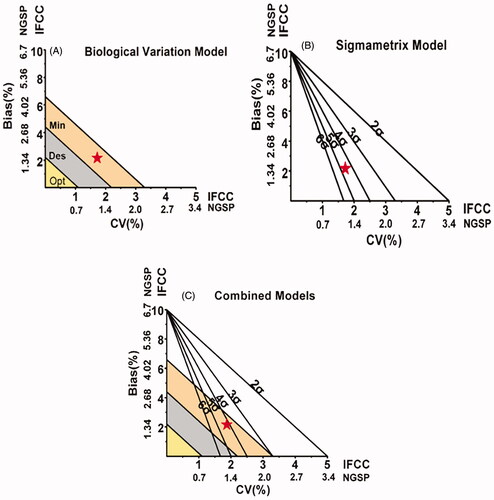
Six sigma model
The calculation formulas are as follows: σ = (TEa%−|Bias%|)/CV%. The six sigma model was drew in the same way as the biological variation model, with CV% as abscissa, Bias% as ordinate and the regions were divided to six grades by five lines. 6σ represented the world's first-class level, which meant that the test results were of better quality and did not require effort to improve performance. 3σ meant generally acceptable. Generally, the performance of >4σ was evaluated as “excellent,, 3σ-4σ as “good,, 2σ-3σ as “medium” and <2σ as “poor”[Citation7]. 6σ was the quality goal of clinical laboratory ().
Design of the quality control method and continuous quality improvement programs selection
We designed the quality control method according to the OPSpecs chart application guide [Citation8]. We used quality goal index (QGI) to determine whether we needed to improve the precision and/or correctness of quality reduction projects. QGI = Bias/(1.5*CV). QGI < 0.8 indicated that the main reason for the poor performance of the method was that the low precision; QGI > 1.2 indicated that the accuracy of the method is poor and should be improved. If QGI was between 0.8 and 1.2, both the precision and accuracy needed to be improved [Citation9].
Results
Performance evaluation of six HbA1c detection systems by conventional mode
CV%, Bias% and TE of six kinds of HbA1c detection systems were counted respectively. According to the conventional mode evaluation methods, the data were analyzed and compared with the corresponding quality objectives. The results were shown in The results showed that CV%, Bias% and TE% of six HbA1c detection systems were acceptable (). The CV%, Bias% and TE% of Ultra2 and Hb9210 systems were small. On the contrary, the CV% of PPI system was relatively large and the Bias% of Capillarys2FP system was relatively large.
Table 1. The calculation of CV% and bias% for six HbA1c analyzers (1: 6.31% (number MM2068), 2: 9.64% (number MM2121)).
Evaluating the performances of six HbA1c detection systems using biological variation and six sigma models
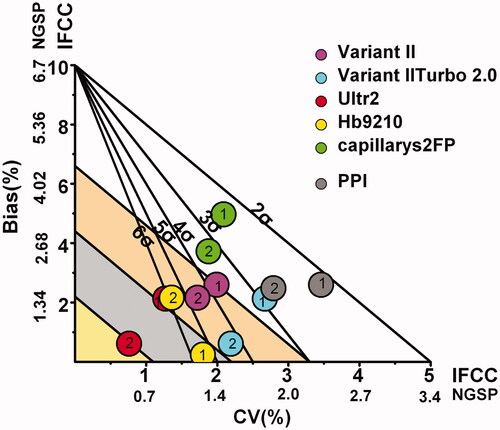
We constructed the biological variation and six sigma combined model and mapped the results from six HbA1c detection systems. We found that the detection performances of six HbA1c detection systems for high-concentration samples were more stable. Moreover, σ values and biological variation grades were higher for high-concentration sample than those for low-concentration samples. For Ultra2, the two concentrations were at the “optimum” and “minimum” regions on the evaluation charts of biological variability and at the “6σ” region on the six sigma performance evaluation charts, which indicated that Ultra2 system was the best detection system in our laboratory. For Hb9210 system, the two concentrations were at the “desirable” and “minimum” grades on the performance evaluation charts of biological variability and at the “5σ” region on the six sigma performance evaluation charts. The performance of Hb9210 system was good. For Variant II and Variant II Turbo 2.0, the high concentration was at the “minimum” level and the low concentration cannot meet the “minimum” level in the evaluation map of biological variation performance. In addition, for Capillarys 2FP and PPI, the two concentrations could not reach the “minimum” level in the biological variation performance evaluation chart ().
Figure 2. Models applied for five instruments (high and low concentrations).
Quality control method design and quality continuous improvement strategy
The quality control scheme was designed by using σ and OPSpecs diagrams and the quality was continuously improved according to QGI values. The results showed that the two concentrations of Ultra 2 and Hb9210 system only needed a loose and single-rule quality control scheme. The high concentration test of Variant II and Variant II Turbo 2.0 system needed a multi-rule quality control scheme(1 – 3 s/2 – 2 s (N = 4, R = 1 or N = 2, R = 2)). The high- and low-concentration test of Capillary 2FP and PPI system needed a “1 – 3 s/2 – 2 s/R = 2” quality control scheme. Capillary 2FP and PPI system needed a multi-rule quality control scheme to achieve the quality control objectives. The results also indicated that QGI values of Hb9210 system for the high and low concentration were 0.09 and 1.04 respectively and both the precision and accuracy needed to be improved. The QGI values of Variant II Turbo 2.0 and PPI system for high and low concentration were less than 0.8, which suggested that precision should be improved. At last, accuracy needed to be improved in Variant II and Capillary 2FP systems ().
Table 2. σ Values, quality control rules design and quality improvement measures for six HbA1c analyzers (1: 6.31% (number MM2068), 2: 9.64% (number MM2121)).
Discussion
The number of adults with diabetes in the world had reached 425 million according to the latest data released by the International Diabetes Federation (IDF) in 2017 and nearly 40% of the patients were missed [Citation10]. Therefore, early screening, early diagnosis and blood sugar management of diabetes mellitus based on an accurate and reliable index was particularly important. In recent years, the HbA1c has been wildly used to monitor blood sugar and drug effects and diagnose the diabetes. However, the detection results of the sample depended on the accuracy of the instruments. For example, When the CV% of the detection system was 3.4%, the test result of the specimen (true concentration was 6.1%) was 5.6–6.6%, which might meet the “diabetes” standard [Citation11]. Researchers also reported that a 0.5% bias might significantly increase the number of patients (true HbA1c concentration was 6.5%) diagnosed with diabetes [Citation12].
At present, clinical laboratories usually use conventional models to evaluate the acceptability of HbA1c detection system performance by CV%, Bias% and TE% and then compare the data to the quality targets. In this study, the performance of six HbA1c detection systems was evaluated by biological variation and six sigma models. Our results showed that the performance evaluation results of six HbA1c detection systems were acceptable in the conventional model; Ultra2, Hb9210 and Variant II systems were acceptable in the biological variation model; Ultra2, Hb9210, Variant II and Variant II Turbo 2.0 were acceptable in the six sigma model. Furthermore, we found that the biological variation model was more stringent. For example, the high concentration test of Hb9210 system was at the “6σ” region in the six sigma model. However, the results only met the “minimum” level in the biological variation model, which was consistent with the previous report of [Citation6].The reason was that the quality objectives of the two models were different. Once the intra-individual and inter-individual variations were determined, the quality objectives of the biological variation model were fixed. By contrast, the minimum acceptable level depended on the set of TAE, which indicated that six sigma model was relatively flexible and could set different quality objectives according to need. Moreover, we used the six sigma model to design an accurate quality control scheme based on the performance of the laboratory detection system, which could increasing efficiency and reduce the waste of quality control products. For example, Ultra2 system had reached the world's first-class level and a single quality control rule was enough for different concentrations. In addition, suitable quality control schemes could also be selected for different concentrations of the same detection system (Variant II system). At last, combining with σ measure and QGI analysis, we found that accuracy improvement was the main task of our laboratory.
In sum, biological variation and six sigma were excellent quality management models for evaluating the performance of laboratory HbA1c detection system. The application of six sigma theory could design personalized quality control programs and guide the continuous improvement of quality according to QGI.
Ethics approval
This article does not contain any studies with human participants performed by any of the authors.
Disclosure statement
No potential conflict of interest was reported by the authors.
Availability of data and materials
The datasets used during the present study are available from the corresponding author upon reasonable request.
Additional information
Funding
References
- American Diabetes Association. Executive summary: standards of medical care in diabetes–2014. Diabetes Care. 2014;37:S5–S13.
- Sandberg S, Fraser CG, Horvath AR, et al. Defining analytical performance specifications: Consensus Statement from the 1st Strategic Conference of the European Federation of Clinical Chemistry and Laboratory Medicine. Clin Chem Lab Med. 2015;53:833–835.
- Njoroge SW, Nichols JH. Risk management in the clinical laboratory. Ann Lab Med. 2014;34:274–278.
- Zhang C, Zhao H, Wang J, et al. The application of Six Sigma Techniques in the evaluation of enzyme measurement procedures in China. Clin Lab. 2015;61:461–465.
- Mason SE, Nicolay CR, Darzi A. The use of Lean and Six Sigma methodologies in surgery: a systematic review. Surgeon. 2015;13:91–100.
- Weykamp C, John G, Gillery P, et al. Investigation of 2 models to set and evaluate quality targets for hb a1c: biological variation and sigma-metrics. Clin Chem. 2015;61:752–759.
- Westgard JO, Westgard SA. The quality of laboratory testing today: an assessment of sigma metrics for analytic quality using performance data from proficiency testing surveys and the CLIA criteria for acceptable performance. Am J Clin Pathol. 2006;125:343–354.
- Westgard JO. Charts of operational process specifications (“OPSpecs charts”) for assessing the precision, accuracy, and quality control needed to satisfy proficiency testing performance criteria. Clin Chem. 1992;38:1226–1233; Discussion 1245–1250.
- Qiu HW, Ruan LM, Zhao YG. Normalized MEDx chart coupled with Quality Goal Index for evaluation of analytical quality achievements and quality shortcomings. A novel perspective to its further application. Clin Chim Acta. 2015;444:278–279.
- Cho NH, Shaw JE, Karuranga S, et al. IDF Diabetes Atlas: global estimates of diabetes prevalence for 2017 and projections for 2045. Diabetes Res Clin Pract. 2018;138:271–281.
- Weykamp C, Siebelder C. Evaluation of performance of laboratories and manufacturers within the framework of the IFCC model for quality targets of HbA1c. J Diabetes Sci Technol. 2018;12:747–752.
- Bruns DE, Boyd JC. Few point-of-care hemoglobin A1c assay methods meet clinical needs. Clin Chem. 2010;56:4–6.