
Abstract
Purpose
To evaluate the diagnostic effect of sequential detection of Adenosine deaminase (ADA) screening and T-SPOT assay on tuberculosis (TB) pleurisy in pleural effusion patients.
Materials and methods
248 pleural effusion patients (172 TB and 76 non-TB) were retrospectively analyzed in the study. The concentrations of ADA and lactate dehydrogenase (LDH) were measured in pleural fluids and serum samples of the patients. T-SPOTT assays were performed in pleural fluids. The relationship between ADA, T-SPOT and the occurrence of TB pleurisy was evaluated using logistic regression analysis.
Results
The level of pleural ADA and positive rate of T-SPOT were all higher in TB pleurisy group than non-TB pleurisy group (p < .001). The positive rate of T-SPOT detection reached 98.83% in the TB pleurisy group while only 40.7% in non-TB pleurisy group (p < .001). Additionally, 8 patients (4.65%) in the TB pleurisy group showed the level of pleurisy ADA exceeded 40 IU/L while only one patient (1.31%) in the non-TB pleurisy group.
Conclusion
The sequential detection of ADA screening and T-SPOT assay was found to be an accurate and rapid method for identifying TB pleurisy from pleural effusion, which would promote effective treatment.
Introduction
Tuberculosis (TB), a common infectious disease, still threatens public health worldwide, especially in developing countries [Citation1]. In China, the high incidence and prevalence of TB make it a serious public health problem that brings heavy financial and social burdens [Citation1]. To improve the diagnosis and treatment of TB has gotten more and more attention in recent years.
TB pleurisy is a major form of extra-pulmonary TB and a common cause of pleural effusion, also called lymphocyte-predominant exudates [Citation2]. Isolation of the Mycobacterium tuberculosis (MTB) from pleural effusion or pleural tissue is the gold standard for definitive diagnosis of TB pleurisy. However, TB pleurisy diagnosis using MTB culture has two disadvantages: long time to produce results and low diagnostic yield of effusion [Citation3]. Although pleural histology could be used to diagnose TB pleurisy, it is difficult for elderly patients and the tissue harvested procedures having a high risk of bleeding [Citation4]. Thus, convenient, rapid, and accurate testing methods are urgently needed.
Several biomarkers of pleurisy, including adenosine deaminase (ADA) and interferon-gamma release assays (IGRA), have been shown to assist the diagnosis of TB pleurisy [Citation5]. Pleural ADA levels above 40 IU/L are considered as an acceptable cutoff value for diagnosis of TB pleurisy [Citation6]. A recent meta-analysis showed that this is a relatively accurate method of diagnosing TB pleurisy [Citation7]. However, diagnosis of TB in patients whose level of ADA in pleural effusion is less than 40 IU/L still poses a challenge.
Over the past decade, IGRAs have been developed for diagnosis of TB [Citation8]. There are two types of IGRAs, the QuantiFERON-TB Gold In-Tube test (QFT-GIT) and the T-SPOT.TB blood test. Both of them have been approved by the Food and Drug Administration for indirect diagnosis of TB [Citation9]. Recently, several studies have shown IGRA to be a more useful for the diagnosis of TB infection [Citation10,Citation11]. A meta-analysis demonstrated that the overall sensitivity of IGRA was 89% and specificity was 97% [Citation12] for the diagnosis of TB. However, IGRA has some limitations with respect to clinical application. For example, the high cost and high-complexity.
Therefore, in the present study, we aimed to combine ADA assay and T-SPOT.TB test to explore a more feasible approach for diagnosis TB pleurisy.
Materials and methods
Study population and design
This retrospective analysis was conducted for 248 pleural effusion patients, who were treated in Daping Hospital, Third Military Medical University. All patients enrolled in this study suffered from pleural effusion of lymphocyte-predominant exudates. Lymphocyte-predominance was defined as effusion lymphocyte count >50% of the total nuclear cells or effusion cytology analysis revealing lymphocytosis [Citation13]. All patients have been confirmed using pleural biopsy and histopathological examination. The clinical features of patients including age, gender, location of pleural effusion, amount of effusion, and laboratory findings are listed in .
Table 1. Baseline characteristics of patients.
Chest imaging, including radiographs and computed tomography (CT) scans, was performed and independently reviewed by a pulmonologist and a radiologist. The amount of pleural effusion was classified as small if pleural opacity was less than one-third of one hemi-thorax on chest X-ray, moderate if it was between one-third and two-thirds of one hemi-thorax, and massive if it took up more than two-thirds of one hemi-thorax [Citation13].
This study was approved by the hospital’s Institutional Review Board and all patients have provided written informed consent in advance.
T-SPOT.TB for pleural effusion
T-SPOT.TB was carried out using ELISPOT kit (Oxford Immunotec Ltd., Oxford, U.K.) according to the manufacturer’s instructions [Citation14]. Briefly, mononuclear cells were separated from pleural effusion using Ficolle Hypaque, and then these cells were rewashed, counted, and cultured. The microplate wells had been stimulated early with mouse monoclonal anti-IFN-g antibody. Then, the wells were filled with 6 kDa secreted antigenic target (ESAT-6, also as T-SPOT A) or culture filtrate protein 10 (CFP10, as T-SPOT B), and phytohemagglutinin (positive control) or saline (negative control) and incubated with IFN-γ capture antibodies for 16 h. The spots created by activated cells were counted for each sample. Positive response of sample was defined as the 6 or more spots attributable to either T-SPOT A or B wells, and 5 spots or fewer for either T-SPOT A and B were considered negative.
Measurement of adenosine deaminase (ADA) and lactate dehydrogenase (LDH) in serum and pleural effusion
Morning fasting venous blood (3 ml) was collected and centrifuged at 4000 r/min for 10 min to separate serum. The pleural fluid samples were collected via thoracentesis. The activity of ADA and LDH were measured on a fully automated biochemistry analyzer (Olympus Au 2700, Japan), at the Department of Clinical Laboratory, Daping Hospital. The operation was performed in strict accordance with the standard SOP. All experiments were performed in accordance with the manufacturers’ protocols.
Statistical analysis
SPSS 17.0 software was used for all statistical analysis. All data were presented as mean (SE, 95% CI) or n (%). Statistical differences between groups were analyzed using students’ t-test or Wilcoxon rank-sum test for quantitative data and Chi-square test for categorical data. The relationship between the ADA, T-SPOT A, and T-SPOT B with the occurrence of tuberculous-related pleurisy was analyzed via logistic regression analysis. Based on the results of univariate logistic regression analysis, significant variables were incorporated into a multivariate logistic regression model. Receiver operating characteristic (ROC) curve was plotted to determine the diagnostic value of pleural effusion T-SPOT A and B. The optimal cut-off value was considered the point with the highest sensitivity and specificity. A p value <0.05 was considered as statistical significance.
Result
Character of patients
In this study, we collected 248 patients who suffered from pleural effusion, which was lymphocyte-predominant exudate by previous thoracentesis. Among these patients, 172 had been diagnosed with tuberculous (TB) pleuritic by pleural biopsy and histopathological examination. Besides, in the 76 non-TB pleuritic patients, 64 (84.21%) were diagnosed with malignant pleural effusion.
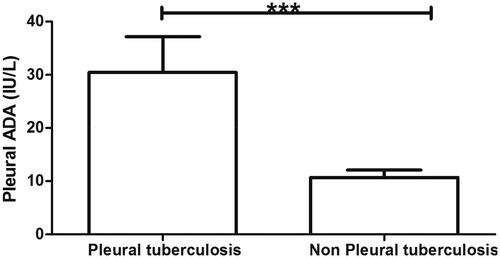
The characteristics of patients are shown in . The mean age of 172 TB pleurisy patients was 43.5 years and the average age of 76 non-TB pleurisy patients was 66.50 (p < .001). The proportion of female in TB pleurisy group was higher than in non-TB pleurisy group (73.83% vs 53.94%, p = .003). There were no significant differences in serum ADA and LDH, location or amount of effusion, or ESR between TB pleurisy and non-TB pleurisy groups (all, p > .05). The level of pleural ADA was higher in TB pleurisy group than non-TB pleurisy group (p < .001) (). The pleural ADA values over 40 IU/L suggested TB pleural effusion. In this study, eight patients (4.65%) in the TB pleurisy group showed the level of pleurisy ADA exceeded 40 IU/L. While only one patient (1.31%) in the non-TB pleurisy group showed the pleurisy ADA value exceeded 40 IU/L. These data suggested that the levels of pleurisy ADA were more than 40 IU/L in 88.89% (8/9) of patients who could be diagnosed as TB pleural effusion. However, the pleurisy ADA level of most patients was less than 40 IU/L in this study. Thus it is hardly to judge whether these patients are TB pleural effusion only using the level of ADA. Moreover, from , we observed that the crude positive rate of T-SPOT reached 98.83% in the TB pleurisy group, compared to 40.7% in the non-TB pleurisy group (p < .001). Meanwhile, the level of T-SPOT A and B values was significantly higher in the TB pleurisy group than in the non-TB pleurisy (p < .001).
Figure 1. The comparison of pleural ADA levels between TB group and non-TB group. ***: p < .001.
Evaluation of the T-SPOT blots in the patients with ADA < 40 IU/L
Additionally, the blot numbers of T-SPOT A and B were analyzed in both the TB and non-TB pleurisy groups. The positive rate of T-SPOT A in the TB pleurisy group was 78.6% while 12% in non-TB pleurisy group. The positive rate of T-SPOT B in the TB pleurisy group and non-TB pleurisy group were 81.7% and 14.7%, respectively (; ). These data demonstrated that there were visibly more blots attributable to T-SPOT A and B in the TB pleurisy group than in the non-TB pleurisy group (p < .01).
Figure 2. The positive rate of T-SPOT. A and B in TB and non-TB groups. ***: p < .001.
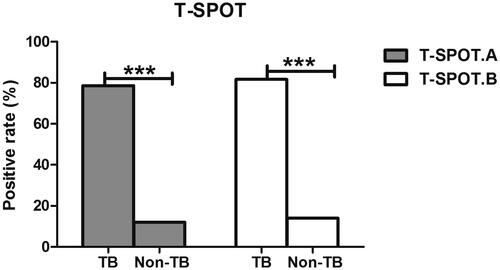
Table 2. The positive rate of T-SPOT.
Correlation of pleurisy ADA, T-SPOT A and B with TB pleurisy
The correlation of pleurisy ADA level and the number of T-SPOT A and B blots with TB pleurisy was analyzed using logistic regression. Both the univariate and multivariate analyses showed that pleurisy ADA level and the number of T-SPOT A and B blots were associated with TB pleurisy () (all, p < .01). These data suggested that the level of pleurisy ADA and number of T-SPOT A and B blots were predictive of TB pleurisy ().
Table 3. Logistic regression analysis.
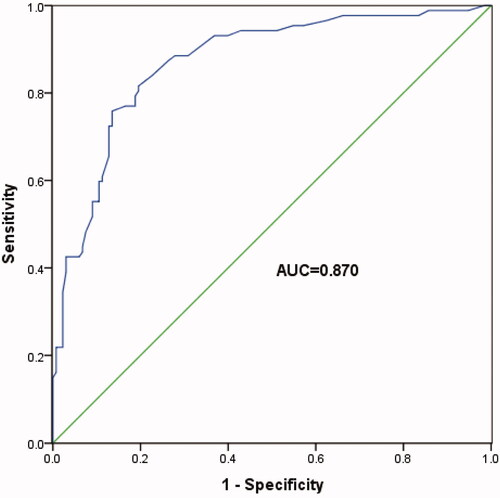
ROC curve analysis was used to further study the diagnostic role of T-SPOT A and B in TB pleurisy. These data showed that the number of T-SPOT A blots >8 indicated TB pleurisy with a specificity of 72.7% and sensitivity of 91.0% (, AUC = 0.822, 95% CI: 0.692–0.952, p < .001). Besides, the number of T-SPOT B blots >5 indicated TB pleurisy with a specificity of 77.3% and sensitivity of 95.5% (, AUC = 0.870, 95% CI: 0.761–0.979, p < .001). These findings indicated that T-SPOT A and B were good diagnostic predictors of TB pleurisy in patients whose pleurisy ADA levels are below 40 IU/L.
Figure 3. ROC analysis based on the number of T-SPOT A blots in patients with pleurisy ADA levels below 40 IU/L. The area under the curve (AUC) was 0.822, with the sensitivity of 91.0% and specificity of 72.7%.
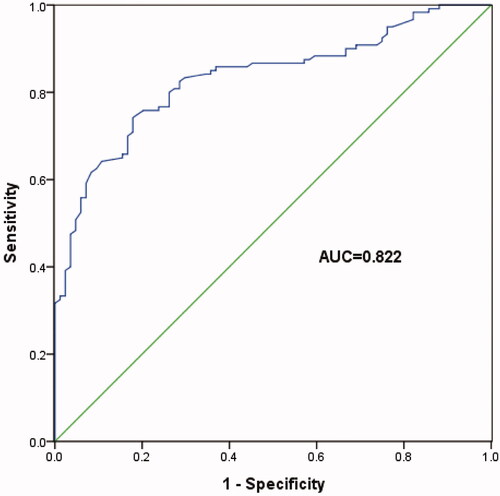
Figure 4. ROC analysis based on the number of T-SPOT B blots in patients with pleurisy ADA levels below 40 IU/L. The area under the curve (AUC) was 0.870, with the sensitivity of 95.5% and specificity of 77.3%.
Discussion
In this study, the level of pleurisy ADA and positive rate of T-SPOT were visibly higher in TB pleurisy group than in the non-TB pleurisy group. Patients with pleural effusion had a greater probability of being diagnosed with TB pleurisy if their level of pleurisy ADA was over 40 IU/L. Among the patients with the levels of pleurisy ADA less than 40 IU/L, the number of blots for T-SPOT A and B were both higher in TB pleurisy group than in non-TB pleurisy group. Furthermore, the level of pleurisy ADA and number of T-SPOT A and B blots were significantly closely correlated with the occurrence of TB pleurisy, and T-SPOT A and B may be suitable diagnostic indicators of TB pleurisy.
Several studies have shown that ADA is a useful biomarker for the diagnosis of TB pleurisy due to its simplicity, rapidity, and low finical costs [Citation13,Citation15,Citation16]. The most widely used cutoff value of ADA for the diagnosis of TB pleurisy is 40 IU/L [Citation7,Citation16]. In our study, we found that 40 IU/L pleurisy ADA is a suitable cutoff value for the diagnosis of TB pleurisy. However, only 4.65% TB pleurisy patients had levels over 40 IU/L, majority of the patients were less than 40 IU/L. These data suggested that cutoff values of 40 IU/L for pleurisy ADA did not satisfy the diagnosis of TB pleurisy patients. Liu and his colleagues showed 30 IU/L ADA to be a suitable cutoff value for TB pleurisy diagnosis [Citation17]. A study that used ROC curve analysis on Chinese patients showed that the optimal cutoff value of ADA was 15.5 IU/L, far lower than the 40–60 IU/L reported in other studies. This may be attributable to ethnicity and age. Goto et al. published a meta-analysis showing the diagnosis of TB pleurisy by pleurisy ADA was worse in East Asian than in European [Citation18]. Keng’s study suggested that ADA levels were negatively correlated with age. Because elderly patients with TB pleurisy may have impaired inflammatory response, which may increase the level of pleurisy ADA [Citation13,Citation19]. Methodological differences in the detection of ADA may lead to the variability of pleural ADA cutoff values for the diagnosis of TB pleurisy [Citation7,Citation20].
T SPOT is an excellent biomarker for diagnosis of active TB [Citation21] and breast TB [Citation22]. Zhu and his colleagues showed T-SPOT to be suitable for screening extra-pulmonary TB, including pleurisy TB [Citation23]. Losi et al. indicated the high diagnostic sensitivity of T-SPOT.TB made it a strong option for the diagnosis of active pleurisy TB [Citation14]. Another study showed that T-SPOT.TB may be better than ADA and tuberculin skin tests (TSTs) for the diagnosis of extra-pulmonary TB [Citation24,Citation25]. Consistent with these reports, our study showed a higher positive rate of T-SPOT in TB pleurisy group than in non-TB pleurisy group. The positive rate of T-SPOT was 40.7% in patients with non-TB pleurisy. Most of the patients with non-TB pleurisy were diagnosed with malignant pleural effusion.
In this study, most patients had ADA pleurisy levels below 40 IU/L, it may be useful to use T SPOT to identify patients with TB pleurisy or exclude those with non-TB pleurisy. The present findings suggest that T-SPOT is a strong diagnostic predictor of TB pleurisy. Zhai et al. pointed out that T-SPOT was not sufficient for diagnosis of TB pleurisy given its high cost, demanding technique, and difficulty of interpretation [Citation2]. Although T-SPOT places a high-cost burden on China’s less-developed western region, it is worth to diagnose TB pleurisy promptly, which would be benefit for timely diagnosis of pleural effusion and reduce hospital costs. Based on these data, we performed the sequential diagnosis of TB pleurisy in which ADA detection served as the first line indicator for screening the pleural effusion and then T-SPOT was analyzed in patients whose level of pleurisy ADA was less than 40 IU/L. In the current study, the levels of T-SPOT A and B were significantly closely correlated with the occurrence of TB pleurisy. ROC indicated that T-SPOT A and B for the diagnosis TB pleurisy is with high sensitivity and specificity in patient with ADA below 40 IU/L. These data suggested that this sequential detection of ADA and T-SPOT were suitable for the diagnosis of TB pleurisy, but the technique needs further verification through study of larger populations.
There are several limitations in the current study. First, only a few patients had ADA levels over 40 IU/L. Second, the majority of patients were elderly. These factors might cause bias to the results and further studies are needed to confirm the findings. In addition, the relatively small sample size might reduce the statistical power of our results. The application of ADA and T-SPOT for diagnosis of TB pleurisy might cause diagnostic errors. Thus, ADA and T-SPOT might be employed as an auxiliary tool for early screening and detection of TB among patients with pleural effusion. The final diagnosis of TB should be made according to the pleural biopsy and histopathological examinations.
In conclusion, ADA and T-SPOT were found to be suitable biomarkers for the diagnosis of TB pleurisy. The sequential detection of ADA screening and T-SPOT assay is an accurate and rapid method of identifying TB pleurisy from pleural effusion, facilitating the provision of effective treatment.
Authors’ contributions
Mingxia Feng and Guoqiang Cao designed the study and collected data from the patients. Fenfen Sun and Fang Wang analyzed the data. Mingxia Fen and Fenfen Sun drafted the manuscript. All authors have approved the final version of the manuscript.
Acknowledgments
We would like to thank LetPub (www.letpub.com) for its linguistic assistance during the preparation of this manuscript.
Disclosure statement
No potential conflict of interest was reported by the authors.
Additional information
Funding
References
- Zumla A, George A, Sharma V, et al. WHO's 2013 global report on tuberculosis: successes, threats, and opportunities. Lancet. 2013;382:1765–1767.
- Zhai K, Lu Y, Shi HZ. Tuberculous pleural effusion. J Thorac Dis. 2016;8:E486–E494.
- Ruan SY, Chuang YC, Wang JY, et al. Revisiting tuberculous pleurisy: pleural fluid characteristics and diagnostic yield of mycobacterial culture in an endemic area. Thorax. 2012;67:822–827.
- Porcel JM. Tuberculous pleural effusion. Lung. 2009;187:263–270.
- Villegas MV, Labrada LA, Saravia NG. Evaluation of polymerase chain reaction, adenosine deaminase, and interferon-gamma in pleural fluid for the differential diagnosis of pleural tuberculosis. Chest. 2000;118:1355–1364.
- Valdes L, Alvarez D, Valle JM, et al. The etiology of pleural effusions in an area with high incidence of tuberculosis. Chest. 1996;109:158–162.
- Liang QL, Shi HZ, Wang K, et al. Diagnostic accuracy of adenosine deaminase in tuberculous pleurisy: a meta-analysis. Respir Med. 2008;102:744–754.
- Kang YA, Lee HW, Yoon HI, et al. Discrepancy between the tuberculin skin test and the whole-blood interferon gamma assay for the diagnosis of latent tuberculosis infection in an intermediate tuberculosis-burden country. JAMA. 2005;293:2756–2761.
- Mazurek GH, Jereb J, Vernon A, et al. Updated guidelines for using Interferon Gamma Release Assays to detect Mycobacterium tuberculosis infection – United States, 2010. MMWR Recomm Rep. 2010;59:1–25.
- Bakir M, Millington KA, Soysal A, et al. Prognostic value of a T-cell-based, interferon-gamma biomarker in children with tuberculosis contact. Ann Intern Med. 2008;149:777–787.
- Diel R, Loddenkemper R, Niemann S, et al. Negative and positive predictive value of a whole-blood interferon-gamma release assay for developing active tuberculosis: an update. Am J Respir Crit Care Med. 2011;183:88–95.
- Jiang J, Shi HZ, Liang QL, et al. Diagnostic value of interferon-gamma in tuberculous pleurisy: a metaanalysis. Chest 2007;131:1133–1141.
- Keng LT, Shu CC, Chen JY, et al. Evaluating pleural ADA, ADA2, IFN-gamma and IGRA for diagnosing tuberculous pleurisy. J Infect. 2013;67:294–302.
- Losi M, Bossink A, Codecasa L, et al. Use of a T-cell interferon-gamma release assay for the diagnosis of tuberculous pleurisy. Eur Respir J. 2007;30:1173–1179.
- Wu YB, Ye ZJ, Qin SM, et al. Combined detections of interleukin 27, interferon-gamma, and adenosine deaminase in pleural effusion for diagnosis of tuberculous pleurisy. Chinese Med J. 2013;126:3215–3221.
- Garcia-Zamalloa A, Taboada-Gomez J. Diagnostic accuracy of adenosine deaminase and lymphocyte proportion in pleural fluid for tuberculous pleurisy in different prevalence scenarios. PloS One. 2012;7:e38729.
- Liu YC, Shin-Jung Lee S, Chen YS, et al. Differential diagnosis of tuberculous and malignant pleurisy using pleural fluid adenosine deaminase and interferon gamma in Taiwan. J Microbiol Immunol Infect. 2011;44:88–94.
- Goto M, Noguchi Y, Koyama H, et al. Diagnostic value of adenosine deaminase in tuberculous pleural effusion: a meta-analysis. Ann Clin Biochem. 2003;40:374–381.
- Pan L, Jia H, Liu F, et al. Risk factors for false-negative T-SPOT.TB assay results in patients with pulmonary and extra-pulmonary TB. J Infect. 2015;70:367–380.
- Dheda K, van Zyl-Smit RN, Sechi LA, et al. Utility of quantitative T-cell responses versus unstimulated interferon-{gamma} for the diagnosis of pleural tuberculosis. Eur Respir J. 2009;34:1118–1126.
- Yan L, Xiao H, Han M, et al. Diagnostic value of T-SPOT.TB interferon-gamma release assays for active tuberculosis. Exp Therap Med. 2015;10:345–351.
- Zhong L, Zhou XL, Li J, et al. The T-SPOT.TB test for diagnosis of breast tuberculosis. Lab Med. 2015;46:14–19.
- Zhu C, Liu Z, Li Z, et al. The performance and limitation of T-SPOT.TB for the diagnosis of TB in a high prevalence setting. J Thorac Dis. 2014;6:713–719.
- Lee YM, Park KH, Kim SM, et al. Risk factors for false-negative results of T-SPOT.TB and tuberculin skin test in extrapulmonary tuberculosis. Infection. 2013;41:1089–1095.
- Zhou Q, Chen YQ, Qin SM, et al. Diagnostic accuracy of T-cell interferon-gamma release assays in tuberculous pleurisy: a meta-analysis. Respirology. 2011;16:473–480.