
Abstract
Long non-coding RNAs (lncRNAs) act as a member of competing endogenous RNAs (ceRNAs) and plays a significant role in tumorigenesis. The aim of this study was to identify potential lncRNA biomarkers for predicting the prognosis of lung squamous cell carcinoma (LUSC) using a comprehensive analysis of lncRNA mediated ceRNA network. Differentially expressed RNAs datasets were obtained using edge R package in 502 LUSC tissues and 49 adjacent non-LUSC tissues from the Cancer Genome Atlas (TCGA). Gene Ontology (GO) and Kyoto Encyclopedia of Genes and Genomes (KEGG) pathway analysis were performed to identify functional enrichment implication of lncRNA related differentially expressed mRNAs. Survival analysis was used Kaplan-Meier curve method. Univariate and multivariate Cox regression analysis were performed to construct a predictive model with lncRNA biomarkers. A total of 2185 lncRNAs, 170 miRNAs and 2053 mRNAs were differentially expressed between LUSC tissues and adjacent non-LUSC tissues. The novel constructed ceRNA network incorporated 184 LUSC-specific lncRNAs, 18 miRNAs, and 49 mRNAs. About 11 of 184 differentially expressed lncRNAs and 1 of 18 differentially expressed miRNAs and 5 of 49 differentially expressed mRNAs were conspicuously related to overall survival (p < .05). Univariate and multivariate cox regression analysis showed that 6 lncRNAs were retrieved to construct a predictive model to predict the overall survival in LUSC patients. In conclusion, CeRNAs contributed to the progression of LUSC and a model with 6 lncRNAs might be potential biomarker for predicting the prognosis of LUSC.
Introduction
Lung cancer is the most leading cause of cancer-related death worldwide [Citation1]. Lung squamous cell carcinoma (LUSC) accounts for about 30% of non-small cell lung cancer (NSCLC) and causes 400,000 deaths annually worldwide [Citation2]. LUSC still has a poor prognosis, with 40% of 5-year survival rate for TNM stage II and <5% for TNM stage IV [Citation3]. Recently, the prognostic biomarkers for LUSC patients is still lacking [Citation4,Citation5]. Therefore, it is urgently needed to identify effective and promising biomarkers in predicting the prognosis of LUSC.
Long non-coding RNAs (lncRNAs) are defined as transcripts longer than 200 bp without protein-coding potential [Citation6]. lncRNAs may play significant roles in varieties of biological functions during the tumorigenesis and metastasis of cancer [Citation7]. In recent years, lncRNA-miRNA- mRNA ceRNA network has been demonstrated to involve in lung cancer [Citation8], cervical squamous cell carcinoma [Citation9], pancreatic adenocarcinoma [Citation10], head and neck squamous carcinoma [Citation11], breast cancer [Citation12], colon adenocarcinoma [Citation13], clear cell renal cell carcinoma [Citation14], ovarian cancer [Citation15], and so on. MiRNAs have been highly evolutionarily conserved and can interact with the target mRNA to silence the gene [Citation16,Citation17]. In molecular biology, competing endogenous RNAs (ceRNAs) regulate other RNA transcripts by competing for shared miRNAs. Because the lncRNAs and mRNAs share the common miRNA response elements (MREs), a complex network of lncRNA-miRNA-mRNA is becoming essential for the regulation of RNA expression [Citation18]. In detail, lncRNAs act as “molecular sponge” directly or indirectly bind to miRNAs competitively, which would eventually result in the weakness of interaction between miRNAs and mRNAs [Citation19].
Recently, six ceRNAs (PLAU, miR-31-5P, miR-455-3P, FAM83A-AS1, MIR31HG and MIR99HG) have been demonstrated to be significantly associated with overall survival of LUSC using the Cancer Genome Atlas (TCGA) database [Citation8]. However, they only obtained prognostic ceRNAs and were not performed to construct a predictive model in their study. In this present study, we firstly constructed a ceRNA network to identify LUSC-specific ceRNAs using RNA sequencing data from the TCGA database. Thereafter, we established and validated a novel combined model to predict the prognosis of LUSC patients.
Materials and methods
Patients and TCGA data collection
We used the TCGA data portal (https://portal.gdc.cancer.gov/) to retrieve RNA transcription data of 551 tissues patients with LUSC including cases of 502 tumor tissues and cases of 49 adjacent non tumor tissues. The clinical feature of LUSC patients is shown in . The clinical feature of LUSC patients including age, gender, race, pathology stage and pathology T, N, M stage. The TCGA dataset is publically available, including more than two types of gene expression data, which intend to improve the early diagnosis and therapy of cancers. Our present study was consistent with the publication guidelines of TCGA database (http://cancergenome.nih.gov/publications/publicationguidelines). Because the RNA sequencing data were obtained directly from the TCGA, no ratification was required from the Ethics Committee.
Table 1. The clinical feature data of LUSC patients.
RNA sequence data retrieval
We used the TCGA data portal GDC (https://portal.gdc.cancer.gov/cart) to download the RNA transcription data (level 3) of 551 LUSC patients. The RNA and miRNA transcription data from 551 LUSC patients were obtained from the Illumina HiSeq_RNA-Seq and Illumina HiSeq_miRNA-Seq sequencing platforms; all the data were retrieved freely. Five hundred and fifty-one patients were divided into two cohorts, including cases of 502 tumor tissues and cases of 49 adjacent non tumor tissues. In this research, we used the Perl and R language for analyzing and coping with RNA sequencing data.
Identification of differential expression mRNAs, miRNAs and lncRNAs in LUSC
We used the Ensembl database (http://www.ensembl.org/index.html, version 89) to identify mRNAs and lncRNAs. In this research, we excluded mRNAs and lncRNAs that were not included in the Ensembl database. We obtained the differentially expressed mRNAs, miRNAs and lncRNAs by using the “edge R” packages in R software with absolute fold change (log 2) >2 and adjusted the false discovery rate (FDR) to a p values <.01 to correct the statistical significance of multiple experiments. For the obtained DEmRNAs, DEmiRNAs and DElncRNAs, we used the gplots and heat map packages to draw volcano maps and heat maps.
Construction of lncRNA-miRNA-mRNA regulatory network in LUSC
To better comprehend the relationships between differentially expressed mRNAs, miRNAs and lncRNAs, the lncRNA mediated ceRNA network in LUSC was constructed. The ceRNA network was based on the theory that by using shared microRNA response elements, lncRNA can act as miRNA sponges to bind miRNAs competitively to modulate the expression of the mRNAs. We constructed the ceRNA network by following the steps below. First, we used the miRCode database (http://www.mircode.org/) to predict relationships between lncRNAs and miRNAs. Next, miRTarBase [Citation20] (http://mirtarbase.mbc.nctu.edu.tw/), miRDB [21] (http://www.mirdb.org/) and TargetScan [Citation22] (http://www.targetscan.org/) databases were performed to obtain miRNA targeted mRNAs. We showed miRNA-targeted mRNA in only three databases to establish a lncRNA-miRNA-mRNA network to improve the effectiveness of our results. Finally, Cytoscape (http://www.cytoscape.org/) 3.6.1 software was used for visualizing map the results.
Survival analysis and construction of lncRNA related predictive model
The survival R packages (https://CRAN.Rproject.org/package=survival, Version:3.51-3) were performed for survival analysis of all differentially expressed RNAs in the ceRNA network. We identified the lncRNAs associated with overall survival (p < .05) to act as prognostic lncRNA signature candidates to subject to multivariate Cox regression analysis. On the basis of the median risk score, LUSC patients were divided into two cohorts, including high risk cohorts and low risk cohorts. Receiver operating curve were used for testing the effect of the lncRNA signature (high risk vs. low risk) on overall survival. We performed the receiver operating curve by calculating the area under the curve (AUC) under the binomial exact confidence interval to reveal prognostic biomarkers for predicting survival in LUSC.
Functional enrichment analysis of differentially expressed mRNAs in LUSC
To figure out function represented in the gene profile, the annotation, visualization and integrated discovery (DAVID) database was used for analyzing the functional enrichment of lncRNA related differentially expressed mRNAs in ceRNA network by GO and KEGG pathway analysis. We used KOBAS database to carry out for those differentially expressed mRNAs in the network. In the GO analysis, a p values of <.05 was considered as statistically significant. Furthermore, The GOCircle and GOChord plotting functions of the GOplot R package are used to allow data including analysis from expression analysis and data obtained from functional annotation enrichment analysis. In the KEGG pathway analysis, a p values of <.05 was used regarded as statistically significant. We use “cluster profile R” package to conduct KEGG pathway analysis. Meanwhile, in order to provide a visible graphic that represented the interactions of DEmRNAs and relative KEGG pathway, the gene pathway network was established by using Cytoscape3.6.1.
The prognostic lncRNA-miRNA-mRNA ceRNA Sub-network in LUSC
To figure out the regulatory mechanism between prognostic lncRNA, miRNA and mRNA, we extracted prognostic differentially expressed RNAs to construct a sub-network using Cytoscape3.6.1.
Statistical analysis
All statistical analysis was carried out R software (version 3.5.1). We used the survival R packages (https://CRAN.R-project.org/package=survival,Version:3.51-3) to conduct survival analysis. The multivariate cox regression analysis was used for identifying DElncRNA in ceRNA network who can act as a prognostic factor to predict the early diagnosis and prognosis of LUSC. p < .05 was considered statistically significant unless otherwise stated.
Results
Differentially expressed RNAs in LUSC
A total of 551 samples were collected in this research, including 502 LUSC tumor tissues and 49 normal tissues. On the basis of the cut-off criteria (fold change >2 and p < .01), 2053 differentially mRNAs, 2185 differentially lncRNAs, 170 differentially miRNAs were identified between LUSC tissues and normal tissues. According to the standard, 1263 upregulated and 790 down-regulated mRNAs, 1777 up-regulated and 408 down-regulated lncRNAs, 143 up-regulated and 27 down-regulated miRNAs were identified. The top 25 up and down regulated DE lncRNAs, DEmiRNAs and DEmRNAs are shown in . To show the distribution of all differentially expressed RNA in the dimensions of -log (FDR) and logFC, we used the volcano plot (). The heat map of clustering analysis showed that all differentially expressed RNAs between LUSC tissues and normal tissues ().
Figure 1. Volcano maps and heat maps of differentially expressed RNAs between lung squamous cell carcinoma tissues and normal tissues. (A) Volcano plot of LUSC-specific lncRNAs. (B) Volcano plot of LUSC-specific miRNAs. (C) Volcano plot of LUSC-specific mRNAs. (D) The hierarchical clustering heat maps of LUSC-specific lncRNAs. (E)The hierarchical clustering heat maps of LUSC-specific miRNAs. (F) The hierarchical clustering heat maps of LUSC-specific mRNAs.
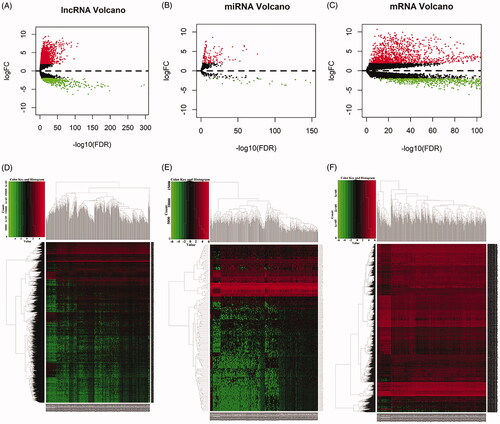
Table 2. The differentially expressed lncRNAs in lung squamous cell carcinoma patients.
Table 3. The differentially expressed mRNAs in lung squamous cell carcinoma patients.
Table 4. The differentially expressed miRNAs in lung squamous cell carcinoma patients.
Construction of a lncRNA mediated ceRNA network in LUSC
To better comprehend the role of differentially expressed lncRNAs, miRNAs and mRNAs in LUSC, we constructed a lncRNA mediated ceRNA regulatory network to elucidate the interaction between these differentially expressed RNAs. First, we applied 4012 differentially expressed lncRNAs searched from the miRCode database and displayed 699 pairs of interplay lncRNAs and miRNAs using the Perl language. We identified that 18 of the 170 retrieved DEmiRNAs could interplay with 184 differential expression lncRNAs. The representative interactions between lncRNAs and miRNAs in LUSC patients is shown in . Subsequently, the 820 mRNAs which were targeted by 18 DEmiRNAs were predicted performing miRTarBase [Citation20] (http://mirtarbase.mbc.nctu.edu.tw/), miRDB [Citation21] (http://www.mirdb.org/) and TargetScan [Citation22] (http://www.targetscan.org/). The representative relationships between miRNAs and mRNAs in LUSC patients is shown in . The results showed that 49 mRNAs were incorporated in the construction of lncRNA mediated ceRNA network (). Eventually, we constructed the lncRNA mediated ceRNA network of LUSC, including 184 DElncRNAs, 18 DEmiRNAs, 49 DEmRNAs, as shown in . A flow diagram of ceRNA network construction in LUSC is shown in .
Figure 2. Venn diagram of mRNAs included in ceRNA network and construction of lncRNA-miRNA-mRNA network in LUSC. (A) The red area represents the number of differentially expressed mRNA, the blue area shows the number of targets differentially expressed mRNAs. The purple area in the middle indicates the number of mRNAs which both belonged to the differentially expressed mRNAs and the target mRNAs. (B). The lncRNAs, miRNAs and mRNAs were represented by diamonds, rounded rectangles and ellipses, respectively. The red nodes indicate high expression, and the blue nodes indicate low expression.
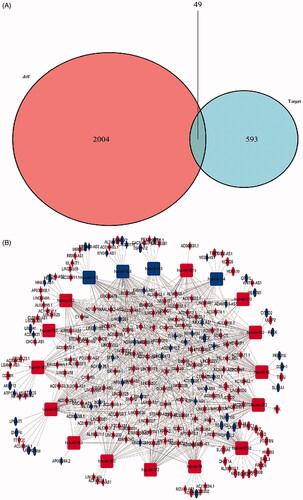
Figure 3. A flow diagram of ceRNA network construction in LUSC. DEmRNAs, DEmiRNAs and DElncRNAs with fold change >2 and p values <0.01 were used; lncRNA-miRNA interaction was predicted by miRcode; lncRNAs that were not associated with DEmiRNAs were removed. mRNAs targeted by miRNA using miRDB, miRTarBase and TargetScan databases; mRNAs that were not DEmRNAs were removed; ceRNA network was constructed.
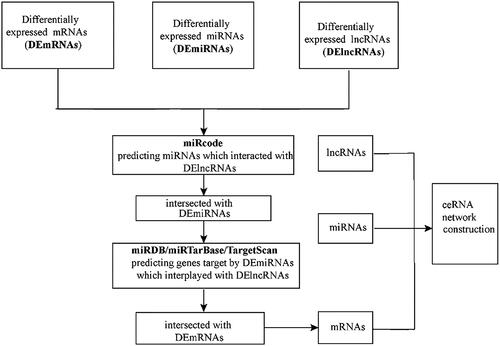
Table 5. Representative relationships between lncRNAs and miRNAs in lung squamous cell carcinoma patients.
Table 6. Representative relationships between miRNAs and mRNAs in lung squamous cell carcinoma.
Identification of survival-related RNAs in ceRNA network in LUSC
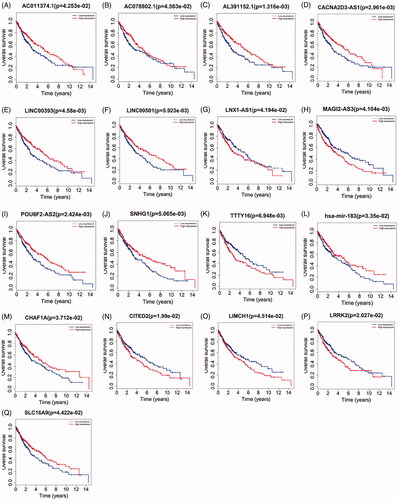
To elucidate the lncRNAs, miRNAs and mRNAs with prognostic characteristic, we evaluated the association between lncRNAs, miRNAs, mRNAs expression and overall survival in LUSC patients by using survival R packages. The results showed that a total of 11 out of 184 DElncRNAs were significantly associated with overall survival (p < 0.05) (). Only one DEmiRNA (hsa-mir-183) was associated with LUSC overall survival (). A total of 5 out of 49 DEmRNAs incorporating CITED2, CHAF1A, LIMCH1, LRRK2, SLC16A9 were obviously associated with LUSC overall survival (p < 0.05) ().
Figure 4. Kaplan–Meier curve analysis of DElncRNAs, DEmRNAs, DEmiRNAs and overall survival rate in LUSC samples.
Construction of predictive model of six-lncRNAs in LUSC patients
Univariate cox regression analysis was first performed to identify prognosis associated with lncRNAs in LUSC, incorporating 18 lncRNAs that were conspicuously associated with overall survival (p < 0.05). Next, multivariate cox regression was used, and showed that six lncRNAs were eventually selected to construct a predictive model. We used the linear combination of the expression of the 6 lncRNAs to construct the predictive model. The relative coefficient which were weighted in the multivariate cox regression were as follows: survival risk score = (0.1200 × expression value of ADAMTS9-AS2 + 0.2166 × expression value of AC011483.1 + 0.1142 × expression value of TTTY16 + 0.0988 × expression value of AC006238.1 + (−0.0699) × expression value of LINC00462 + (−0.0940) × expression value of CACNA2D3-AS1). Multivariate cox analysis in .
Table 7. Multivariate cox regression analysis of 6 prognostic lncRNAs associated with overall survival in LUSC patients.
Risk groupings and ROC curve analysis
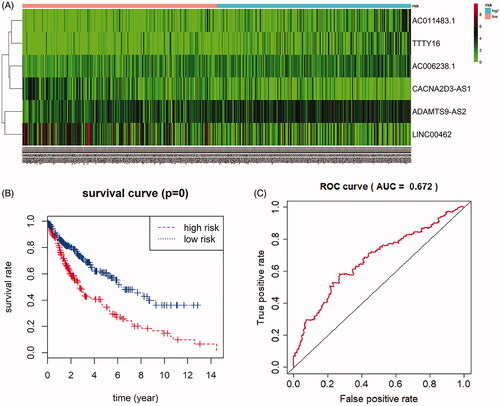
As is shown in the heat-map, expression of six prognostic lncRNAs were profiled (). Based on the median risk scores, a total of 495 samples of complete survival information were divided into a high-risk group (n = 247) and a low risk group (n = 248). We used Kaplan–Meier curve with a Log-rank statistical examine to perform survival analysis. As is shown in the , patients in the low risk group had conspicuously better overall survival than in the high-risk group (). Receiver operating characteristic (ROC) curve was analyzed for testing the influence on the 6-lncRNA signature associated with overall survival in LUSC ().
Figure 5. Prognostic value of six-lncRNAs in LUSC patients. (A). A risk heat-map established from 6 lncRNAs from 551 LUSC patients. (B). Kaplan-Meier curve analysis for OS (overall survival) of LUSC patients using the 6 lncRNAs signature. (C). ROC curve analysis of the prognostic 6 lncRNAs signature.
Enrichment analysis of functional implication of differentially expressed mRNAs signature in LUSC
To elucidate the biological function of lncRNA related differentially expressed mRNAs, we performed enrichment analysis. Gene ontology analysis showed that there were 5 GOs with statistical difference (p < 0.05) and the highest GO biological process was:” GO:0005515 protein binding” (). shows the interaction between statistically difference top 30 mRNAs and their associated GO terms. The top 5 GO terms were shown in . Furthermore, as we can see in the , The KEGG pathway analysis was used the “cluster profile R” packages. showed that the top 10 pathways that mRNAs were most enriched in KEGG database. The KEGG pathways enriched by mRNAs are outlined in . The top 14 enriched KEGG pathways were used to construct “pathway-gene” network for KEGG visualized analysis (). p Values <0.05 was considered as statistically significant ().
Figure 6. Functional enrichment analysis of lncRNA-mediated differentially expressed mRNAs in LUSC. The outer circle represents the expression (logFC) of DElncRNA-related differentially expressed mRNAs in each enriched GO (gene ontology) terms: red dots which were on the each Go terms indicated the up-regulated differentially expressed mRNAs. Blue dots indicated the down-regulated differentially expressed mRNAs. The inner circle indicates the significance of GO terms (log10-adjusted p values). (A). The circle indicates the correlation between statistically top 30 differentially expressed mRNAs and their gene ontology terms. (B).
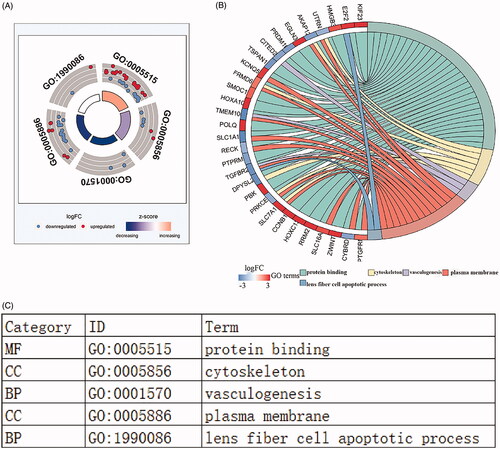
Figure 7. KEGG pathway analysis of differentially expressed mRNAs in LUSC. The top ten pathways lncRNA-related DEmRNAs in barplot and dotplot (A,B). The top 14 pathways were used cytoscape for constructing a pathway-gene network with differentially expressed mRNAs. The purple hubs indicate the pathways, the blue hubs indicate the down-regulated mRNAs, the red hubs indicate the up-regulated mRNAs (C).
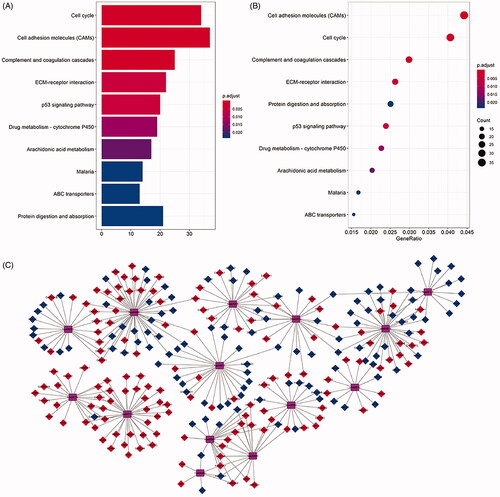
Table 8. The top 14 KEGG pathways enriched by differentially expressed mRNAs.
Prognostic DElncRNA mediated ceRNA in sub-network
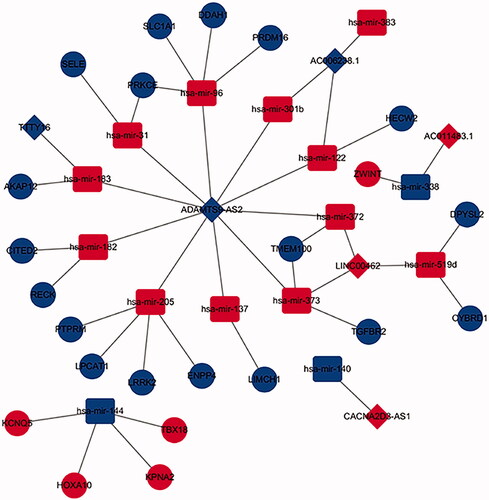
To figure out the interaction between prognostic lncRNAs, miRNAs and mRNAs in LUSC, we analyzed the prognostic DElncRNA mediated ceRNA network by using cytoscape3.6.1. As is shown in the , only 6 prognostics differentially expressed lncRNAs, 15 differentially expressed miRNAs and 23 differentially expressed mRNAs were showed in the DElncRNA-mediated ceRNA network.
Figure 8. The sub-network of DElncRNA mediated ceRNA network. The diamonds indicate DElncRNAs, the Ellipses indicate DEmRNAs, the rounded rectangles indicate DEmiRNAs. The red hubs indicate upregulation, the blue hubs indicate down regulation.
Discussion
In recent years, with the increasing numbers of advanced diagnosis and poor prognosis in lung squamous cell carcinoma, it is pivotal to find more effective prognostic biomarkers to predict survival in LUSC. LncRNA related studies have attracted the attention of varieties of cancer fields. Accumulating researches show that cancer-related lncRNAs may serve as diagnostic or predictive biomarkers of cancer and also have a significant effect on the therapeutic of cancer [Citation23]. However, the RNA sequencing data analysis associated with lncRNA profiles in LUSC is still lacking [Citation24]. Jing et al. have established lncRNA-miRNA-mRNA network in LUSC by using differentially expressed lncRNAs, miRNAs and mRNAs, and the ceRNA hypothesis [Citation25]. Only a few researches have showed that the lncRNA mediated ceRNA network can identify prognostic lncRNA biomarkers in LUSC [Citation26].
Accumulating evidence showed that lncRNAs act as a pivotal component ceRNA family to regulate other RNA transcripts in lncRNA mediated ceRNA network [Citation27]. LncRNA XIST functioned as a ceRNA by regulating miR-367/141-ZEB2 axis to promote TGF-B induced epithelial-mesenchymal transition in non-small cell carcinoma [Citation28]. LncRNA XIST was identified to act as ceRNA directly bind to miR-137 to facilitate NSCLC cell proliferation and invasion [Citation29]. lncRNA OGFRP1 modulated the expression of LYPD3 by sponging miR-124-3p to contribute to the progression of NSCLC [Citation30]. The upregulation of SNHG6 regulated E2F7 expression by sponging miR-26a-5p to facilitate the development of lung adenocarcinoma. The upregulation of long non-coding RNA SNHG6 was associated with overall survival in lung cancer progression [Citation31]. The lncRNA SNHG15 acts as a ceRNA to regulate YAP1-Hippo signaling pathway through binding to miR-200a-3p in papillary thyroid carcinoma [Citation32].
Recent studies showed that the roles of lncRNA in tumorigenesis and metastasis can indicate the lncRNA may function as a novel biomarker for the diagnosis and prognosis of cancer [Citation33]. lncRNA TUBA4B has been reported that it may serves as a newly predictor for prognosis and modulate the cell viability in non-small cell lung cancer [Citation34]. lncRNA AFAP1-AS1 may acts as an oncogenic to facilitate the migration of non-small cell lung cancer (NSCLC) [Citation35]. LncRNA SNHG1 may acts as an oncogene through ZEB1 signaling pathway by suppressing Tap63 in LUSC [Citation36]. lncRNA SNHG1 functions as an oncogene by inhibiting miR-101-3p to activate the Wnt/ß catenin signaling pathway in NSCLC [Citation37]. The ceRNA hypothesis has been raised as a newly regulatory mechanism functioning through miRNA competition [Citation17]. However, an integrated analysis of LUSC associated lncRNA-miRNA-mRNA network in a whole genome-wide, especially based on high throughput sequencing with a large-scale patient size, is still lacking. Therefore, it is pivotal to find the regulatory mechanism and biologic function of lncRNA-miRNA-mRNA ceRNA network in LUSC.
In the ceRNA network constructed in this article, we found that the low expression of the lncRNA ADAMTS9-AS2 is closely related to 10 miRNAs, including hsa-mir-96, hsa-mir-31, hsa-mir-182, hsa-mir-183, hsa-mir-205, hsa-mir-137, hsa-mir-372, hsa-mir-301b, hsa-mir-373 and hsa-mir-122. Our study found that a potential mechanism by which ADAMTS9-AS2 competes with hsa-mir-96 to regulate the expression of PRKCE, SLC1A1, DDAH1, PRDM16. However, several researches found that lncRNA ADAMTS9-AS2 was associated with the development of gliomas [Citation38], colorectal cancer [Citation39], gastric cancer [Citation40], ovarian cancer [Citation41]. ADAMTS9-AS2/miR-223-3P/TGFBR3 axis suppresses development of lung cancer [Citation42]. Based on these findings, ADAMTS9-AS2 may be involved in the invasion and migration of LUSC. Our research also found that the lncRNA AC011483.1 may act as a sponge to bind to hsa-mir-338 competitively to regulate the expression of ZWINT. Hsa-mir-338 may act as a cancer suppressor gene to inhibit the epithelial- mesenchymal transition and metastasis in human non small cell lung carcinoma [Citation43–45], which is in agreement with our results. In the present study, ADAMTS9-AS2/has-mir-182/RECK axis and ADAMTS9-AS2/hsa-mir-182/CITED2 axis may construct a ceRNA network were closely to play a significant role in the progression of lung squamous cell carcinoma. Hsa-mir-182 upregulation greatly contributes to lung squamous cell carcinoma [Citation46], which is the same as our results. A previous study shows that TTTY16 may act as a prognostic signature to cluster the patients with LUSC [Citation47].
In addition to ADAMTS9-AS2, TTTY16, we also found that several lncRNAs in the ceRNA network were closely associated with overall survival in LUSC patients. Six lncRNAs had a significant effect on survival. With the risk increased, some lncRNAs expression were changed obviously. From the survival analysis, ADAMTS9-AS2 and TTTY16 had been previously described as a novel prognostic biomarker and a therapeutic target for predicting the prognosis of NSCLC [Citation42,Citation47]. The remaining four lncRNAs have been identified to be associated with the diagnosis and prognosis of LUSC at the first time, which can provide a significant insight to explore novel prognostic biomarkers in the treatment of LUSC in the future.
Because of heterogeneity between patients, conventional prognostic systems often make inadequate predictions of risk groupings and estimates of clinical outcomes. Therefore, in recent years, many studies have been performed to construct a novel predictive model to predict survival in LUSC [Citation26,Citation48]. Compared with previous studies, our study for the first time obtained the differentially expressed mRNAs, miRNAs and lncRNAs using edge R package and used the miRcode database to predict the interactions between lncRNA and miRNA; Next, we performed the miRTarbase, Targetscan and miRDB to obtain miRNA targeted mRNAs. Finally, the lncRNA mediated ceRNA (lncRNA-miRNA-mRNA) network was constructed in LUSC. Then, univariate and multivariate cox regression analysis was performed to obtain prognostic lncRNA biomarkers in LUSC. In this study, we obtained 6 lncRNA signature that predicted survival in LUSC. These 6 lncRNAs were identified to construct a predictive model to predict the early diagnosis and prognosis of LUSC. Survival analysis based on linear combination of 6-lncRNA signature demonstrated that the high-risk cohorts had worse survival rate than the low risk cohorts. p = 0 was considered as most statistical significance compared to p < .05. The 6 lncRNA signature may performed well in the progression of LUSC.
In the present study, the GO analysis showed that the differential expression mRNAs were mostly enriched in protein binding, cytoskeleton, vasculogenesis, plasma membrane and lens fiber cell apoptotic process. The KEGG pathway analysis demonstrated that mostly differentially expressed mRNAs were enriched in cell adhesion molecules, cell cycle, complement and coagulation cascades, ECM-receptor interaction, protein digestion and absorption, p53 signaling pathway, drug metabolism-cytochrome P450, Arachidonic acid metabolism, Malaria and ABC transporters.
Our study subjects were retrieved from TCGA database, which indicate a significant tool for analyzing prognostic biomarkers, it is not known whether our results are applicable to our groups. The predictive prognostic lncRNA signature needs to be verified by molecular biologic experiments on clinical samples in future studies. Eventually, a large-scale samples and experiments studies are supposed to validate the biologic function of the prognostic six lncRNA in LUSC.
In conclusion, our study has identified differentially expressed lncRNAs, miRNAs and mRNAs that potentially predict the progression of LUSC by using the lncRNA, miRNA, and mRNA transcriptome sequencing data from TCGA database to construct a ceRNA network. The lncRNA identified in our constructed ceRNA network may play a pivotal role in the diagnosis and prognosis of LUSC patient.
Disclosure statement
No potential conflict of interest was reported by the authors.
Additional information
Funding
References
- Ferlay J, Soerjomataram I, Dikshit R, et al. Cancer incidence and mortality worldwide: sources, methods and major patterns in GLOBOCAN 2012. Int J Cancer. 2015;136:E359–E386.
- Chen WJ, Gan TQ, Qin H, et al. Implication of downregulation and prospective pathway signaling of microRNA-375 in lung squamous cell carcinoma. Pathol Res Pract. 2017;213:364–372.
- Cancer Genome Atlas Research, N. Comprehensive genomic characterization of squamous cell lung cancers. Nature 2012;489:519–525.
- Hirsch FR, Scagliotti GV, Mulshine JL, et al. Lung cancer: current therapies and new targeted treatments. Lancet. 2017;389:299–311.
- Kulasingam V, Diamandis EP. Strategies for discovering novel cancer biomarkers through utilization of emerging technologies. Nat Rev Clin Oncol. 2008;5:588–599.
- Lin C, Yang L. Long noncoding RNA in cancer: wiring signaling circuitry. Trends Cell Biol. 2018;28:287–301.
- Heery R, Finn SP, Cuffe S, et al. Long non-coding RNAs: key regulators of epithelial-mesenchymal transition, tumour drug resistance and cancer stem cells. Cancers (Basel). 2017;9:38.
- Ning P, Wu Z, Hu A, et al. Integrated genomic analyses of lung squamous cell carcinoma for identification of a possible competitive endogenous RNA network by means of TCGA datasets. PeerJ. 2018;6:e4254.
- Song J, Ye A, Jiang E, et al. Reconstruction and analysis of the aberrant lncRNA-miRNA-mRNA network based on competitive endogenous RNA in CESC. J Cell Biochem. 2018;119:6665–6673.
- Li-Li Zhao B-R. Identification of potential prognostic ceRNA module biomarkers in patients with pancreatic adenocarcinoma. Oncotarget. 2017;8:94493–94504.
- Zhao G, Fu Y, Su Z, et al. How long non-coding RNAs and microRNAs mediate the endogenous RNA network of head and neck squamous cell carcinoma: a comprehensive analysis. Cell Physiol Biochem. 2018;50:332–341.
- Fan CN, Ma L, Liu N. Systematic analysis of lncRNA-miRNA-mRNA competing endogenous RNA network identifies four-lncRNA signature as a prognostic biomarker for breast cancer. J Transl Med. 2018;16:264.
- Zhang Z, Qian W, Wang S, et al. Analysis of lncRNA-associated ceRNA network reveals potential lncRNA biomarkers in human colon adenocarcinoma. Cell Physiol Biochem. 2018;49:1778–1791.
- Wang J, Zhang C, He W, et al. Construction and comprehensive analysis of dysregulated long non-coding RNA-associated competing endogenous RNA network in clear cell renal cell carcinoma. J Cell Biochem. 2018. 1–18. DOI:10.1002/jcb.27557
- Wang X, Han L, Zhou L, et al. Prediction of candidate RNA signatures for recurrent ovarian cancer prognosis by the construction of an integrated competing endogenous RNA network. Oncol Rep. 2018;40:2659–2673.
- Wang Y, Hou J, He D, et al. The emerging function and mechanism of ceRNAs in cancer. Trends Genet. 2016;32:211–224.
- Tay Y, Rinn J, Pandolfi PP. The multilayered complexity of ceRNA crosstalk and competition. Nature. 2014;505:344–352.
- Salmena L, Poliseno L, Tay Y, et al. A ceRNA hypothesis: the Rosetta Stone of a hidden RNA language? Cell. 2011;146:353–358.
- Rokavec M, Horst D, Hermeking H. Cellular model of colon cancer progression reveals signatures of mRNAs, miRNA, lncRNAs, and epigenetic modifications associated with metastasis. Cancer Res. 2017;77:1854.
- Chou C-H, Chang N-W, Shrestha S, et al. miRTarBase 2016: updates to the experimentally validated miRNA-target interactions database. Nucleic Acids Res. 2016;44:D239–D247.
- Wong N, Wang X. miRDB: an online resource for microRNA target prediction and functional annotations. Nucleic Acids Res. 2015;43:D146–D152.
- Fromm B, Billipp T, Peck LE, et al. A uniform system for the annotation of vertebrate microRNA genes and the evolution of the human microRNAome. Annu Rev Genet. 2015;49:213–242.
- Shi X, Sun M, Liu H, et al. Long non-coding RNAs: a new frontier in the study of human diseases. Cancer Lett. 2013;339:159–166.
- Dey BK, Mueller AC, Dutta A. Long non-coding RNAs as emerging regulators of differentiation, development, and disease. Transcription. 2014;5:e944014.
- Rui Xue Tang W-J, He R-Q, Zeng J-H, et al. Identification of a RNA-Seq based prognostic signature with five lncRNAs for lung squamous cell carcinoma. Oncotarget. 2017;8:50761–50773.
- Sui J, Xu S-Y, S-RY JH, et al. Integrated analysis of competing endogenous RNA network revealing lncRNAs as potential prognostic bimarkers in human lung squamous cell carcinoma. Oncotarget. 2017;8:65997–66018.
- Shao-ping Zhu J-Y, Wang X-G, Zhao J-P. Long intergenic non-protein coding RNA 00858 functions as a competing endogenous RNA for miR-422a to faciliate the cell growth in non-small cell lung cancer. Aging. 2017;9:475–486.
- Li C, Wan L, Liu Z, et al. Long non-coding RNA XIST promotes TGF-beta-induced epithelial-mesenchymal transition by regulating miR-367/141-ZEB2 axis in non-small-cell lung cancer. Cancer Lett. 2018;418:185–195.
- Jiang H, Zhang H, Hu X, et al. Knockdown of long non-coding RNA XIST inhibits cell viability and invasion by regulating miR-137/PXN axis in non-small cell lung cancer. Int J Biol Macromol. 2018;111:623–631.
- Tang LX, Chen GH, Li H, et al. Long non-coding RNA OGFRP1 regulates LYPD3 expression by sponging miR-124-3p and promotes non-small cell lung cancer progression. Biochem Biophys Res Commun. 2018;505:578–585.
- Liang R, Xiao G, Wang M, et al. SNHG6 functions as a competing endogenous RNA to regulate E2F7 expression by sponging miR-26a-5p in lung adenocarcinoma. Biomed Pharmacother. 2018;107:1434–1446.
- Wu DM, Wang S, Wen X, et al. LncRNA SNHG15 acts as a ceRNA to regulate YAP1-Hippo signaling pathway by sponging miR-200a-3p in papillary thyroid carcinoma. Cell Death Dis. 2018;9:947.
- Zhang W, Huang C, Gong Z, et al. Expression of LINC00312, a long intergenic non-coding RNA, is negatively correlated with tumor size but positively correlated with lymph node metastasis in nasopharyngeal carcinoma. J Mol Hist. 2013;44:545–554.
- Chen J, Hu L, Wang J, et al. Low expression LncRNA TUBA4B is a poor predictor of prognosis and regulates cell proliferation in non-small cell lung cancer. Pathol Oncol Res. 2017;23:265–270.
- He J, Wu K, Guo C, et al. Long non-coding RNA AFAP1-AS1 plays an oncogenic role in promoting cell migration in non-small cell lung cancer. Cell Mol Life Sci. 2018;75:4667–4681.
- Zhang HY, Yang W, Zheng FS, et al. Long non-coding RNA SNHG1 regulates zinc finger E-box binding homeobox 1 expression by interacting with TAp63 and promotes cell metastasis and invasion in lung squamous cell carcinoma. Biomed Pharmacother. 2017;90:650–658.
- Cui F-mZ Y, Zhu C-K, Geng L, et al. Upregulated lncRNA SNHG1 contributes to progression of non-small cell lung cancer through inhibition of miR-101-3p and activation of Wnt/B-catenin signaling pathway. Oncotarget. 2017;8:17785–17794.
- Yao J, Zhou B, Zhang J, et al. A new tumor suppressor LncRNA ADAMTS9-AS2 is regulated by DNMT1 and inhibits migration of glioma cells. Tumor Biol. 2014;35:7935–7944.
- Li Q, Dai Y, Wang F, et al. Differentially expressed long non-coding RNAs and the prognostic potential in colorectal cancer. Neoplasma. 2016;63:977–983.
- Cao B, Liu C, Yang G. Down-regulation of lncRNA ADAMTS9-AS2 contributes to gastric cancer development via activation of PI3K/Akt pathway. Biomed Pharmacother. 2018;107:185–193.
- Wang A, Jin C, Li H, et al. LncRNA ADAMTS9-AS2 regulates ovarian cancer progression by targeting miR-182-5p/FOXF2 signaling pathway. Int J Biol Macromol 2018;120:1705–1713.
- Liu C, Yang Z, Deng Z, et al. Upregulated lncRNA ADAMTS9-AS2 suppresses progression of lung cancer through inhibition of miR-223-3p and promotion of TGFBR3. IUBMB Life. 2018;70:536–546.
- Hong-Yuan W, Xiao-Ping C. miR-338-3p suppresses epithelial-mesenchymal transition and metastasis in human nonsmall cell lung cancer. Indian J Cancer. 2015;52: E168–171.
- Chen X, Wei L, Zhao S. miR-338 inhibits the metastasis of lung cancer by targeting integrin β3. Oncol Rep. 2016;36:1467–1474.
- Sun J, Feng X, Gao S, et al. microRNA-338-3p functions as a tumor suppressor in human nonsmallcell lung carcinoma and targets Ras-related protein 14. Mol Med Rep. 2015;11:1400–1406.
- Luo J, Shi K, Yin SY, et al. Clinical value of miR-182-5p in lung squamous cell carcinoma: a study combining data from TCGA, GEO, and RT-qPCR validation. World J Surg Oncol. 2018;16:76.
- Li J, Wang J, Chen Y, et al. A prognostic 4-gene expression signature for squamous cell lung carcinoma . J Cell Physiol. 2017;232:3702–3713.
- Li Y, Gu J, Xu F, et al. Transcriptomic and functional network features of lung squamous cell carcinoma through integrative analysis of GEO and TCGA data. Sci Rep. 2018;8:15834.