
Abstract
This study aimed to determine the metabolites associated with ventricular septal defect (VSD) and the underlying mechanisms. Blood samples and thymus tissues were collected from VSD patients to perform LC-MS-based metabolomics assay and generate iPS cell-derived cardiomyocytes, respectively. VSD rat model was used in vivo study. RT-PCR, western blotting, immunohistochemistry, luciferase activity assay, GFP-LC3 adenovirus and GFP and RFP tfLC3 assay, and transmission electron microscopy were performed to investigate the underlying mechanisms. The metabolites uric acid (UA) and sphingomyelin (SM) increased in the serum of VSD patients, along with enhanced autophagy. The combination of UA and SM treatment could promote autophagy and inhibit EGFR and AKT3 expressions. Overexpression of EGFR and AKT3 suppressed autophagy in UA and SM-treated cardiomyocytes, respectively. Also, lncRNA MEG3 knockdown and overexpression could enhance and inhibit autophagy in UA and SM-treated cardiomyocytes, respectively, through targeting miR-7-5p. Moreover, miR-7-5p mimics and inhibitors promoted and inhibited autophagy in UA and SM-treated cardiomyocytes, respectively, via target EGFR. In VSD rat model, upregulation of MEG3 could reverse high level of autophagy and decrease serum UA and SM. In conclusion, UA and SM are essential VSD-associated metabolic biomarkers and MEG3/miR-7-5p/EGFR axis is critical to the regulation of autophagy in cardiomyocytes.
Introduction
Ventricular septal defect (VSD), accounting for around 40% of cardiac anomalies, is one of the commonest congenital heart diseases [Citation1]. The primary pathophysiological features of VSD appear in the direction and amount of interventricular shunting, the degree of volume loading to the cardiac chambers and prolapse of the aortic valve [Citation2]. With advances in examination techniques, such as imaging and screening, the incidence of VSD has substantially increased, ranging from 1.56 to 53.2 per 1000 newborn babies [Citation3,Citation4]. However, since many clinical features display as asymptomatic and many anomalies close shortly, the accurate prevalence of VSD varies between studies [Citation2]. Therefore, the development of examination technique that can precisely and effectively diagnose VSD could provide reliable evidence for subsequent treatment and improve theoretical management.
Metabolomics is a novel research field regarding the high-throughput quantification, classification and characterization of metabolite molecular in metabolome [Citation5]. The metabolic phenotype is the manifestation of metabolic state, showing the environmental contribution, including lifestyle, diet and gut microbe, in a particular condition [Citation6]. Metabolic phenotypes also can be used as evidence that hardly obtains from gene or protein expression profiles [Citation7] and provides a systematic readout of molecular, cellular, physiological status that may be exploited in healthcare and clinical treatment [Citation6]. With regard to cardiovascular disease, Ganna et al. analysed the circulating metabolites in patients with coronary heart disease (CHD) and found that four lipid-related metabolites contribute to the development of CHD [Citation8]. Serum metabolomics study revealed that several metabolic markers, including 2-hydroxy, 2-methylpropanoic acid and erythritol, are associated with heart failure [Citation9]. Therefore, metabolomics is an effective and safe approach for the diagnosis, evaluation of severity, and therapy management for diseases in both clinical practice and basic research.
The study of human cardiomyocyte was hampered by few ideal vitro models in the early stage [Citation10]. However, this challenge has been overcome by emerging embryonic stem (ES) cells. ES cells are capable of consecutively growing stem cell lines that are first isolated from the mouse blastocysts [Citation11]. ES cells are characterized by the potent potential to differentiate into various cell/tissue type as well as proliferate in the state without differentiation-stimulated conditions for long period of time [Citation12,Citation13]. Induced pluripotent stem (iPS) cells, possessing the differential potential of ES cells, have been identified as one of the promising sources of cardiomyocytes [Citation14]. In our previous report, we collect iPS cells from the thymic epithelial cells of a patient with VSD and successfully induce these iPS cells to differentiate to cardiomyocytes [Citation15], providing a promising vitro model to studying the pathophysiology of VSD.
Long noncoding RNAs (lncRNAs) and microRNAs (miRNAs) are two important subclasses of noncoding RNAs (ncRNAs) [Citation16]. It has well documented that both lncRNAs and miRNAs are important for the regulation of transcription and post-transcription and play essential roles in various physiological and pathological processes [Citation17]. In general, lncRNAs act as a molecular sponge for miRNAs via inhibiting miRNAs target mRNAs, while miRANs can regulate the stability and function of lncRNA [Citation18]. So far, growing evidence has been demonstrated that the interactive correlations between lncRNA and miRNA are essential in cardiovascular pathophysiologies, such as cardiac hypertrophy, myocardial infarction, atherosclerosis, cardiac apoptosis and heart failure, which are detailed and documented [Citation19–21]. Therefore, understanding the roles of lncRNA and miRNA in VSD would greatly expand our horizon to VSD.
In this study, we aimed to determine the VSD-associated metabolites by LC-MS-based metabolomics assay and then apply iPS cell-derived cardiomyocytes and VSD rat model to investigate the mechanisms underlying the effect of identified metabolite in VSD in vitro and in vivo, respectively. The findings of this study may provide novel insights into the molecular architecture of VSD and theoretical evidence for developing new VSD diagnosis strategy.
Methods and materials
Patients and tissues
In this study, all researches involving in human subjects conformed to the Declaration of Helsinki and the Principles of Ethical Publishing in the International Journal of Cardiology. The experimental protocols for this study were approved by the institutional ethics committee and written informed consents were obtained from all patients. All heart tissues and blood samples were collected from patients with left to right shunt congenital heart disease combined with heart failure (VSD + HF) (n = 20; 6 males and 14 females; age: 1 month to 12 years) and health individuals (n = 24; 10 males and 14 females; age: 4 months to 12 years). In this study, written approval for human thymus tissue collection, iPS cell generation, and biochemical and molecular analysis was obtained from the Ethics Committee for Human Research at Fudan University (approval number: 048). The patient involved in the study was presented with VSD at age 2 years. Written informed consent was obtained from the patient’s guardian.
Metabolomics analysis
Liquid chromatography-mass spectrometry (LC-MS)-based metabolomics assay was performed to determine the active metabolite associated with VSD. The detailed procedure was performed as described [Citation22]. Mass spectrometry detections were conducted in either the negative or positive ion mode (full scan mode from m/z 80–1000) with 350 °C gas temperature, 4000 V capillary voltage, 11 L/min drying gas flow rate, and 230 V fragmentor voltage. The internal standards were used for calibration of the response of metabolite ions. Isotope-labelled FFA C16:0-d3 and carinitines were used to calibrate the metabolites in negative and positive ion mode, respectively. Other internal standards were used for calibration in both ion modes. QC samples were used to assess the reproducibility. The ion features were obtained and aligned by using MassHunter workstation (Agilent Technologies, Palo Alto, CA). The modified 80% rule was applied to remove missing values [Citation23]. Principal component analysis (PCA), orthogonal signal correction (OSC) partial least-squares-discriminant analysis (PLS-DA), orthogonal partial least square-discriminant analysis (OPLS-DA) were used after the Pareto scaling. The Variable Importance in the Projection (VIP) value was applied to determine the active metabolites.
iPS cell generation and cardiac differentiation
In this study, all procedures of iPS cell generation and cardiac differentiation were performed as described in our previous report [Citation15]. iPS cell-derived cardiomyocytes were used to subsequent experiments.
Real-time PCR
Total RNA was isolated from cardiomyocytes following the manufacturer’s instructions for the RNeasy Mini kit (Qiagen, Hilden, Germany). Then, cDNA was synthesized by using the RNA PCR Core Kit (Applied Biosystems, Foster City, CA) following the manufacturer’s instructions. Real-time PCR reactions were performed on a Lightcycler (Roche, Mannheim, Germany) in 10 μL reactions that contained 0.3 μL of each primer, 0.25 μL of cDNA, 4.15 μL of ddH2O, and 5 μL of 2 × Fast Start Universal SYBR Green Master. Real-time PCR data were analysed using the ΔΔCT method [Citation24], and GAPDH was used as the reference gene. The primers were used as followed: GAPDH (Forward: 5′-ATGGGGAAGGTGAAG GTC-3′; Reverse″ 5′-GGGGTCATTGATGGCAACATT-3′), lncRNA MEG3 (Forward: 5′-GACATCATCCGTCCACCTCCTTG-3′; Reverse: 5′-GTCAGTGAGTGGCTGCTTTGTATG-3′), miR-7-5p (Forward: 5′-TGCGGTGGAAGACTAGTGATTTTG-3′), epidermal growth factor receptor (EGFR) (Forward: 5′-CCCAGTACCTGCTCAACTGGT-3′; Reverse:5′-TGCCAGGTCGCG GTG-3′), and AKT Serine/Threonine Kinase 3 (AKT3) (Forward: 5′-ATGAGCGATGTTACCATTGT -3′; Reverse: 5′- CAGTCTGTCTGCTACAGCCTG-3′). The primers were evaluated by BLAST search (http://www.ncbi.nlm.nih.gov/Sitemap/index.html#BLAST).
Western blotting
Cardiomyocytes protein was extracted by using the cell lysis buffer (Beyotime Institute of Biotechnology, Shanghai, China). The detailed protocol was performed as previously reported [Citation25]. The primary antibodies for GAPDH, P62, EGFR, AKT3, beclin-1 and autophagy related 7 (Atg7) were purchased from Santa Cruz Biotechnology (Santa Cruz Biotechnology, Dallas, TX). Quantification of optical density was assessed by the Uvitec Alliance software (Eppendorf, Hamburg, Germany).
Immunohistochemistry (IHC)
Heart tissues were fixed in 4% paraformaldehyde for 48 h, embedded in paraffin, and cut into 3–5 μm sections (3 sections for each animal). The detailed procedures followed those in the report [Citation26]. The primary antibodies for P62 (Santa Cruz, Shanghai, China) were applied. Three random regions in the sections were selected to analyse.
Cell transfection
The sequences of MEG3, EGFR and AKT3 were synthesized and subcloned into pLV-CMV plasmids according to the manufacturer’s instructions (Invitrogen, Shanghai, China). si-MEG3, miR-7–5p mimics and inhibitor (25 nmol/L) were obtained from GenePharma (GenePharma, Shanghai, China). Cardiomyocytes were cultured in six-well plate and transfection was performed by using Lipofectamine 2000 (Invitrogen, Carlsbad, CA) according to the manufacturer’s instructions. Then, 48 h post-transfection, cardiomyocytes were used for subsequent assessments.
Luciferase activity assay
TargetScan (www.targetscan.org) and MiRanda (www.microrna.org) were used to online predict target genes of miR-21. MEG3 was predicted to target miR-7–5p and EGFR were predicted as a potential target gene of miR-7–5p. To test these predictions, the luciferase reporter assays were performed according to the manufacturer’s instructions (Promega, Madison, WI). The detailed protocol was identical to the previous method [Citation26].
The engineered luciferase reporter plasmids (wild-type and mutant) were transfected with MEG3 and miR-7-5p into cardiomyocytes by using Lipofectamine™ 2000 kit in accordance with the manufacturer's instructions (Invitrogen, Carlsbad, CA), respectively. And, 48-h post-transfection, luciferase activity was assessed by using the Dual-Luciferase Reporter Assay system kit (Promega, Fitchburg, WI).
Transmission electron microscopy (TEM)
Cardiomyocytes were fixed in 0.1% glutaraldehyde and 4% paraformaldehyde in cacodylate buffer for 24 h at 4 °C. Then, the samples were sent to the electron microscope room at Shanghai Medical College of Fudan University for subsequent processing and testing.
GFP-LC3 adenovirus assay
The GFP-LC3 adenovirus was obtained from Hanbio Biotechnology Co. Ltd. (Shanghai, China). UA and SM-treated cardiomyocytes were transfected with GFP-LC3 adenovirus for 24 h in accordance with the manufacturer’s instructions. The GFP-labelled autophagic vesicles were detected and quantified by using ImageJ (http://rsb.info.nih.gov/ij/).
GFP and RFP tandemly tagged LC3 (tfLC3) assay
GFP and RFP tfLC3 assay were performed by using Premo™ Autophagy Tandem Sensor RFP-GFP-LC3B Kit (Thermo Fisher Scientific, Waltham, MA). UA and SM-treated cardiomyocytes were transfected mRFP-GFP-LC3 plasmid for 24 h in accordance with the manufacturer’s instructions. Cardiomyocytes were imaged by fluorescence microscopy. ImageJ software (http://rsb.info.nih.gov/ij/) were used to quantified mRFP-GFP signals.
VSD rat model
All animal experiments were approved by the Institutional Animal Care and Use Committee of Fudan University and the experimental procedures were conducted according to the approved guidelines. In this study, we investigated the effect of MEG3 on autophagy in vivo study by using VSD rat model. The animal model was early established VSD rat model in our lab according to previous studies [Citation27,Citation28]. Eighteen adult male Sprague-Dawley rats were divided into three groups (n = 6): control, VSD and VSD + MEG3 mimics. MEG3 mimics (GenePharma, Shanghai, China) was diluted in 20 μL PBS (1 nmol/μL) and intravenously injected into rats every 4 d for a total of 7 times. Before the first and last time of injection, the blood samples were collected from each rat to determine serum concentration of UA and SM by using ELISA assay kits (Abcam, Cambridge, MA) in accordance with the manufacturer’s instructions. Heart tissues and cardiomyocytes were harvested from rats using standard protocols and used to subsequent experiments.
Statistics
In this study, the sample size was at least three replicates in each experiment. Statistical analysis was performed by using SPSS version.19.0 software (SPSS, Chicago, IL). Data are presented as mean ± SEM Differences between groups were analysed with Student’s t-test. Differences were considered to be significant at p < .05.
Results
Uric acid and sphingomyelin were upregulated in the serum of patients with VSD
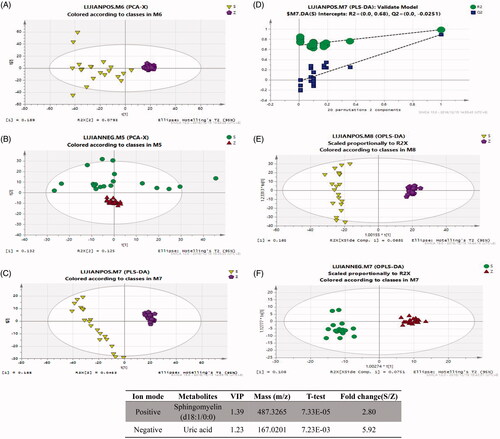
The VSD-associated metabolites were evaluated by LC-MS-based metabolomics assay with both positive and negative ion modes in the serum samples from VSD and healthy individuals. PCA score plots revealed that VSD and healthy groups were significantly segregated between positive ion mode (R2X = 0.329, Q2 = 0.116) and negative ion mode (R2X = 0.622, Q2= −0.00446) (). Next, a PLS-DA model was performed to determine the metabolic fingerprint changes in VSD patients (). The scores plot of the PLS-DA model showed a clear segregated distribution between two groups in positive ion mode (R2X = 0.233, R2Y = 0.988, Q2 = 0.892). The similar observations were also found in OPLS-DA model plot () in both positive ion mode (R2X = 0.233, R2Y = 0.988, Q2 = 0.891) and negative ion mode (R2X = 0.184, R2Y = 0.97, Q2 = 0.891). The VIP values were used to screen VSD-associated metabolites. All selected metabolites were filtered by t-test with a significant difference at p < .05. The results indicated that sphingomyelin (SM) and uric acid (UA) were significantly upregulated in serum samples of VSD patients ().
Figure 1. Analysis of the metabolite fingerprint in the serum by LC-MS-based metabolomics. Score plots of principal component analysis (PCA) in positive ion mode (A) and negative ion mode (B). Score plots of partial least-squares-discriminant analysis (PLS-DA) (C) and PLS-DA validate model (D). Score plots of orthogonal partial least square-discriminant analysis (OPLS-DA) in positive ion mode (E) and negative ion mode (F). (G) Potential metabolites in patients with VSD. S and RZ: VSD + HF group; Z and QZ: healthy individual group.
The autophagic level was upregulated in cardiomyocytes of patients with VSD
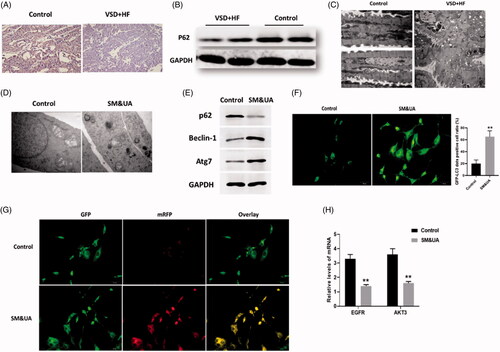
In this study, we first evaluated the autophagic level of cardiomyocytes of patients with VSD. P62 is an important autophagy adaptor that is highly associated with the autophagosome formation [Citation29]. By applying immunohistochemistry () and Western blots assays (), protein expression of p62 was downregulated in heart tissues of patients with VSD. We also observed increased autophagic level in VSD heart tissues by TEM assessment (). Together, the level of autophagy was increased in heart tissues of patients with VSD.
Figure 2. Elevation of UA and SM promoted autophagy in cardiomyocytes of patients with VSD. (A and B) p62 protein expression was decreased in VSD heart tissues, as detected by immunohistochemistry and Western blots assay, respectively. (C) The autophagic level was increased in VSD heart tissues, as assessed by TEM (scale bar: 200 nM). (D) The autophagic level was increased in cardiomyocytes treated with UA and SM, as assessed by TEM (scale bar: 200 nM). (E) p62 level was decreased while beclin-1 and Atg7 were increased in cardiomyocytes treated with UA and SM. (F) The number of GFP-LC3 positive cells was increased in cardiomyocytes treated with UA and SM, as assessed by GFP-LC3 adenovirus-transfected autophagic vesicle assay (scale bar:50 μM). (G) GFP signal was increased in cardiomyocytes treated with UA and SM assessed by GFP and RFP tandemly tagged LC3 (tfLC3) assays (scale bar: 50 μM). (H) mRNA expressions of EGFR and AKT3 were decreased in cardiomyocytes treated with UA and SM by RT-PCR. Values are mean ± SEM. For each experiment, three samples at least were available for the analysis. *p<.05, **p<.01, ***p<.001.
The autophagic level was upregulated in UA and SM-treated cardiomyocytes
Since UA and SM were two potential VSD-associated metabolites that were significantly elevated in the serum, we aimed to determine the effects of combinational treatment of UA and SM on cardiomyocytes. In this study, iPS cell-derived cardiomyocytes were used as the cell model, as described in our previous report [Citation15]. We observed the combination of UA and SM promoted autophagy in cardiomyocytes by TEM assessment (). Next, a group of autophagy protein markers was applied to determine the level of autophagy by Western blots. In addition to p62, we added two other autophagy markers beclin-1 and Atg7 to evaluate autophagic level. Beclin-1 is an essential regulator of autophagy and exerts important roles in the initiation of autophagosome formation [Citation30]. As a multifunctional regulator in autophagy, Atg7 is critical for autophagosome formation and promotes maturation of Atg8 (LC3) from an immature cytosolic form to an autophagosomal membrane protein [Citation31,Citation32]. In our study, we found that p62 level was decreased while beclin-1 and Atg7 were increased in UA and SM-treated cardiomyocytes, indicating the formation of autophagosomes was enhanced ().
In autophagy, autophagosomes engulf cytoplasmic molecules, such as organelles and cytosolic proteins, in which LC3-I, a cytosolic form of LC3, is converted to LC3-II, a form of LC3-phosphatidylethanolamine conjugate that is required to autophagosome formation [Citation33,Citation34]. Therefore, the detection of the level of LC3 has been widely applied to monitor the autophagy-associated process. In our study, to further evaluate upregulated autophagy induced by UA and SM, cardiomyocytes were transfected with GFP-LC3 adenovirus and then were subject to the combination of UA and SM treatment. The results showed that GFP signals were increased in UA and SM-treated cardiomyocytes (), suggesting the formation of autophagosomes was increased.
Since autophagy is a highly dynamic and complicated process, we also quantified the level of autophagy by detecting autophagic flux, representing the state of autophagic degradation activity [Citation35]. Cardiomyocytes were transfected with the mRFP-GFP-LC3 plasmids as previously described by Kimura et al. [Citation36]. The fluorescent LC3 puncta were imaged by fluorescence microscopy. In this method, the red puncta (mRFP) indicates the normal maturation of autophagosomes into autolysosomes while the green signal (GFP) does not represent the presence of autolysosomes since GFP is unstable in lysosomal degradative and acidic conditions. The yellow puncta displaying both green and red signals indicate autophagy is impaired. In our study, we found cardiomyocytes treated with the combination of UA and SM displayed higher yellow signal than those of control cells (), indicating that the autophagic flux was impaired. Collectively, the results indicated that the combination of UA and SM treatment caused more autophagosome formation and impaired autophagic flux, eventually leading to increased autophagy in cardiomyocytes.
Under the combination of UA and SM treatment, we also found the mRNA expressions of EGFR and AKT3 were downregulated in cardiomyocytes compared with control cells (), suggesting both may be involved in UA and SM-induced autophagy.
EGFR and AKT3 regulated UA and SM-induced autophagy in cardiomyocytes
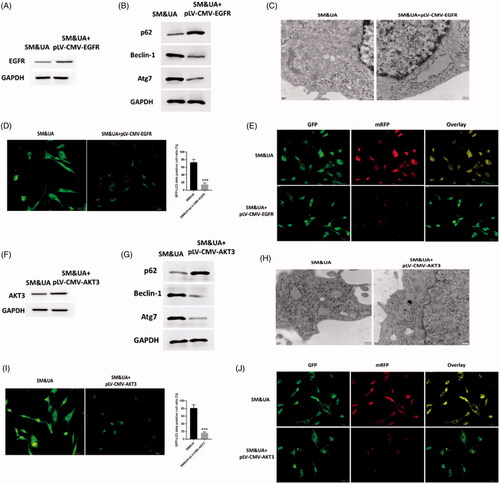
To determine the functions of EGFR and AKT3 in UA and SM-associated autophagy in cardiomyocytes, pLV-CMV-EGFR/AKT3 plasmids were applied to enhance expressions of EGFR and AKT3, respectively, in UA and SM-treated cardiomyocytes and the protein levels of EGFR and AKT3 were significantly increased compared with control cells (). Next, expressions of autophagy protein markers were determined by Western blots assay and it suggested that the expression of p62 was increased while the levels of beclin-1 and Atg7 were decreased in cardiomyocytes treated with both pLV-CMV-EGFR/AKT3 plasmids (), indicating autophagosomes formation was reduced. These observations were consistent with those found in TEM assessment that the lower autophagic level was found in cardiomyocytes with forced expressions of EGFR or AKT3 (). Also, GFP-LC3 adenovirus assay revealed that less GFP signals were observed in pLV-CMV-EGFR/AKT3 plasmid-treated cardiomyocytes compared with control cells (). Furthermore, cardiomyocytes with enhanced expression of EGFR/AKT3 displayed significant less colocalization of RFP-GFP-LC3 plasmids in tfLC3 assay (). Together, the data revealed the similar roles of EGFR and AKT3 on UA and SM-induced autophagy in cardiomyocytes and both could reverse autophagy through inhibiting autophagosome formation and attenuating the impairment of autophagic flux.
Figure 3. Upregulation of EGFR and AKT3 suppressed autophagy in cardiomyocytes treated with UA and SM. (A and F) EGFR and AKT3 protein expressions were increased in UA and SM-treated cardiomyocytes administrated with pLV-CMV-EGFR/AKT3 plasmids, respectively. (B and G) p62 level was increased while beclin-1 and Atg7 were decreased in UA and SM-treated cardiomyocytes administrated with pLV-CMV- EGFR/AKT3 plasmids, respectively. (C and H) Autophagic levels were decreased in UA and SM-treated cardiomyocytes administrated with pLV-CMV- EGFR/AKT3 plasmids, respectively, as assessed by TEM (scale bar: 200 nM). (D and I) The number of GFP-LC3 positive cells was decreased in UA and SM-treated cardiomyocytes administrated with pLV-CMV- EGFR/AKT3 plasmids, respectively, as assessed by GFP-LC3 adenovirus-transfected autophagic vesicle assay (scale bar: 50 μM). (E and J) GFP signals was decreased in UA and SM-treated cardiomyocytes administrated with pLV-CMV- EGFR/AKT3 plasmids, respectively, assessed by GFP and RFP tandemly tagged LC3 (tfLC3) assays (scale bar: 50 μM). Values are mean ± SEM. For each experiment, three samples at least were available for the analysis. *p < 0.05, **p < 0.01, ***p < 0.001.
MEG3 was downregulated in UA and SM-induced autophagy in cardiomyocytes
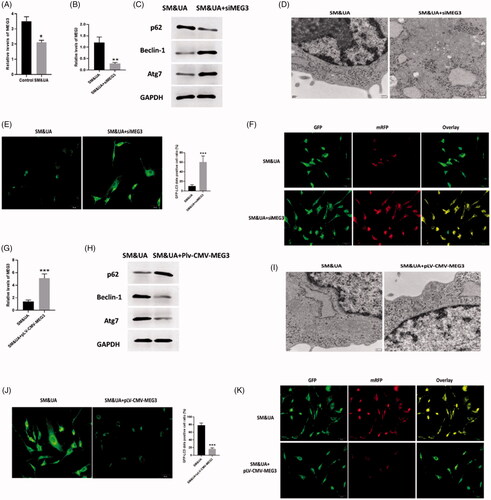
To further determine the mechanisms underlying UA and SM-induced autophagy in cardiomyocytes, lncRNA MEG3, an autophagy-associated regulator [Citation37,Citation38], was found significantly decreased in UA and SM-treated cardiomyocytes (). Then, we applied siMEG3 and pLV-CMV-MEG3 to knockdown and overexpress MEG3 in UA and SM-treated cardiomyocytes and the results showed that the expression of MEG3 was successfully inhibited or enhanced by siMEG3 and pLV-CMV-MEG3, respectively (). Regarding the effect of MEG3 on UA and SM-induced autophagy in cardiomyocytes, we found downregulation of MEG3 could further promote autophagy in UA and SM-treated cardiomyocytes. Western blots assay revealed that the level of p62 was decreased while expressions of beclin-1 and Atg7 were increased in cardiomyocytes transfected with siMEG3 (). Also, the enhanced autophagic level was observed in cardiomyocytes with inhibited level of MEG3 as shown in TEM assessment (). Furthermore, both GFP-LC3 and RFP-GFP-LC3 signals were increased in siMEG3-treated cardiomyocytes in GFP-LC3 adenovirus () and tfLC3 () assay, respectively. Collectively, these data indicated the stimulatory effect of downregulation of MEG3 in autophagy induced by UA and SM in cardiomyocytes. On the other hand, the opposite roles of upregulation of MEG3 were observed in our study, in which increased expression of MEG3 was associated with reduced autophagic level (). Therefore, these data together demonstrated that MEG3 is essential for the regulation of autophagy in UA and SM-treated cardiomyocytes.
Figure 4. LncRNA MEG3 regulated UA and SM-induced autophagy in cardiomyocytes. (A) MEG3 was downregulated in UA and SM-treated cardiomyocytes. (B and G) Efficiencies of siMEG3 and pLV-CMV-MEG3 plasmid were evaluated by RT-PCR, respectively. (C and H) p62 protein level was decreased and increased in UA and SM-treated cardiomyocytes administrated with siMEG3 and pLV-CMV-MEG3 plasmid, respectively. Beclin-1 and Atg7 protein levels were increased and decreased in UA and SM-treated cardiomyocytes administrated with siMEG3 and pLV-CMV-MEG3 plasmid, respectively. (D and I) autophagic levels were increased and decreased in UA and SM-treated cardiomyocytes administrated with siMEG3 and pLV-CMV-MEG3 plasmid, respectively, as assessed by TEM (scale bar: 200 nM). (E and J) The number of GFP-LC3 positive cells was increased and decreased in UA and SM-treated cardiomyocytes administrated with siMEG3 and pLV-CMV-MEG3 plasmid, respectively, as assessed by GFP-LC3 adenovirus-transfected autophagic vesicle assay (scale bar: 50 μM). (E and J) GFP signals were increased and decreased in UA and SM-treated cardiomyocytes administrated with siMEG3 and pLV-CMV-MEG3 plasmid, respectively, assessed by GFP and RFP tandemly tagged LC3 (tfLC3) assays (scale bar: 50 μM). Values are mean ± SEM. For each experiment, three samples at least were available for the analysis. *p < .05, **p < .01, ***p < .001.
MEG3/MiR-7-5/EGFR axis regulated UA and SM-induced autophagy in cardiomyocytes
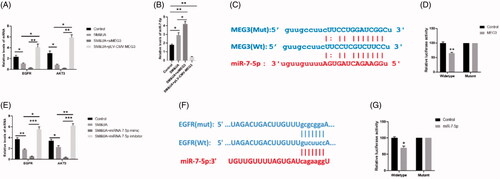
Regarding the correlation between MEG3 and EGFR/AKT3, we found siMEG3 further decreased while pLV-CMV-MEG3 increased levels of EGFR and AKT3 in UA and SM-treated cardiomyocytes, respectively (). Next, through prediction by PicTar (http://pictar.mdc-berlin.de/) and TargetScan (www.targetscan.org/index.html), a binding sequence of MEG3 was found in the 3’UTR of miR-7-5p (). The RT-PCR results suggested that the expression of MEG3 was in inverse ratio to miR-7-5p (). Luciferase activity assay further demonstrated that miR-7-5p is a direct target of MEG3 (). These results indicated that MEG3 acts as a sponge of miR-7-5p in the regulation of cardiomyocytes autophagy. Furthermore, we applied miR-7-5p mimics and inhibitors to determine the correlation between miR-7-5p and EGFR/AKT3. The results revealed that miR-7-5p mimics and inhibitors could further decrease and increased the expressions of EGFR and AKT3 (), indicating miR-7-5p may be a molecular sponge of EGER and AKT3. Through bioinformatic prediction, a predictive binding site of miR-7-5p was found in the 3’UTR of EGFR, but not AKT3 (). Meanwhile, the luciferase activity assay suggested that EGER was a target gene of miR-7-5p (). Taken together, MEG3/MiR-7-5/EGFR axis may play important roles in UA and SM-induced autophagy in cardiomyocytes.
Figure 5. MEG3 and EGFR were target genes of miR-7-5p. (A) Expressions of EGFR and AKT3 in cardiomyocytes treated with SM&UA, SM&UA + siMEG3, and SM&UA + pLV-CMV-MEG3, respectively. (B) Expression of miR-7-5p in cardiomyocytes treated with SM&UA, SM&UA + siMEG3 and SM&UA + pLV-CMV-MEG3, respectively. (C and D) Predictive sequences of miR-7-5p binding sites in the 3′UTR of MEG3 and relative luciferase activity. (E) Expressions of EGFR and AKT3 in cardiomyocytes treated with SM&UA, SM&UA + miR-7-5p mimic and SM&UA + miR-7-5p inhibitor, respectively. (F and G) Predictive sequences of miR-7-5p binding sites in the 3’UTR of EGFR and relative luciferase activity. Values are mean ± SEM. For each experiment, three samples at least were available for the analysis. *p < .05, **p < .01, ***p < .001.
MiR-7-5 was an essential regulator in UA and SM-induced autophagy in cardiomyocytes
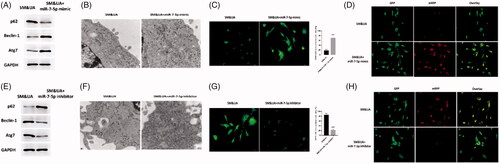
To determine the functions of miR-7-5p in autophagy in cardiomyocytes, we performed a series of functional studies to determine the autophagic level in UA and SM-treated cardiomyocytes that were subjected to miR-7-5p mimics and inhibitors, respectively. The data revealed that miR-7-5p mimics significantly inhibited the expression of p62 whereas elevated the levels of beclin-1 and Atg7 (). TEM assessment indicated that the increased autophagic level was observed in cardiomyocytes treated both the combination of UA and SM and miR-7-5p mimics (). Moreover, both GFP-LC3 and RFP-GFP-LC3 signals were elevated in miR-7-5p mimics-treated cardiomyocytes in GFP-LC3 adenovirus () and tfLC3 () assay, respectively. Therefore, miR-7-5p mimics exerted stimulatory roles in autophagy of UA and SM-treated cardiomyocytes through enhancing autophagosome formation and promoting the impairment of autophagic flux. Notably, miR-7-5p was found to act positive roles in autophagy of UA and SM-treated cardiomyocytes (). Together, the results suggest that miR-7-5p plays important roles in the modulation of autophagy induced by UA and SM.
Figure 6. MiR-7-5p regulated UA and SM-induced autophagy in cardiomyocytes. (A and E) p62 protein level was decreased and increased in UA and SM-treated cardiomyocytes administrated with miR-7-5p mimic and inhibitor, respectively. Beclin-1 and Atg7 protein levels were increased and decreased in UA and SM-treated cardiomyocytes administrated with miR-7-5p mimic and inhibitor, respectively. (B and F) Autophagic levels were increased and decreased in UA and SM-treated cardiomyocytes administrated with miR-7-5p mimic and inhibitor, respectively, as assessed by TEM (scale bar: 200 nM). (E and J) The number of GFP-LC3 positive cells was increased and decreased in UA and SM-treated cardiomyocytes administrated with miR-7-5p mimic and inhibitor, respectively, as assessed by GFP-LC3 adenovirus-transfected autophagic vesicle assay (scale bar: 50 μM). (E and J) GFP signals were increased and decreased in UA and SM-treated cardiomyocytes administrated with miR-7-5p mimic and inhibitor, respectively, assessed by GFP and RFP tandemly tagged LC3 (tfLC3) assays (scale bar: 50 μM). Values are mean ± SEM. For each experiment, three samples at least were available for the analysis. *p < .05, **p < .01, ***p < .001.
MEG3 played essential roles in autophagy of VSD rat model
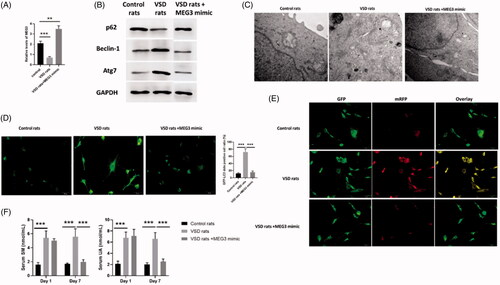
To determine the effects of MEG3 on autophagy in VSD rat model, we first evaluated the expression of MEG3 in VSD rats and VSD rats treated with MEG3 mimics. The results indicated that compared with control rats, MEG3 was decreased in cardiomyocytes of VSD rats while increased in VSD rats treated with MEG3 mimics (). The expression of p62 was decreased while the levels of beclin-1 and Atg7 were increased in cardiomyocytes of VSD rats compared with control rats (). All three autophagy protein markers were not different from those of control rats (). In TEM assessment, the autophagic level was increased VSD rats while was reversed by MEG3 mimics treatment (). Similar effects were also found in GFP-LC3 adenovirus () and tfLC3 () assay, in which autophagy was enhanced in VSD rats whereas was reversed by upregulation of MEG3. Furthermore, serum UA and SM were found to increase in VSD rats while decrease to the levels of control animals by MEG3 mimics (). Therefore, the results suggested that MEG3 is a key regulator in the regulation of autophagy of VSD rat model.
Figure 7. LncRNA MEG3 regulated UA and SM-induced autophagy in cardiomyocytes in vivo study. (A) MEG3 was decreased and increased in VSD rats and VSD rats treated with MEG3 mimic, respectively. (B) p62 protein level was decreased and increased in VSD rats and VSD rats treated with MEG3 mimic, respectively. Beclin-1 and Atg7 protein levels were increased and decreased in VSD rats and VSD rats treated with MEG3 mimic, respectively. (C) Autophagic levels were increased and decreased in VSD rats and VSD rats treated with MEG3 mimic, respectively, as assessed by TEM (scale bar: 200 nM). (D) The number of GFP-LC3 positive cells was increased and decreased in VSD rats and VSD rats treated with MEG3 mimic, respectively, as assessed by GFP-LC3 adenovirus-transfected autophagic vesicle assay (scale bar: 50 μM). (E) GFP signals were increased and decreased in VSD rats and VSD rats treated with MEG3 mimic, respectively, assessed by GFP and RFP tandemly tagged LC3 (tfLC3) assays (scale bar: 50 μM). (F) Serum UA and SM were determined by ELISA assay in VSD rats and VSD rats treated with MEG3 mimic. Values are mean ± SEM. For each experiment, three samples at least were available for the analysis. *p < .05, **p < .01, ***p < .001.
Discussion
VSD is a common congenital malformation of the heart, occurring in approximately 1.56 to 53.2 per 1000 live births [Citation3,Citation4]. Beyond an isolated cardiac anomaly, VSD is also an intrinsic component of multiple anomalies, such as univentricular atrioventricular connection and tetralogy of Fallot [Citation2]. In addition, VSD has been demonstrated to be related to a series of lesions, including congenitally corrected transposition, aortic coarctation, and transposition of the great arteries [Citation39,Citation40]. To date, the pathophysiology of VSD has not been fully understood, in particular, the correlation between VSD and metabolic state. In this study, we first discovered that the serum levels of UA and SM were significantly elevated in VSD patients. In addition, we found that administration of UA and SM promoted autophagy in cardiomyocytes and inhibited expressions of EGER and AKT3. Furthermore, we found that the effects of UA and SM on cardiomyocytes were associated with MEG3/miR-7-5p/EGER axis.
Metabolomics analysis is a powerful approach to shed light on the metabolic phenotype that is related to healthcare and pathophysiology [Citation6]. In this study, metabolomics assay revealed that both UA and SM were elevated in the serum of patients with VSD. SM, an essential integral component of cell membranes, is present in lipoproteins [Citation41]. It is reported that patients with CHD have higher plasma SM level than healthy individuals [Citation42,Citation43] and that plasma SM level is regarded as an independent risk factor for coronary artery disease [Citation44]. Additionally, uric acid, the final product of purine metabolism, also has been demonstrated to be associated with chronic heart failure [Citation45], hypertension [Citation46] and CHD [Citation47]. Collectively, the finding that UA and SM were increased in VSD patients’ serum is consistent with those reported in previous studies.
To further investigate the functions of UA and SM in VSD, we then applied UA and SM treatment to iPS cell-derived cardiomyocytes. The results revealed that the combination of UA and SM treatment significantly enhanced the autophagosomes formation and impaired normal autophagic flux, leading to elevated autophagic level in cardiomyocytes. Autophagy is a highly conserved process by which cytoplasmic constituents and organelles are degraded by the lysosome. As a double-edged sword, cardiomyocyte autophagy has been identified to be critical for normal cardiac function by stabilizing homeostasis and also contribute to the pathogenesis of cardiovascular diseases [Citation48]. For example, lysosomal structures are found to increase in the ventricular biopsies from heart failure patients, indicating increased autophagy level [Citation49]. Increased cardiac autophagy has also been observed in heart failure, cardiac hypertrophy, ischemia/reperfusion, and aortic stenosis [Citation48]. Herein, we reported that UA and SM were two inducers for cardiomyocytes autophagy, suggesting that UA and SM may facilitate the VSD progression via promoting cardiomyocytes autophagy.
Meanwhile, SM&UA-induced cardiomyocytes autophagy in our study was found to be associated with reduced expression levels of EGFR and AKT3, which suggests the potential roles of EGFR/AKT3 signalling in VSD. The mammalian target of rapamycin (mTOR) signalling plays important roles in various cellular functions [Citation50]. Also, a variety of upstream signals has been demonstrated to modulate mTOR activity through phosphoinositide-3-kinase-protein (PI3K)/kinase B (AKT) signalling pathway, including EGFR, insulin-like growth factor-1 (IGF-1) and vascular endothelial growth factor receptors (VEGFRs) [Citation51], which participates in various physiological activities including metabolism, cell cycle regulation and apoptosis [Citation52]. Hou et al. reported that advanced glycation endproducts promote autophagy in cardiomyocyte via inhibiting PI3K/Akt/mTOR pathway [Citation53]. Li et al. found that miR-199a causes aberrant autophagy and promotes cardiac hypertrophy through mTOR activation [Citation54]. Therefore, the activation of EGFR/AKT3 signalling in this study indicates the involvement of mTOR signalling in cardiomyocytes autophagy in VSD.
The importance of lncRNA and miRNA in gene expression regulation has been widely reported, and such significant roles also are greatly essential for various physiological and pathological activities [Citation17]. By application of luciferase assay, we found that MEG3 could directly target miR-7-5p and EGFR was the target gene of miR-7-5p. Manipulation of expression of MEG3 and miR-7-5p could also alter the level of cardiomyocytes autophagy. These results may be interpreted that MEG3 acted as a sponge of miR-7-5p to regulate the activation of downstream mTOR signalling, and in turn, modulate cardiomyocytes autophagy. MiR-7-5P is an important regulator in cell autophagy in various cell type [Citation55–57]. Furthermore, in this study, upregulation of MEG3 is associated with reversing the effect of UA and SM on cardiomyocytes and downregulating serum levels of UA and SM in VSD rat model. It is suggested that the involvement of MEG3 in autophagy has been reported in bladder cancer [Citation37], mycobacteria [Citation38] and epithelial ovarian carcinoma [Citation58]. Together, our results demonstrated that the interaction between MEG3 and miR-7-5p, at least in part, played important roles in cardiomyocytes autophagy induced by UA and SM.
In conclusion, the results revealed that UA and SM were increased in the serum of patients with VSD and that the combination of UA and SM promotes cardiomyocytes autophagy via MEG3/miR-7-5p/EGFR axis. This study provides a greater understanding of the molecular mechanisms underlying VSD and novel insights into developing diagnosis and treatment strategies for VSD.
Disclosure statement
The authors report no conflict of interest.
Additional information
Funding
References
- Hoffman JI. Incidence of congenital heart disease: I. Postnatal incidence. Pediatr Cardiol. 1995;16(3):103–113.
- Penny DJ, Vick GW. 3rd. Ventricular septal defect. Lancet. 2011;377(9771):1103–1112.
- Ooshima A, Fukushige J, Ueda K. Incidence of structural cardiac disorders in neonates: an evaluation by color Doppler echocardiography and the results of a 1-year follow-up. Cardiology. 1995;86(5):402–406.
- Roguin N, Du ZD, Barak M, et al. High prevalence of muscular ventricular septal defect in neonates. J Am Coll Cardiol. 1995;26(6):1545–1548.
- German JB, Hammock BD, Watkins SM. Metabolomics: building on a century of biochemistry to guide human health. Metabolomics. 2005;1(1):3–9.
- Nicholson JK. Global systems biology, personalized medicine and molecular epidemiology. Mol Syst Biol. 2006;2(1):52.
- Holmes E, Wilson ID, Nicholson JK. Metabolic phenotyping in health and disease. Cell. 2008;134(5):714–717.
- Ganna A, Salihovic S, Sundstrom J, et al. Large-scale metabolomic profiling identifies novel biomarkers for incident coronary heart disease. PLoS Genet. 2014;10(12):e1004801.
- Yao W, Gao Y, Wan Z. Serum metabolomics profiling to identify biomarkers for unstable angina. BioMed Res Int. 2017;2017:7657306–7657306.
- Kehat I, Kenyagin-Karsenti D, Snir M, et al. Human embryonic stem cells can differentiate into myocytes with structural and functional properties of cardiomyocytes. J Clin Invest. 2001;108(3):407–414.
- Evans MJ, Kaufman MH. Establishment in culture of pluripotential cells from mouse embryos. Nature. 1981;292(5819):154–156.
- Sanchez A, Jones WK, Gulick J, et al. Myosin heavy chain gene expression in mouse embryoid bodies. An in vitro developmental study. J Biol Chem. 1991;266(33):22419–22426.
- Hescheler J, Fleischmann BK, Lentini S, et al. Embryonic stem cells: a model to study structural and functional properties in cardiomyogenesis. Cardiovasc Res. 1997;36(2):149–162.
- Lu TY, Yang L. Uses of cardiomyocytes generated from induced pluripotent stem cells. Stem Cell Res Ther. 2011;2(6):44.
- Li J, Cao YY, Ma XJ, et al. Thymic derived iPs cells can be differentiated into cardiomyocytes. Front Biosci (Landmark Ed). 2015;20:964–974.
- Jalali S, Bhartiya D, Lalwani MK, et al. Systematic transcriptome wide analysis of lncRNA-miRNA interactions. PLoS One. 2013;8(2):e53823.
- Taft RJ, Pang KC, Mercer TR, et al. Non-coding RNAs: regulators of disease. J Pathol. 2010;220(2):126–139.
- Yoon JH, Abdelmohsen K, Gorospe M. Functional interactions among microRNAs and long noncoding RNAs. Semin Cell Dev Biol. 2014;34:9–14.
- Li N, Ponnusamy M, Li MP, et al. The role of microRNA and lncRNA-MicroRNA interactions in regulating ischemic heart disease. J Cardiovasc Pharmacol Ther. 2017;22(2):105–111.
- Thum T, Condorelli G. Long noncoding RNAs and microRNAs in cardiovascular pathophysiology. Circ Res. 2015;116(4):751–762.
- Bayoumi AS, Sayed A, Broskova Z, et al. Crosstalk between long noncoding RNAs and microRNAs in health and disease. Int J Mol Sci. 2016;17(3):356–356.
- Zhao X, Xu F, Qi B, et al. Serum metabolomics study of polycystic ovary syndrome based on liquid chromatography-mass spectrometry. J Proteome Res. 2014;13(2):1101–1111.
- Bijlsma S, Bobeldijk I, Verheij ER, et al. Large-scale human metabolomics studies: a strategy for data (pre-) processing and validation. Anal Chem. 2006;78(2):567–574.
- Livak KJ, Schmittgen TD. Analysis of relative gene expression data using real-time quantitative PCR and the 2(-delta delta C(T)) method. Methods. 2001;25(4):402–408.
- Pulito C, Mori F, Sacconi A, et al. Metformin-induced ablation of microRNA 21-5p releases Sestrin-1 and CAB39L antitumoral activities. Cell Discov. 2017;3(1):17022.
- Liu W, Xia P, Feng J, et al. MicroRNA-132 upregulation promotes matrix degradation in intervertebral disc degeneration. Exp Cell Res. 2017;359(1):39–49.
- Ding ZR, Qin YW, Hu JQ, et al. A new pan-nitinol occluder for transcatheter closure of ventricular septal defects in a canine model. J Interv Cardiol. 2009;22(2):191–198.
- Hu J, Qin Y, Wang S, et al. Ventricular septal defect produced by transcatheter puncture for canine model experimental study. J Interv Radiol. 2004;13(2):161–163.
- Bjorkoy G, Lamark T, Pankiv S, et al. Monitoring autophagic degradation of p62/SQSTM1. Meth Enzymol. 2009;452:181–197.
- Cao Y, Klionsky DJ. Physiological functions of Atg6/Beclin 1: a unique autophagy-related protein. Cell Res. 2007;17(10):839.
- Komatsu M, Tanida I, Ueno T, et al. The C-terminal region of an Apg7p/Cvt2p is required for homodimerization and is essential for its E1 activity and E1-E2 complex formation. J Biol Chem. 2001;276(13):9846–9854.
- Ichimura Y, Kirisako T, Takao T, et al. A ubiquitin-like system mediates protein lipidation. Nature. 2000;408(6811):488.
- Tanida I, Ueno T, Kominami E. LC3 and autophagy. Methods Mol Biol. 2008;445:77–88.
- Mizushima N, Yoshimori T. How to interpret LC3 immunoblotting. Autophagy. 2007;3(6):542–545.
- Loos B, Du Toit A, Hofmeyr JH. Defining and measuring autophagosome flux—concept and reality. Autophagy. 2014;10(11):2087–2096.
- Kimura S, Noda T, Yoshimori T. Dissection of the autophagosome maturation process by a novel reporter protein, tandem fluorescent-tagged LC3. Autophagy. 2007;3(5):452–460.
- Ying L, Huang Y, Chen H, et al. Downregulated MEG3 activates autophagy and increases cell proliferation in bladder cancer. Mol Biosyst. 2013;9(3):407–411.
- Pawar K, Hanisch C, Palma Vera SE, et al. Down regulated lncRNA MEG3 eliminates mycobacteria in macrophages via autophagy. Sci Rep. 2016;6(1):13–19416.
- Gaynor JW, Wernovsky G, Rychik J, et al. Outcome following single-stage repair of coarctation with ventricular septal defect. Eur J Cardiothorac Surg. 2000;18(1):62–67.
- Morell VO, Jacobs JP, Quintessenza JA. Aortic translocation in the management of transposition of the great arteries with ventricular septal defect and pulmonary stenosis: results and follow-up. Ann Thorac Surg. 2005;79(6):2089–2092.
- Chen X, Sun A, Zou Y, et al. Impact of sphingomyelin levels on coronary heart disease and left ventricular systolic function in humans. Nutr Metab (Lond). 2011;8(1):25–25.
- Jiang XC, Paultre F, Pearson TA, et al. Plasma sphingomyelin level as a risk factor for coronary artery disease. Arterioscler Thromb Vasc Biol. 2000;20(12):2614–2618.
- Schlitt A, Blankenberg S, Yan D, et al. Further evaluation of plasma sphingomyelin levels as a risk factor for coronary artery disease. Nutr & Metab. 2006;3:5–5.
- Ohkawa R, Kishimoto T, Kurano M, et al. Development of an enzymatic assay for sphingomyelin with rapid and automatable performances: analysis in healthy subjects and coronary heart disease patients. Clin Biochem. 2012;45(16–17):1463–1470.
- Anker SD, Doehner W, Rauchhaus M, et al. Uric acid and survival in chronic heart failure: validation and application in metabolic, functional, and hemodynamic staging. Circulation. 2003;107(15):1991–1997.
- Jossa F, Farinaro E, Panico S, et al. Serum uric acid and hypertension: the Olivetti heart study. J Hum Hypertens. 1994;8(9):677–681.
- Moriarity JT, Folsom AR, Iribarren C, et al. Serum uric acid and risk of coronary heart disease: atherosclerosis risk in communities (ARIC) study. Ann Epidemiol. 2000;10(3):136–143.
- Nishida K, Kyoi S, Yamaguchi O, et al. The role of autophagy in the heart. Cell Death Differ. 2009;16(1):31–38.
- Yamamoto S, Sawada K, Shimomura H, et al. On the nature of cell death during remodeling of hypertrophied human myocardium. J Mol Cell Cardiol. 2000;32(1):161–175.
- Liu G, Pei F, Yang F, et al. Role of autophagy and apoptosis in non-small-cell lung cancer. Int J Mol Sci. 2017;18(2):E367.
- Nishimoto T. Upstream and downstream of ran GTPase. Biol Chem. 2000;381(5–6):397–405.
- Vivanco I, Sawyers CL. The phosphatidylinositol 3-Kinase AKT pathway in human cancer. Nat Rev Cancer. 2002;2(7):489–501.
- Hou X, Hu Z, Xu H, et al. Advanced glycation endproducts trigger autophagy in cadiomyocyte via RAGE/PI3K/AKT/mTOR pathway. Cardiovasc Diabetol. 2014;13(1):78.
- Li Z, Song Y, Liu L, et al. miR-199a impairs autophagy and induces cardiac hypertrophy through mTOR activation. Cell Death Differ. 2017;24(7):1205–1213.
- Song M, Wang Y, Shang ZF, et al. Bystander autophagy mediated by radiation-induced exosomal miR-7-5p in non-targeted human bronchial epithelial cells. Sci Rep. 2016;6(1):30165.
- Gu DN, Jiang MJ, Mei Z, et al. microRNA-7 impairs autophagy-derived pools of glucose to suppress pancreatic cancer progression. Cancer Lett. 2017;400:69–78.
- Cai S, Shi GS, Cheng HY, et al. Exosomal miR-7 mediates bystander autophagy in lung after focal brain irradiation in mice. Int J Biol Sci. 2017;13(10):1287–1296.
- Xiu YL, Sun KX, Chen X, et al. Upregulation of the lncRNA Meg3 induces autophagy to inhibit tumorigenesis and progression of epithelial ovarian carcinoma by regulating activity of ATG3. Oncotarget. 2017;8(19):31714–31725.