
Abstract
Phospholipase Cγ2 (PLCG2) has been implicated in the regulation of cell proliferation, transformation, and tumor growth. In this study, we investigate the mechanism of PLCG2 action using a short interference RNA (siRNA) method. The effects of PLCG2 on rat liver BRL-3A cells treated siRNA were studied by 3-(4,5-dimethyl-2-thiazolyl)-2,5-diphenyl-2-H-tetrazolium bromide (MTT assay), bromodeoxyuridine (BrdU) labelling assay, flow cytometry method (FCM), quantitative real-time polymerase chain reaction (qRT-PCR) and western blot. The results showed when PLCG2 was reduced, cell vitality and proliferation rate were significantly decreased (p < .05 vs. control). FCM analysis showed that the number of cell division phase (G2 + M) was declined (p < .05 vs. control). RT-PCR and western blot revealed that the expression of signalling related genes NF-κB, FOS, JUN and ELK, target genes BCL2, CCNB1 and CCND1 were remarkably down-regulated in cells treated with PLCG2 siRNAs. Based on these results, we conclude PLCG2 plays an important role in rat liver cell proliferation via ERK and NF-κB pathway by regulating the expression of BCl2, MYC and CCND1.
Introduction
It is now well established that the metabolism of phospholipase plays an important role in a wide variety of cellular functions. The hydrolysis of phosphatidylinositol 4,5-bisphosphate by a specific phospholipase C (PLC) to two important second messengers, diacylglycerol and inositol 1,4,5-trisphosphate (Ins 1,4,5-P3), is one of the earliest key events triggered by a large number of extracellular signalling molecules. This effector role of PLC enzymes in signal transduction pathways has made them a subject of extensive research [Citation1–4]. PI-PLC molecules have been found in a broad spectrum of organisms including bacteria, simple eukaryotes, plants and animals [Citation5–9]. Studies of PI-PLC enzymes have included their catalytic properties, structure determination and, most extensively, their regulation through different signalling pathways [Citation10] leading to different activities including proliferation, cell apoptosis, transformation, and tumor growth.
The mammalian PLCγ family has two closely related members, PLCγ1 and PLCγ2 [Citation4]. Similar enzymes have been described in other organisms (e.g. Drosophila) but their regulation roles have not been extensively studied [Citation8]. Regarding the regulation of mammalian isozymes, much more research has been centered on widely expressed PLCγ1 than on PLCγ2. It is generally accepted that most regulatory interactions with PLCγ involve receptor or non-receptor tyrosine kinases. Nevertheless, new components of these pathways, as well as alternative mechanisms, are still being described.
The RNA interference (RNAi) is an evolutionarily conserved mechanism of regulation of gene expression in eukaryotic cells. It is based on the degradation of mRNAs by the action of complementary small interfering RNAs (siRNAs) to decrease the expression of the corresponding proteins. In general, siRNAs are approximately 21-nucleotide long, biologically produced in cell from longer double-stranded RNAs. siRNAs can also be prepared from small hairpin RNAs transcribed from genetic constructs produced in the laboratory and artificially introduced into cells. siRNA has been used to knockdown specific proteins in several experimental systems, from cultured cells to complete organisms, including mammals [Citation11].
In this study, we investigated the effects of PLCG2 on rat liver BRL-3A cells and elaborate on the underlying mechanisms using short interference RNA (siRNA) method. The results of MTT assay, BrdU labelling assay, and FCM showed when PLCG2 was reduced, cell vitality and proliferation rate were significantly decreased, RT-PCR and western blot revealed that the expression of signalling related genes NF-κB, FOS, JUN and ELK, target genes BCL2, CCNB1 and CCND1 were remarkably down-regulated in cells treated with PLCG2 siRNAs. Thus we conclude PLCG2 plays an important role in rat liver cell proliferation via ERK and NF-κB pathway by targeting BCL2, MYC and CCND1.
Materials and methods
Cell culture
Rat liver BRL-3A cells were obtained from the cell bank of the School of Basic Medicine of Peking Union Medical College (China). Cells were maintained at 37 °C in a humidified incubator containing 5% CO2 and cultured in Dulbecco’s modified Eagle’s medium (DMEM, Life technologies, Carlsbad, CA) supplemented with penicillin and streptomycin at 100 U/ml and 10% fetal bovine serum (Gibco, New York, NY).
The design and synthesis of siRNA targeting PLCG2
BRL-3A cells were transfected with siRNA targeting PLCG2 (). A negative control siRNA oligonucleotide sequence consisting of a scrambles sequence that does not recognize any mammalian gene was used as a negative control (NC). They were transfected with the indicated siRNA (50 nM) using LipofectamineTM 2000 (Invitrogen, Waltham, MA) according to the manufacturer’s instruction. The expression change of PLCG2 was determined by RT-PCR at 24, 48 and 72 h after infection [Citation12].
Table 1. The sequence of PLCG2 siRNAs.
Total cellular RNA was extracted using Trizol (Invitrogen Corporation, Carlsbad, CA) according to the manufacturer’s instructions. The integrity of RNA was determined by denatured agarose gel electrophoresis (70 V, 20 min). RNA purity was analyzed by spectrophotometer at 260 nm and 280 nm absorbance value (A260/280). Qualified RNA (2 μg) was used to synthesize the first strand of cDNA following the reverse transcription kit (Promega). The cDNA was used for PCR amplification and GAPDH was used as a reference gene. The sequences of the primers used in this study, including signalling related genes and cell proliferation-related genes, are listed in .
Table 2. The primer sequences used in the RT-PCR.
MTT assay
MTT assay was used to measure the cell viability of BRL-3A cells [Citation13]. Cells were collected by centrifugation after being treated with pancreatin, then the cells were re-suspended in the culture medium, seeded into 96-well plates at 5 × 10³ cells/well, and incubated at 37 °C overnight. Cells were then transfected with siRNA at a final concentration of 50 nM. At 48 h post-transfection, 100 μl of spent medium was replaced with an equal volume of fresh medium containing MTT (Sigma) at 0.5 mg/ml. Plates were incubated at 37 °C for 4 h, then MTT-medium was replaced by 100 μl of DMSO (Sigma) and plates were gently shaken for 10 min at room temperature. The absorbance was measured at 490 nm by Biotek reader (ELx800, USA). All treatments were done in triplicates. Three independent experiments were performed.
BrdU labelling assay
BrdU labelling was also used to measure the proliferation rate of BRL-3A cells [Citation14]. 6 × 10⁴ cells/well were seeded into 6-well plates and transfected with siRNA at a final concentration of 50 nM. After 48 h, 1 ml of medium with BrdU at final concentration of 30 μg/l was used to replace the culture medium for 2 h at 37 °C. The cells were then washed in PBS and fixed in 70% alcohol at 4 °C for 60 min. Next, cells were treated in 0.1% tyrisin at 37 °C for 1 h, denatured in 1 M HCl at 56 °C for 15 min, incubated with anti-BrdU monoclonal antibody (Sigma, St. Louis, MO) at 37 °C for 40 min, incubated with FITC-secondary antibody (Sigma, St. Louis, MO) for 35 min at room temperature. Cells nucleus were stained with propidium iodide (PI) (Sigma, St. Louis, MO). Between each step described above, cells were washed in PBS for three times. The staining was examined under a fluorescence microscope. Ten random non-overlapping fields were selected and the number of BrdU-labelled cells and nucleus in the same field was counted using Image-Pro Plus 6.0 software. The ratio of proliferating cells was expressed as the proportion of BrdU-labelled cells to total number of cells. Data were shown as mean ± SD. Statistical significance of difference between groups was determined by One-Way ANOVA using statistical software SPSS 13.0 (SPSS, Armonk, NY) for windows. p-Values < .05 were considered as statistically significant.
Cell cycle analysis
The cell cycle was analyzed by flow cytometry [Citation15]. 1 × 10⁶ cells/well were seeded into 6-well plates and transfected with siRNA at a final concentration of 50 nM. Cells were harvested at 48 h post-transfection. At the time of harvest, cells were first washed in cold PBS and then fixed in 70% alcohol at 4 °C for 60 min. The fixed cells were washed in cold PBS for 3 times and incubated in 1 ml of PBS solution with 50 μg of propidium iodide (PI, Sigma, USA) and 100 μg of RNase A (Sigma, St. Louis, MO) for 30 min at 37 °C. Samples were then analyzed for DNA content by FACSCan.
Western blot analysis
Cells were lysed on ice with RIPA buffer (50 mM Tris, 150 mM NaCl, 1% Triton X-100, 1% sodium deoxycholate, 0.1% SDS) containing proteinase inhibitors (1 mM phenylmethylsulfonyl fluoride, 2 μg/ml aprotinin, and 2 μg/ml leupeptin) [Citation16]. Protein concentration in cell lysate was quantified using the Neuhoff Assay [Citation17]. Cell lysates were boiled in SDS sample buffer for 5 min. An equal amount of protein per sample was separated by SDS-polyacrylamide gel electrophoresis and transferred to nitrocellulose membranes (GE Healthcare, Little Chalfont, UK). The membranes were first blocked with 5% non-fat milk in tris-buffered saline (TBS) containing 0.1% Tween-20 (TBS-T) and subsequently incubated with anti-target proteins or β-actin primary antibodies at 4 °C overnight. After three washes with TBS-T at room temperature, the membrane was further incubated with horseradish peroxidase-conjugated secondary antibodies for 1.5 h, followed by 3 washes with TBS-T. Antibody staining was visualized with Amersham ECL substrates.
Statistical analysis
Statistical significance was estimated using a 2-tailed Student’s t-test. p-Values less than .05 was considered to be significant. All the experiments described above were performed at least three times.
Results
The impact of siRNAs on PLCG2 expression
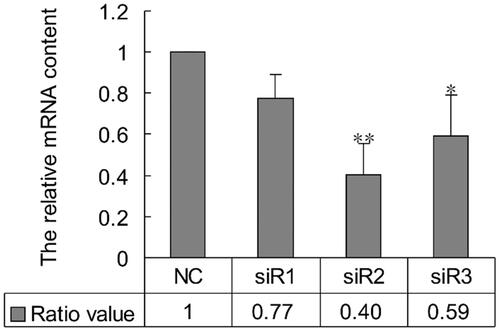
To select the most effective of siRNA on PLCG2 expression, we designed three siRNAs based on PLCG2 sequence. Quantity RT-PCR was used to determine the effect of different siRNAs on the expression level of PLCG2. The results showed that siR2 was the most effective siRNA of the three. The PLCG2 mRNA level in cells transfected with siR2 was knocked down to 40% compared to control, whereas siR3 reduced the PLCG2 mRNA level to 59% and siR1 to 77% (. Statistic analysis revealed that the mRNA level of PLCG2 was significantly declined in cells transfected with siR2 (p < .01 vs. control) and siR3 (p < .05) at post-48h, but no significant difference was found between siR1 and control.
Figure 1. The impact of PLCG2 siRNAs on the mRNA expression level of PLCG2. NC represented cells treated with negative siRNA; siR1, siR2 and siR3 represented cells treated with PLCG2 siRNA 1, siRNA 2 and siRNA 3, respectively. The expression level of PLCG2 mRNA was detected by qRT-PCR.
PLCG2 accelerates cell proliferation in vitro
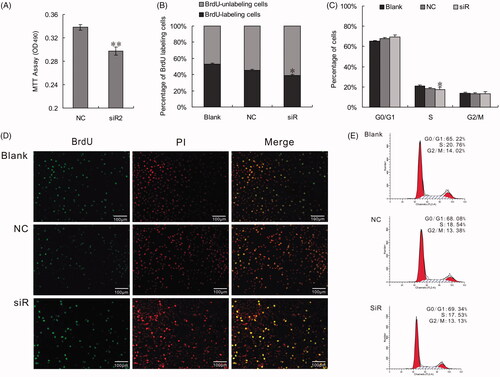
In present study, siRNA was selected for functional analysis in vitro for loss-of-function studies. The role of PLCG2 in the regulation of cell growth and proliferation was studied by three different methods including MTT, BrdU, and flow cytometry. The MTT results showed that all three types of PLCG 2 siRNAs could decrease the ability of cell growth and that of cells transfected with siR2 was significantly lower than control (p < .01) (. Consistent with the degree of PLCG2 mRNA deduction level, the proliferation of cells transfected with siR2 was also significantly lower than control (p < .05). The number of BrdU labelled cells () and the proportion of cells in S- and G2/M-phase were significantly decreased in the cells transfected with siRNA (p < .05) (. These results suggested that cell proliferation was closely controlled by PLCG2, and the changes in PLCG2 expression had a measurable effect on cell proliferation.
Figure 2. Effect of PLCG2 on cell proliferation. BRL-3A cells were treated by 50 nM siRNA2. At 48 h post-transfection, cells were used in MTT, BrdU and FCM assays to evaluate cell proliferation rate. (A) The results of MTT assay were analyzed using paired Student’s t-test: ** indicates p < .01. The results showed that the viability of cells transfected with siR2 was significantly lower than control (p < .01). (B) Micrograph of the BrdU-labelling cells. Number of BrdU-libeling cells in cells transfected with PLCG2 siRNA2 at 48 h was significantly lower than that of the NC group (39.31 ± 1.12% vs. 45.42 ± 1.06%, *p < .05). (C and E) Cell cycle analysis by flow cytometry. Compared with NC, proportion of cells in S- and G2/M-phase was diminished in cells transfected with siRNA2 at 48 h (S + G2/M: 30.66 ± 2.21% vs.31.92 ± 1.03%, *p < .05). Data represent the mean (±SD) of three independent experiments, at least. (D) BrdU and PI double stained cells to show the proliferative cells. Original magnification: 100×. Scale bar: 100 μm.
PLCG2 promotes hepatocyte proliferation via NF-κB and ERK signalling
To gain more insight of PLCG2 in the regulation of cell proliferation, we analyzed the mRNA expression changes for some of the known PLCG2 targeted molecules by RT-PCR. Among the genes being analyzed, NF-κB and ERK pathway-related genes NFKB1, NFKB2, FOS, JUN, ELK, ATF4 and cell proliferation-related genes BCL2, CCNA2, CCNB1, CCNC, CCND1, CCNE1, CCNB2, CDK2 and c-MYC were down-regulated and the expression changes of genes including NFKB2, FOS, JUN, BCL2, CCND1 and MYC have a significant difference between NC and PLCG2 siRNA transfected group (p < .05) (. To further understand the effect of PLCG2 on cell proliferation, the protein level of the above genes was analyzed by western blotting. The results revealed that inhibition of the PLCG2 suppressed the expression of NFKB2, FOS, JUN, BCL2, CCND1 and MYC (.
Figure 3. Changes of PLCG2 may modulate NF-κB and ERK signaling, which were hepatocytes proliferation-associated. (A). mRNA expression of 16 genes detected by qRT-PCR. Data represent the mean (±SD) of at least three independent experiments. t-Test: *p < .05. (B) Western blotting assay result shown that the expression of NFKB2, FOS, JUN, BCL2, CCND1 and MYC were suppressed when inhibit the expression of PLCG2. (C) PLCG2 may promote hepatocyte proliferation in vitro via NF-κB and ERK pathway by targeting BCL2, MYC and CCND1.
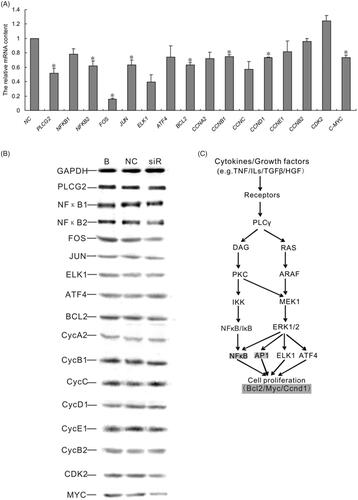
In conclusion, the results of RT-PCR and Western blot show that PLCG2 may promote hepatocyte proliferation in vitro via NF-κB and ERK pathways by targeting Bcl2, Myc and Ccnd1(.
Discussions
Evidence of the possible involvement of nuclear PLCs in the regulation of cell cycle progression and DNA replication has been obtained in different cell types, including 3T3 fibroblasts, hepatoma cell line, and regenerating rat liver [Citation17]. Despite an extensive mapping of PLCγ pathways and a clear link with growth factor receptors, the importance of PLCγ activation for cell proliferation has been a subject of controversy [Citation12]. Currently, due to the cultivation of primary hepatocytes isolated from rat liver is tedious and the growth of these cells is time-constraint, it is difficult to carry out a long and in-depth study. Therefore, our experiment selects normal rat liver cell line BRL-3A to explore the effect of PLCG2 on cell proliferation by the method of siRNA and analyze its mechanism, aiming at laying the foundation for further in vivo and in vitro experiments.
Transcription factor NF-κB is an anti-apoptotic molecular during rat liver regeneration [Citation18–20], which can induce the expression of IAPs, Caspase 8-FLICE and so on [Citation21]. Evidence have shown that cytokines such as TGF-β1 and TNF can activate PLCG2 through the non-Smad pathway, then leading the activation of ERK and NF-κB signalling pathway [Citation22], or activate NF-κB through the TAK1/IKK [Citation23]. Due to NF-κB can upregulate the expression of Bcl-2 [Citation24,Citation25], and participate in the regulation of c-Myc transcription [Citation26], the down-regulation of Bcl-2 and c-Myc in our study may be a direct consequence of downregulation of NF-κB at 48 h after transfected PLCG2 siRNA. The expression change of Bcl-2 and c-Myc can weaken their anti-apoptotic function and inhibit BRL-3A cell proliferation.
Extracellular signal-regulated kinases (ERK), also known as mitogen-activated protein kinases (MAPKs), belong to the group of serine/threonine kinases that are rapidly activated in response to growth factor stimulation [Citation27–29]. It is generally accepted that ERK activation plays a major role in cell multiplication and differentiation, whose phosphorylation is stimulated by activating Src kinase, PLC, PKC, and MEK [Citation29–33]. In the ERK-mediated signalling pathway, it mainly through the activation of transcription factor AP-1 to achieve the regulation of physiological activities. Several of the AP-1 regulated genes are critical regulators of cell growth, among them cyclin D1 and PCNA [Citation34,Citation35]. The cyclin D1 gene ccnd1 has emerged as an important target for the ERK pathway in driving proliferation. The cyclin D1 promoter contains an activating protein 1 (AP-1) site and ectopic expression of either c-fos or c-Jun induces cyclin D1 messenger RNA (mRNA), which in turn is critical in driving G0 to G1 cell cycle progression in many cell types including hepatocytes [Citation34]. It has also been shown that cyclin D1 is the most prominently up-regulated type D cyclin after PH and in response to mitogenic stimuli and plays a critical role in the driving cells through the G1 restriction point [Citation36,Citation37].
The present study provides evidence that the pleiotropic transcription factor NF-κB transmits growth signals directly to key regulators of the cell cycle, which can also be activated by Ras-Raf-ERK cascade. NF-κB activates transcription of the cyclin D1 promoter primarily through a proximal binding site. The NF-κB binding sites that were identified are required for serum induction of cyclin D1 transcription [Citation37]. Thus, NF-κB can functionally interact with other transcription factors, such as c-Fos/c-Jun, SP1, or E2F-1 [Citation38,Citation39]. Since the cyclin D1 promoter has been shown to be regulated by these transcription factors [Citation34,Citation40,Citation41], we believe that the significantly different expression change between experimental and control group in our study might result from multiple functional interactions. The fact that the cyclin D1 promoter contains binding sites for all of these transcription factors indicates the possibility of multiple cooperative interactions. Such cooperativity could form the basis for the suggested function of cyclin D1 to integrate diverse mitogenic stimuli [Citation42–44].
In summary, we could conclude that PLCG2 promotes cell proliferation through NF-κB and ERK signalling pathway by targeting Bcl2, c-Myc and Ccnd1. Since it is limited to analyze the mechanism just on the level of cells in vitro, we will further do this research with micro RNA, phosphorylation, methylation and hydrodynamics-based transgene(HDT) in vivo to confirm our conclusions.
Disclosure statement
No potential conflict of interest was reported by the authors.
References
- Katan M. The control of inositol lipid hydrolysis. Cancer Surv. 1995;27:199–211.
- Cockcroft S, Thomas GM. Inositol-lipid-specific phospholipase C isoenzymes and their differential regulation by receptors. Biochem J. 1992;288(1):1.
- Lee SB, Rhee SG. Significance of PIP2 hydrolysis and regulation of phospholipase C isozymes. Curr Opin Cell Biol. 1995;7(2):183–189.
- Rhee SG, Bae YS. Regulation of phosphoinositide-specific phospholipase C isozymes. J Biol Chem. 1997;272(24):15045–15048.
- Williams RL, Katan M. Structural views of phosphoinositide-specific phospholipase C: signalling the way ahead. Structure. 1996;4(12):1387–1394.
- Heinz DW, Essen LO, Williams RL. Structural and mechanistic comparison of prokaryotic and eukaryotic phosphoinositide-specific phospholipases C. J Mol Biol. 1998;275(4):635–650.
- Munnik T, Irvine RF, Musgrave A. Phospholipid signalling in plants. Biochimica et Biophysica Acta (BBA)-Lip Lip Metabol. 1998;1389(3):222–272.
- Shortridge RD, McKay RR. Invertebrate phosphatidylinositol-specific phospholipases C and their role in cell signaling. Invert Neurosci. 1995;1(3):199–206.
- van Haastert PJ, van Dijken P. Biochemistry and genetics of inositol phosphate metabolism in Dictyostelium. FEBS Lett. 1997;410(1):39–43.
- Katan M. Families of phosphoinositide-speci¢c phospholipase C: structure and function. Biochimica et Biophysica Acta. 1998;1436(1–2):5–17.
- Harborth J, Elbashir SM, Bechert K, et al. Identification of essential genes in cultured mammalian cells using small interfering RNAs. J Cell Sci. 2001;114(24):4557–4565.
- Lambolez B, Rossier J. Quantitative RT-PCR. Nat Biotechnol. 2000;18(1):5.
- Kumar P, Nagarajan A, Uchil PD. Analysis of cell viability by the MTT assay. Cold Spring Harb Protoc. 2018;2018(6):pdb.prot095505.
- Harris L, Zalucki O, Piper M. BrdU/EdU dual labeling to determine the cell-cycle dynamics of defined cellular subpopulations. J Mol Hist. 2018;49(3):229–234.
- Pozarowski P, Darzynkiewicz Z. Analysis of cell cycle by flow cytometry. Meth Mol Biol. 2004;281:301–311.
- Hnasko TS, Hnasko RM. The western blot. Meth Mol Biol. 2015;1318:87–96.
- Cavin LG, Romieu-Mourez R, Panta GR, et al. Inhibition of CK2 Activity by TGF-beta1 promotes IkappaB-alpha protein stabilization and apoptosis of immortalized hepatocytes. Hepatology. 2003;38(6):1540–1551.
- Iimuro Y, Nishiura T, Hellerbrand C, et al. NFkappaB prevents apoptosis and liver dysfunction during liver regeneration. J Clin Invest. 1998;101(4):802.
- Chaisson ML, Brooling JT, Ladiges W, et al. Hepatocyte-specific inhibition of NF-κB leads to apoptosis after TNF treatment, but not after partial hepatectomy. J Clin Invest. 2002;110(2):193–202.
- Iimuro Y, Fujimoto J. TLRs, NF-κB, JNK, and liver regeneration. Gastroenterol Res Pract. 2010;2010:1–7.
- Yang LQ, Fang DC, Wang RQ, et al. Effect of NF-kappaB, survivin, Bcl-2 and Caspase3 on apoptosis of gastric cancer cells induced by tumor necrosis factor related apoptosis inducing ligand. World J Gastroenterol. 2004;10(1):22–25.
- Hsieh HL, Wang HH, Wu WB, et al. Transforming growth factor-b1 induces matrix metalloproteinase-9 and cell migration in astrocytes: roles of ROS-dependent ERK-and JNK-NF-kB pathways. J Neuroinflammation. 2010;7(1):88.
- Arsura M, Panta GR, Bilyeu JD, et al. Transient activation of NF-kappaB through a TAK1/IKK kinase pathway by TGF-beta1 inhibits AP-1/SMAD signaling and apoptosis: implications in liver tumor formation. Oncogene. 2003;22(3):412–425.
- Tamatani M, Mitsuda N, Matsuzaki H, et al. A pathway of neuronal apoptosis induced by hypoxia/reoxygenation: roles of nuclear factor-kappaB and Bcl-2. J Neurochem. 2000;75(2):683–693.
- Luqman S, Pezzuto JM. NFkappaB: a promising target for natural products in cancer chemoprevention. Phytother Res. 2010;24(7):949–963.
- Yang GF, Deng CS, Xiong YY, et al. Expression of NFkappaB p65 and its target genes in gastric cancer and precancerous lesions. Zhonghua zhong liu za zhi [Chinese Journal of Oncology]. 2004;26(9):551–553.
- Karin M. Signal transduction from the cell surface to the nucleus through the phosphorylation of transcription factors. Curr Op Cell Biol. 1994;6(3):415–424.
- Lewis TS, Shapiro PS, Ahn NG. Signal transduction through MAP kinase cascades. Adv Cancer Res. 1998;74:49–139.
- Robinson MJ, Cobb MH. Mitogen-activated protein kinase pathways. Curr Op Cell Biol. 1997;9(2):180–186.
- Jenkins AJ, Velarde V, Klein RL, et al. Native and modified LDL activate extracellular signal-regulated kinases in mesangial cells. Diabetes. 2000;49(12):2160–2169.
- Sundberg LJ, Galante LM, Bill HM, et al. An endogenous inhibitor of focal adhesion kinase blocks Rac1/JNK but not Ras/ERK-dependent signaling in vascular smooth muscle cells. J Biol Chem. 2003;278(32):29783–29791.
- Velarde V, Jenkins AJ, Christopher J, et al. Activation of MAPK by modified low-density lipoproteins in vascular smooth muscle cells. J Appl Physiol. 2001;91(3):1412–1420.
- Yang GY, Yao JS, Huey M, et al. Participation of PI3K and ERK1/2 pathways are required for human brain vascular smooth muscle cell migration. Neurochem Int. 2004;44(6):441–446.
- Albanese C, Johnson J, Watanabe G, et al. Transforming p21ras mutants and c-Ets-2 activate the cyclin D1 promoter through distinguishable regions. J Biol Chem. 1995;270(40):23589–23597.
- Liu YC, Chang HW, Lai YC, et al. Serum responsiveness of the rat PCNA promoter involves the proximal ATF and AP-1 sites. FEBS Lett. 1998;441(2):200–204.
- Nelsen CJ, Rickheim DG, Timchenko NA, et al. Transient expression of cyclin D1 is sufficient to promote hepatocyte replication and liver growth in vivo. Cancer Res. 2001;61(23):8564–8568.
- Rickheim DG, Nelsen CJ, Fassett JT, et al. Differential regulation of cyclins D1 and D3 in hepatocyte proliferation. Hepatology. 2002;36(1):30–38.
- Kundu M, Guermah M, Roeder RG, et al. Interaction between cell cycle regulator, E2F-1, and NF-kappaB mediates repression of HIV-1 gene transcription. J Biol Chem. 1997;272(47):29468–29474.
- Siebenlist U, Franzoso G, Brown K. Structure, regulation and function of NF-kappa B. Annu Rev Cell Biol. 1994;10:405–455.
- Herber B, Truss M, Beato M, et al. Inducible regulatory elements in the human cyclin D1 promoter. Oncogene. 1994;9(4):1295–1304.
- Watanabe G, Albanese C, Lee RJ, et al. Inhibition of cyclin D1 kinase activity is associated with E2F-mediated inhibition of cyclin D1 promoter activity through E2F and Sp1. Mol Cell Biol. 1998;18(6):3212–3222.
- Lukas J, Bartkova J, Bartek J. Convergence of mitogenic signalling cascades from diverse classes of receptors at the cyclin D-cyclin-dependent kinase-pRb-controlled G1 checkpoint. Mol Cell Biol. 1996;16(12):6917.
- Sherr CJ. Cancer cell cycles. Science. 1996;274(5293):1672–1677.
- Weinberg RA. The retinoblastoma protein and cell cycle control. Cell. 1995;81(3):323–330.