
Abstract
Cell proliferation constitutes the fundamental process and driving force behind regrowth during liver regeneration (LR). However, it remains unclear how competing endogenous RNA (ceRNA) networks affect hepatocyte proliferation and liver regeneration. Therefore, this study was designed to explore an LR-specific ceRNA network, which regulates cell proliferation. Based on the microarray data of mRNAs, and high-throughput sequencing data of miRNAs and circRNAs from regenerating livers, this study initially applied known 1484 LR associated mRNAs to perform GO analysis, and then selected 169 LR associated mRNAs involved in cell proliferation and the cell cycle. Subsequently, 188 interactive miRNA–mRNA pairs and 5206 circRNA–miRNA pairs, respectively, were predicted using bioinformatics methods. Next, in view of the differential expressions of these ceRNAs during LR, 26 miRNA–mRNA pairs and 71 circRNA–miRNA pairs were applied to generate a circRNA–miRNA–mRNA regulatory network, and only 14 triple interactive groups were obtained based on the predicted inverse interactions among ceRNAs. Finally, circ_19698/miR-423-5p axis was demonstrated to promote cell proliferation by modulating the expression of MYC, CCNA2, and CCND1 in rat BRL-3A cells. This study suggests a potential regulatory mechanism of cell proliferation in regenerating livers, as well as a novel pathway for modulating ceRNA networks to promote liver regeneration.
Introduction
The liver maintains a unique and tremendous regeneration capacity in response to mass loss caused by a variety of injuries, or partial hepatectomy (PH). Following PH, residual liver cells are rapidly activated and enter the cell cycle to compensate for lost liver tissues, which is referred to as liver regeneration (LR). Typically, the LR process is divided into three steps: initiation, proliferation, and termination [Citation1], and the regenerative response has come to be regarded as the integration of numerous highly-coordinated biological events, including cell proliferation and growth [Citation2].
Liver cells make up 70–80% of the hepatic mass and 65% of the total hepatic cell population [Citation3,Citation4]. Therefore, central to these events is mature adult hepatocyte proliferation, which crucially contributes to the LR process [Citation5,Citation6]. However, there are significant variations between the types of liver cells at the onset and peak of replication of hepatic cells [Citation7]. Repopulation with newly generated liver cells is accommodated by massive tissue remodeling, which eventually restores lost liver mass. Thus, cell proliferation comprises the fundamental process and driving force behind liver regrowth. Further, detailed elucidation of the regulation of hepatic cell replication is critical for the development of clinical approaches toward liver repair.
Previous studies have revealed that hepatocyte proliferation is regulated by various cytokines and growth factors during the regenerative response to acute or early chronic liver injury [Citation8–10]. Moreover, in recent years, emerging evidence suggests that miRNA-mediated regulation plays crucial roles in controlling hepatocyte proliferation during LR [Citation11]. Song et al. [Citation12] found that liver cells with miRNA-deficiencies exhibited a delay in cell cycle progression, and the induction of miR-21 and repression of miR-378 was notably observed in the livers of wildtype mice following 2/3 PH. It was concluded that miR-21 and miR-378 are critical regulators of hepatocyte proliferation during liver regeneration. Chen et al. [Citation13] showed that miR_22a, miR_26a, miR_30b, and Let_7f were markedly decreased, and negatively correlated with highly up-regulated genes involved in the cell cycle, and proliferation in the remaining livers subsequent to 50% PH in rats. Zhang et al. [Citation14] indicated that miR-429 inhibited hepatocyte proliferation and liver regeneration via the targeting of JUN/MYC/BCL2/CCND1. As relates to the functions of circRNAs during cell proliferation, Bachmayr-Heyda et al. [Citation15] initially discovered a negative correlation between global circular RNA (circRNA) abundance and proliferation in colorectal cancer cell lines and cancer tissues. Furthermore, one of our previous studies indicated that the host linear transcripts of circRNAs contributed critically to the process of energy metabolism, substance metabolism, and hepatocyte proliferation during the early phase of rat [Citation16].
The competing endogenous RNA (ceRNA) hypothesis refers to a new pattern of posttranscriptional gene regulation, according to which the expression of a specific miRNA may be temporarily reduced due to ceRNA [Citation17]. CeRNAs include encoding mRNAs, long noncoding RNAs (lncRNAs), and pseudogenes that cross-regulate each other by competing for shared miRNAs. They also contain circRNAs, which might serve as natural microRNA sponges to express their functions at the transcriptional or post-transcriptional level [Citation18,Citation19]. Recently, Bai et al. [Citation20] analyzed the regulatory role of the lncRNA-miRNA-mRNA network during the proliferative phase of rat liver regeneration. Moreover, accumulating evidence has revealed that the circRNA-miRNA-mRNA regulatory network has been demonstrated to be involved in gastric cancer [Citation21], pancreatic ductal adenocarcinoma [Citation22], hepatocellular carcinoma [Citation23], etc/and more.
However, it remains unclear, and intriguing, as to how the circRNA–miRNA–mRNA network modulates cell proliferation in LR. Therefore, this study was designed to explore a circRNA–miRNA–mRNA network involved in regulating cell proliferation and cell cycles, based on the high-throughput sequencing data of mRNAs, miRNAs, and circRNAs in regenerating livers subsequent to PH. The ceRNA regulatory network will provide novel data toward further elucidating the mechanisms of cell proliferation in regenerating livers, while opening up new prospects for modulating ceRNA networks to promote liver regeneration.
Materials and methods
Preparation of partial hepatectomy model
Male Sprague–Dawley rats (age: 8–10 weeks, body weight: 200–220 g) were obtained from the Laboratory Animal Center of Zhengzhou University (Zhengzhou, China). The animals were housed in standard cages for at least one week prior to the experiments. The animals were kept under a constant temperature of 22 ± 1 °C, relative humidity of 55–65%, and a 12 h light/dark cycle. A total of 114 adult male rats (10–12 weeks old) were selected and randomly divided into 19 groups with six rats in each: nine partial hepatectomy (PH) groups, nine shamoperated (SO) groups, and one normal control (NC) group.
A 2/3 PH was performed on rats as previously described by Higgins and Anderson [Citation24] using ether anesthesia. The SO groups were subjected to the same procedure as the PH groups, albeit without liver removal. The right lobes of the livers were harvested at each of the following time points: 0, 2, 6, 12, 24, 30, 36, 72, 120 and 168 h following surgery. The liver tissues of six rats from each time point from the PH or SO groups were mixed and considered as the sample of this time point, and then stored at −80 °C following liquid nitrogen freezing. All experiments complied with the guidelines for the care and use of experimental animals of the Ministry of Science of the People’s Republic of China.
High-throughput mRNA, miRNA and circRNA data
The raw and processed microarray data of the mRNAs used in this study were derived from our lab, which was also available in the GEO database (accession number: GSE63742). However, the library preparation and high-throughput sequencing of the miRNAs and circRNAs were performed by Shanghai OE Biotech (Shanghai, China). Briefly, the total RNA of the liver tissues was extracted with the TRIzol reagent (Invitrogen, Carlsbad, CA/USA), whereas the quality and integrity of the total RNA were detected using a Qubit® 2.0 Fluorometer (Invitrogen, Carlsbad, CA/USA) and Agilent 2100 Bioanalyzer (Agilent Technologies, Santa Clara, CA/USA), respectively. Only samples with an RNA Integrity Number (RIN) ≥7 were subjected to subsequent purification using the mirVanaTM miRNA Isolation Kit (Ambion, Austin, TX) as instructed by the manufacturer, whereas library preparation and sequencing were performed according to the Illumina small RNA sample preparation protocol.
The raw data generated by Illumina sequencing were analyzed as previously described [Citation25]. The expression abundance of each unique miRNA for each library was normalized to obtain the expression of the transcript per million using the following formula: normalized expression = actual miRNA count/total count of clean reads × 1,000,000 [Citation26]. For the high-throughput sequencing of the circRNAs in LR, only samples with RIN ≥ 7 were subjected to subsequent analysis, and the libraries were constructed using TruSeq Stranded Total RNA with Ribo-Zero Gold (Illumina, San Diego, CA, USA) and Ribonuclease R according to the manufacturer’s instructions. These libraries were then sequenced using the Illumina sequencing platform (HiSeqTM 2500 or other platforms) and 150 or 125 bp paired-end reads were generated.
Identification of LR-associated mRNAs, miRNAs and circRNAs
The identification of differentially expressed mRNAs and liver regeneration associated mRNAs was performed according to our previously described procedure [Citation27]. Briefly, the ratio of each mRNA was calculated by comparing its normalized expression in a PH group or SO group to that in a normal control group. Next, we selected the mRNAs with a ratio value of ≥2 or ≤0.5 in the PH group as the significantly changed mRNAs. Subsequently, a t-test was employed to analyze whether the differences of the selected mRNAs were significant at the same time point between the PH and SO groups. The mRNAs with a significant difference (0.01 < p < 0.05) or extremely significant difference (p <0 .01) between the PH and SO groups, were referred to as LR-associated mRNAs.
On the other hand, this study used a ratio value (expression value in the PH group/SO group) to calculate the miRNA or circRNA expression changes at the same time point. Differentially expressed (DE) miRNAs or circRNAs were identified by two statistical criteria (ratio ≥2 or ≤0.5 and p ≤ 0.05) by the negative binomial distribution test based on the DESeq package of the same miRNA or circRNA at the same time point. In particular, miRNAs or circRNAs were considered to be up-regulated when the ratio was ≥2, and down-regulated when ≤0.5 for at least one time point [Citation16,Citation20].
qRT-PCR validation of mRNA, miRNA and circRNA high-throughput data
The reliability of the mRNA microarray data has been validated by qRT-PCR by several previous studies in our lab. The expressions of several target genes, including Trim24, Jun, Myc, Icam1, G6pc, Mgmt, Pcna, Hmgn1, Spp1, Ikbkb, Fos, and Bcl2 were respectively confirmed in regenerating liver tissues in three references [Citation27–29]. To validate the reliability of miRNA high-throughput sequencing data, six rat liver regeneration-related miRNAs (miR-143, miR-181c, miR-182, miR-183, miR-199a, and miR-429) were selected by Geng et al. [Citation30] for qRT-PCR validation. Furthermore, six circRNAs, including circ_432, circ_2077, circ_1366, circ_15, circ_137, and circ_2270 were selected to validate the reliability of high-throughput RNA sequencing, and explore the circRNA expression trend during the whole rat LR process [Citation16].
Selection of potential cell proliferation-related mRNAs
As increasing numbers of unknown mRNAs in rats have been studied and annotated in recent years, we renewed the related information for the unknown LR-related mRNAs obtained in one of our previous investigations [Citation28] and identified additional newly discovered mRNAs. For further analysis, only the known LR associated mRNAs were selected to perform Gene Ontology (GO) analysis (http://geneontology.org) (which describes the genes from any organism used), covering the domains of biological process (BP), cellular component (CC), and molecular function (MF).
The GO categories with enrichment scores of <0.05 and < 0.01 are considered to be significantly and highly significantly over-represented, respectively [Citation31]. The top enriched GO terms of mRNAs were ranked by the enrichment score (−log10 (p-values)). Subsequently, the biological processes related to cell proliferation were screened and displayed, and the genes involved in these biological processes were selected, following the removal of duplicity, and considered as cell proliferation-related genes during rat liver regeneration. To comprehensively characterize the expression patterns of cell proliferation-related mRNAs during LR, k-means clustering was employed to classify the significantly changed mRNAs according to gene expression similarities.
Prediction of miRNA–mRNA interactions
It is recognized that miRNAs control a large set of biological processes through direct interactions with their target mRNA [Citation32]. For high-throughput experimental studies, miRNA function is typically defined through bioinformatics analysis using TargetScan, miRWalk, PicTar, and so on. In this study, the upstream miRNAs for cell proliferation-related mRNAs were predicted using TargetScan v7.1 (http://www.targetscan.org/vert_71) [Citation33] and miRWalk v3.0 (http://mirwalk.umm.uni-heidelberg.de/) [Citation34]. The selection of interactive pairs between mRNAs and miRNAs was carried out using a total context ++ score of ≤ −0.5 for TargetScan software [Citation35,Citation36], and energy ≤ −30 for the miRWalk algorithm [Citation37]. Only the interactive pairs predicted by both algorithms to have a strong likelihood of interaction were selected for further analysis.
Prediction of circRNA–miRNA interactions
CircRNAs can serve as a miRNA sponge to affect gene expression at the post-transcriptional level [Citation18]. The upstream circRNAs for the abovementioned predicted miRNAs were collected following the use of miRanda [Citation38] for prediction, and the interactions between the miRNAs and circRNAs were defined with a maximum binding Max energy of −30, and a minimum Max score of 150.
Construction of circRNA–miRNA–mRNA regulatory network
Multiple miRNA–mRNA and circRNA–miRNA interactive pairs were generated subsequent to the interaction predictions. There were two criteria of selecting the appropriate pairs for circRNA–miRNA–mRNA regulatory network construction. Firstly, the pairs (including mRNA–miRNA pairs and circRNA–miRNA pairs) that targeted the same miRNA were prioritized for selection, such that the interactive relationships between three regulators, including circRNAs, miRNAs, and mRNAs could be successfully established. Secondly, the selected circRNAs or miRNAs pairs should be LR-associated. Thirdly, a circRNA–miRNA–mRNA regulatory network was constructed by using a combination of obtained circRNA–miRNA and miRNA–mRNA pairs. Finally, the regulatory network was visualized using Cytoscape 3.4.0 [Citation31], where circle nodes represented circRNAs and triangle nodes represented miRNAs.
Validation of ceRNA regulatory network
It is generally accepted that circRNAs often function as miRNA sponges [Citation39]. Moreover, Chen et al. [Citation13] reported that a negative correlation existed between down-regulated miRNAs and highly up-regulated genes involved in the cell cycle and proliferation in the remaining livers. Therefore, according to the negative circRNA–miRNA and miRNA–mRNA correlations, several key interactive groups were selected for further study.
Transfection of circ_19698 interference fragments
To detect the effects of circ_19698 on the growth of rat liver cell line BRL-3A, the siRNAs for circ_19698 were designed across its reverse linkage sites and synthesized according to the sequence of circ_19698 by Shanghai Jima Pharmaceutical Technology Co., Ltd., and a scrambled sequence (Si-scramble) served as a negative control. Consequently, Si-circ_19698-1, Si-circ_19698-2 and Si-scramble are displayed in . The BRL-3A cells were inoculated (2 × 10⁵cells/well) in a six-well plate for 14–18 h under a humidified atmosphere containing 95% air and 5% CO2 at 37 °C. Subsequently, the siRNAs (Si-circ_19698-1, Si-circ_19698-2, Si-scramble) were separately transfected to BRL-3A liver cells using Lipofectamine RNAiMAX with serum-free medium.
Table 1. siRNAs sequences corresponding to circ_19698.
Quantitative real-time PCR
Following transfection with Si-circ_19698-1, Si-circ_19698-2, and Si-scramble, respectively, for 48 h, the BRL-3A cells were collected for quantitative real-time PCR to determine the efficiency of siRNA interference. When the more efficient siRNA for circ_19698 was determined, Tnfrsf21 (the host linear transcript of circ_19698) and some downstream target genes, including miR-423-5p, Myc, Ccna2, Ccnd1, and Pcna were further selected for quantitative real-time PCR analysis in the more efficient siRNA-transfected group and Si-scramble group. The primers were designed with Primer Express 2.0 software according to the mRNA sequences of the seven genes listed before and synthesized by Shanghai Generay Biotech Co., Ltd. (). The qRT-PCR assays were carried out as previously described [Citation40] using abovementioned specific primers, and relative expression changes were calculated using the 2−ΔΔCt method.
Table 2. The primers used in qRT-PCR assays.
MTT assay
Cell viability was measured using a methyl thiazolyl tetrazolium (MTT) assay. Briefly, 5 × 10³ cells were seeded into each well of a 96-well culture plate and cultured for 24, 48 and 72 h, respectively. Lipofectamine RNAiMAX and Si-circ_19698 were then added to form a complex containing a 7.5 μL/well transfection reagent and 25 pmol/well Si-circ_19698. Once a 10 µL of MTT solution (Geneview, USA, 5 mg/mL) was added into each well, the cells were incubated for 4 h in the dark at 37 °C. Subsequently, the medium was replaced with 100 µL of dimethylsulfoxide (DMSO) (Sigma, St. Louis, MO,USA), after which the absorbance at 490 nm was measured using a Biotek reader (ELx800, Winooski, VT/USA), with each test being repeated for a total of three duplicates.
Flow cytometry analysis
Cell cycles were analyzed via a flow cytometry method. Cells from each group were harvested at 48 h following treatment and rinsed with PBS. For cell cycle evaluation, the samples were fixed with 70% pre-chilled ethanol and then incubated in PBS with 0.2 mg/mL RNase A (Solarbio, China) at 37 °C, followed by staining with PI (20 μg/mL, Sigma, USA) in dark for 15 min. Finally, the scatter signals of the cells were detected using a FACSCalibur flow cytometer (BD Biosciences, San Jose, CA), and the cell cycle profiles were analyzed employing FlowJo software.
Western blot
The expressions of several key proteins following circ_19698 interference in rat BRL-3A liver cells were measured by western blot (WB) analysis. Briefly, 20 μg of proteins from BRL-3A cells after being transfected with Si-circ_19698 or Si-scramble were separated by SDS-PAGE, and then transferred to a PVDF membrane (GE Healthcare). Once transferred, and blocked with 5% non-fat-milk, the membranes were subsequently incubated overnight at 4 °C with the antibodies, β-actin, MYC, CCNA2, CCND1 and PCNA (Cell Signaling Technology) at a dilution of 1:2500. Subsequently, the membrane was incubated with horseradish peroxidase-conjugated secondary antibodies goat anti-rabbit IgG (Cell signalling, 1:5000) for 2 h. Finally, the bands were visualized with the enhanced chemiluminescence substrate (Western Lightning® Plus-ECL), and Image QuantTMTL (Sigma, USA) was employed to measure the relative abundances of target proteins, where β-actin served as an internal reference at a dilution of 1:1000.
Results
Functional enrichment analysis of differentially expressed mRNAs in LR
Liver regeneration associated mRNAs were identified in one of our previous studies [Citation28], which found that 1,004 known genes and 857 unknown genes were related to rat LR. However, as increasing numbers of unknown genes in rat have been studied and annotated, we renewed the data of 857 unknown genes and identified more than 400 genes (480) as newly discovered genes. Consequently, 1484 (1004 + 480) known mRNAs were found to be associated with liver regeneration, which were then used for GO analysis to identify over-represented categories.
The results revealed that several hundred biological processes (BPs), including metabolic processes, stress responses, signal regulation, gene expression regulation, transport, cell death regulation, cell proliferation regulation, and cell cycle regulation were significantly enriched (), indicating that these GO terms were highly modulated during liver regeneration. Obviously, cell proliferation regulation and cell cycle regulation were ranked among the top nine enriched biological processes.
Figure 1. GO enrichment analysis of 1484 known LR-associated mRNAs. (A) The top nine over-represented biological processes are displayed, which indicate that 1484 mRNAs were primarily involved in these biological processes, and the terms including cell proliferation regulation and cell cycle regulation ranked among the top nine. The Y-axis represents the top ranked GO biological terms, and different colors denote different GO biological terms; the X-axis represents related mRNA numbers. (B) Several cell proliferation-related biological processes were enriched and selected. The Y-axis represents the GO biological terms related to cell proliferation, and different colors denote different GO biological terms; the X-axis represents related mRNA numbers.
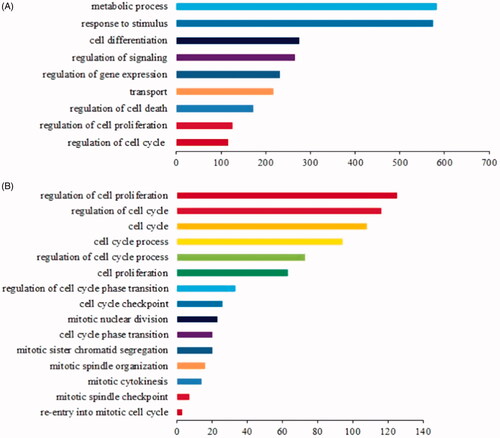
Based on the fact that liver cell proliferation vitally contributes to the process of liver regeneration, all enriched cell proliferation-related biological processes were selected and displayed in order (. Clearly, there were 125 and 116 genes enriched in the regulation of cell proliferation and the regulation of the cell cycle, respectively, with some key biological processes involved in cell cycle transition and mitosis also being over-represented with less related genes.
Expression profiles of cell proliferation-related mRNAs in LR
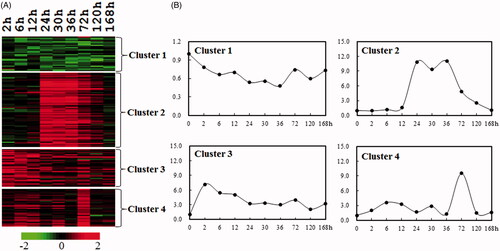
To identify cell proliferation-related genes during rat liver regeneration, the genes involved in these biological processes () were further collected. A total of 169 genes, including 121 up-regulated, 28 down-regulated, and 20 up/down-regulated, were considered as cell proliferation-related genes in LR (Table S1). Subsequently, to further elucidate the expression profiles of cell proliferation-related genes during rat liver regeneration, the abovementioned 169 genes were categorized into four clusters by k-means according to gene expression similarities (. There were 31 genes collected in Cluster 1 (C1), which were down-regulated during LR. Cluster 2 (C2) included 70 genes, such as cell cyclin genes Ccna2, Ccnb1, Ccnd1, Ccne1, Ccne2, cell division cycle genes Cdc2a, Cdc20, Cdc25b, and kinesin family genes Kifc1, Kif2c, Kif11, Kif2, and Kif23, which exhibited a striking up-regulation with peaking at 24–72 h following PH, which corresponded to the proliferation phase of LR [Citation1], suggesting that the collected cell proliferation-related genes were relatively reliable. Most of the chemotactic factors and cytokines-related genes were contained in Cluster 3 (C3, 35 genes) and Cluster 4 (C4, 30 genes). However, C3 exhibited an obvious up-regulation, with peaking at 2–12 h following PH, while C4 displayed an obvious peak at 72 h after PH (.
Figure 2. Cluster analysis of the expression profiles of cell proliferation-related mRNAs during rat liver regeneration. (A) K-means clustering of total significantly changed 169 cell proliferation-related genes. Red and green denote the expression levels higher and lower than the control, respectively. (B) The line graph showing the different expression patterns of four clusters (C1–C4). X-axis represents 10 time points following rat partial hepatectomy, and the Y-axis represents the mean expression level of each cluster.
Predictive results of circRNA–miRNA and miRNA–mRNA interactions
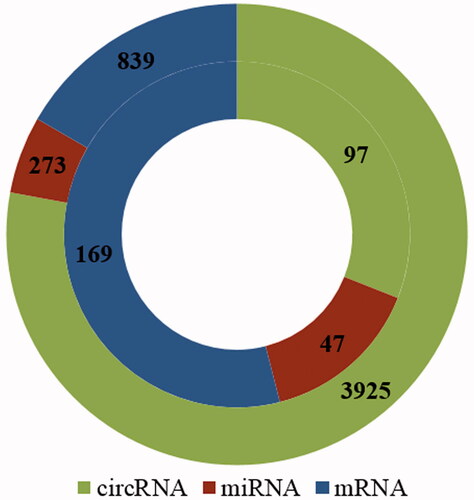
Based on the GO database, it was found that there were 839 genes (mRNA) related to cell proliferation in rat. After using miRanda to predict the circRNA-miRNA pairs, TargetScan and miRWalk were employed to predict the miRNA-mRNA pairs. This study found that 512 of a total of 839 mRNAs had target relationships with 273 miRNAs, and formed 1103 miRNA–mRNA pairs according to the threshold of total context ++ score (≤ −0.5) using TargetScan. Further, 194 of 273 miRNAs were observed to interact with 3925 circRNAs and constructed 9227 circRNA-miRNA pairs, according to the threshold of max energy and max score (Max energy ≤ −30, Max score ≥150).
Likewise, the abovementioned 169 cell proliferation and liver regeneration-related mRNAs were used to predict miRNA-mRNA interactions, and it was found that 92 of 169 mRNAs could form 188 pairs with 133 miRNAs, 47 of which were liver regeneration-associated miRNAs. When 133 miRNAs were applied to predict circRNA-miRNA pairs, the results revealed that 97 of 133 miRNAs could establish 5206 pairs with 2737 circRNAs, whereas only 97 circRNAs were found to be significantly altered and associated with LR (.
Figure 3. The numbers of circRNAs, miRNAs, and mRNAs obtained by circRNA–miRNA pair and miRNA–mRNA pair prediction. Outer circle denotes the numbers of circRNAs, miRNAs and mRNAs, which are related only to cell proliferation in rat; Inner circle indicates the numbers of circRNAs, miRNAs and mRNAs which are related to both cell proliferation and rat liver regeneration.
CircRNA–miRNA–mRNA regulatory network involved in cell proliferation during LR
As mentioned above, 188 miRNA–mRNA pairs and 5206 circRNA–miRNA pairs were obtained when beginning the prediction, with 169 cell proliferation and liver regeneration-related mRNAs. However, when we considered that all involved miRNAs and circRNAs should be significantly changed, there were only 26 miRNA–mRNA pairs and 71 circRNA–miRNA pairs remaining. Subsequently, a combination of 26 miRNA–mRNA pairs and 71 circRNA–miRNA pairs was used to construct a circRNA–miRNA–mRNA regulatory network, and was visualized using Cytoscape 3.4.0 (), which contained 103 circRNA–miRNA–mRNA interactive groups (Table S2) and rat LR-associated circRNAs (48), miRNAs (20), and mRNAs (23).
Figure 4. The circRNA–miRNA–mRNA interactive network regulating the process of cell proliferation and cell cycle during rat liver regeneration. Green circle nodes represent circRNAs, red triangle nodes represent miRNAs, and blue rectangle nodes represent mRNAs.
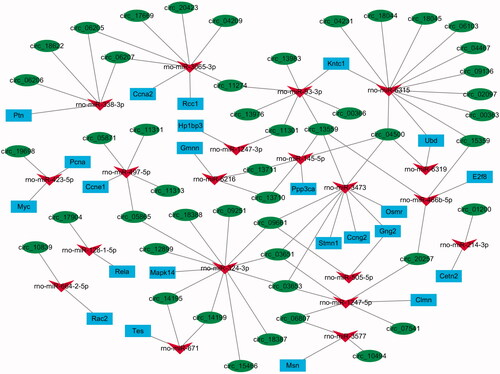
As shown in , four circRNAs (circ_04500, circ_13559, circ_13710 and circ_13711) interacted with miR-15-5p and Ppp3ca; 12 circRNAs (circ_04209, circ_06205 and circ_06207 et al.) interacted with miR-3065-3p and 2 mRNAs (Ccna2 and Rcc1); Mapk14 was regulated by miR-324-3p and 11 circRNAs (circ_03651, circ_03653, circ_05865 et al.); 4 circRNAs (circ_06205, circ_06206, circ_06207, circ_18622) interacted with miR-338-3p and Ptn; 20 circRNAs (circ_03651, circ_003653 and circ_04500 et al.) could regulate 4 mRNAs (Ccng, Gng2, Smr and Stmn1) through miR-3473; Kntc1 and Ubd were regulated by 26 circRNAs (circ_00363, circ_02097 and circ_4231 et al.) and 2 miRNAs (miR-6315 and miR-93-3p).
According to the negative circRNA-miRNA and miRNA-mRNA correlations, the abovementioned interactive network () was further analyzed, and only 14 groups were obtained from 103 circRNA–miRNA–mRNA interactive groups. As shown in , rno-miR-1247-5p can be targeted by 3 circRNAs, and then regulated Clmn. Ppp3ca could be regulated by rno-miR-145-5p and four circRNAs. Five circRNAs could all target Ccng2 through rno-miR-3473. More apparently, circ_19698 increased the expressions of Myc and Pcna only through negatively modulating the expression of rno-miR-423-5p.
Table 3. Fourteen circRNA–miRNA–mRNA groups obtained from circRNA–miRNA negative correlation and miRNA–mRNA negative correlation analysis.
Circ_19698 regulated cell proliferation in vitro
According to the prediction results shown in and , only circ_19698 and rno-miR-423-5p clearly and uniquely exhibited regulatory relationships between all the circRNA-miRNA pairs, although rno-miR-423-5p could regulate the expressions of two target genes, including Myc and Pcna. Furthermore, there have been several studies that demonstrated the targets of miR-423-5p [Citation41], which assisted with verifying and comparing our results to other studies. Therefore, the circ_19698/miR-423-5p axis may positively regulate cell proliferation during LR, which was then was selected for the further functional validation of the ceRNA regulatory network in vitro.
Examination of siRNA efficiency
The effects of circ_19698 on the proliferation of BRL-3A rat liver cells were examined through interference experiments. Once Si-circ_19698-1, Si-circ_19698-2, and Si-scramble were respectively transfected into BRL-3A rat liver cells for 48 h, the results of qRT-PCR showed that the expressions of circ_19698 in BRL-3A were significantly decreased in Si-circ_19698-1 and Si-circ_19698-2 groups over that of the Si-scramble group, and the expression ratios of circ_19698 were 26.72 ± 4.50% (**p <0.01) and 55.0 ± 2.0% (*p <0.05) for Si-circ_19698-1 and Si-circ_19698-2, respectively (. Therefore, Si-circ_19698-1 was selected and used in later experiments due to its higher interference efficacy.
Figure 5. qRT-PCR results indicating the evaluation of siRNAs targeting circ_19698 and the effects of Si-circ_19698-1 on the expressions of Tnfrsf21 and miR-423-5p in BRL-3A cells following transfection for 48 h. (A) Si-circ_19698-1 was more efficient than Si-circ_19698-2 in inhibiting the expression of circ_19698 when compared with Si-scramble. (B) The more efficient Si-circ_19698-1 led to the down-regulation of Tnfrsf21 (the linear host gene for circ_19698). (C) The more efficient Si-circ_19698-1 led to the obvious up-regulation of a potential target rno-miR-423-5p. *p < .05, **p < .01 vs. the Si-scramble group.
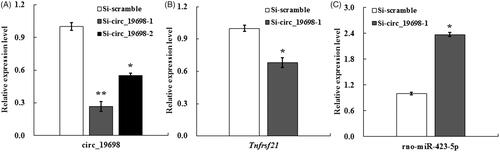
Previous research has revealed positive correlations between the circRNA abundance and expression levels of linear host genes in several cell lines or tissues [Citation42,Citation43]. One of our previous studies found that the expression profiles of circ_19698 and Tnfrsf21 (linear host transcript for circ_19698) exhibited similarities during rat LR when detected by qRT-PCR, which demonstrated positive correlations between circ_19698 and Tnfrsf21 [Citation16]. Though Si-circ_19698-1 was specifically designed across the reverse linkage site of circ_19698, the transfection of Si-circ_19698-1 also led to the down-regulation of Tnfrsf21 due to similarities between the circ_19698 and Tnfrsf21 sequences (*p < 0.05) (. However, the ratio of decrease for circ_19698 was higher than that for Tnfrsf21. Thereafter, this study detected the expression of miR-423-5p because of the predicted unique correlation between circ_19698 and miR-423-5p, and found that Si-circ_19698-1 significantly enhanced the expression of miR-423-5p (*p < 0.05) (), demonstrating that miR-423-5p could be influenced by circ_19698.
Si-circ_19698-1 suppressed cell viability and cell cycle progression
To investigate the effects of circ_19698 on the viability of BRL-3A cells, MTT assays were performed at 24, 48, and 72 h after transiently transfecting BRL-3A cells with Si-circ_19698-1 and Si-scramble, respectively, The results revealed that the absorbance values in the Si-circ_19698-1 group were significantly decreased over those in the Si-scramble group at 48 and 72 h, indicating that Si-circ_19698-1 inhibited the viability of BRL-3A cells (*p < 0.05) (. Since the high density of transfected cells caused contact inhibition at 72 h, it was more suitable for further experiments to choose 48 h as the detection time point following transfection.
Figure 6. Effects of circ_19698 interference on the growth of BRL-3A liver cells. (A) MTT detection result showed the inhibitory effects of Si-circ_19698-1 on cell viability at indicated time points. (B) Histogram analysis of the flow cytometry results indicated that Si-circ_19698-1 led to cell cycle arrest at the G0/G1 phase compared with the Si-scramble group once BRL-3A cells were treated for 48 h. *p < .05, **p < .01 vs. the Si-scramble group.
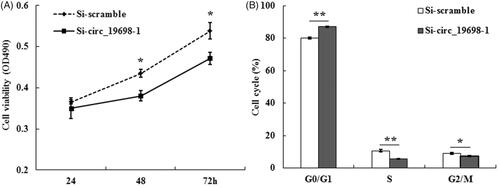
The BRL-3A cells were harvested after being seeded in a six-well plate for 48 h, and the cell cycle distribution was detected by flow cytometry after dyeing with PI. The results in reveal that the cell population in the G0/G1 phase in Si-circ_19698-1 group (87.15 ± 0.25%, **p < 0.01) was significantly higher than that in the Si-scramble group (80.15 ± 0.55%), while the proportion of cells in the S phase in the Si-circ_19698-1 group (5.53 ± 0.14%, **p < 0.01) was significantly decreased over that in the Si-scramble group (10.67 ± 0.70%). Thus, Si-circ_19698-1 resulted in the blockage of the cell cycle for rat BRL-3A liver cells at the G0/G1 phase.
Si-circ_19698-1 inhibited the expressions of target cell proliferation-related genes/proteins
Notably, Myc and Pcna were predicted as two targets in the circ_19698/miR-423-5p axis. In addition, CCNA2 and CCND1 are major regulators of the G1-S transition. Therefore, we detected the expressions of Myc, Pcna, Ccna2 and Ccnd1 by qRT-PCR following Si-circ_19698-1 transfection, and found that Si-circ_19698-1 caused more than a 40% decline in the expressions of the four genes listed above, with Ccna2 more highly down-regulated in BRL-3A cells (*p < 0.05) (. Subsequently, we also performed western blotting to detect their protein expression, and Myc and Ccna2 were found to be more significantly attenuated, while Ccnd1 was also remarkably decreased following circ_19698 interference.
Figure 7. Effects of circ_19698 interference on the expression of cell proliferation-related genes and proteins in BRL-3A cells. The mRNA and protein were extracted from cultured BRL-3A rat liver cells. The results shown are representative of three individual experiments. (A) Expression of Myc, Pcna, Ccna2, and Ccnd1 mRNAs in BRL-3A cells. The results were normalized to β-actin and expressed as mean ± SD. (B) Expression of MYC, PCNA, CCNA2, and CCND1 proteins in BRL-3A cells. β-actin was used as the internal control. The intensities of these proteins were quantified, normalized to β-actin, and expressed as mean ± SD. *p < .05, **p < .01 vs. the Si-scramble group.
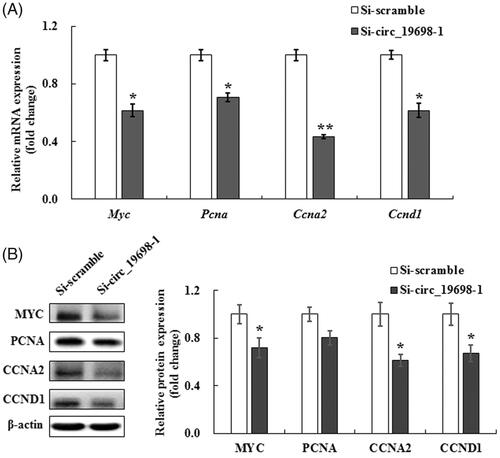
However, PCNA protein expression was obviously not decreased in contrast to the Si-scramble group (. There were negative relationships between the expression of circ_19698 and miR-423-5p, as well as the expression of miR-423-5p and potential targets. Transfection with Si-circ_19698-1 caused a decrease in potential target expression. These results suggested that the circ_19698/miR-423-5p axis influenced the expression of MYC, CCNA2 and CCND1, and finally regulated the proliferation of rat liver BRL-3A cells.
Discussion
To explore the circRNA–miRNA–mRNA network involved in the modulation of cell proliferation and cell cycles during LR, this study initially renewed the data of all unknown LR-related mRNAs (857) obtained in one of our previous investigations [Citation28], and identified 480 mRNAs from 857 as newly discovered mRNAs, which were then employed to perform GO enrichment analysis with 1,004 previously identified mRNAs. The results indicated that the GO terms, including cell proliferation and cell cycles, were over-represented and ranked relatively ahead. Once 169 cell proliferation and cell cycle-related genes were collected from the GO database, they were classified into four clusters, which were then employed to predict the miRNA–mRNA and circRNA–miRNA target relationships. Subsequently, 188 miRNA–mRNA pairs and 5206 circRNA–miRNA pairs were respectively predicted using bioinformatics methods. Then, in view of the significant expressions of miRNAs and circRNAs during rat LR, only 26 miRNA–mRNA pairs and 71 circRNA–miRNA pairs were selected and applied to generate a global regulatory network of circRNA–miRNA–mRNA. Finally, only 14 of 103 triple interaction groups were obtained based on negative correlations between miRNA and mRNA, and the inverse expression patterns between miRNA and circRNA.
One study revealed that the ectopic overexpression of miR-1247-5p markedly inhibited the proliferation of HepG2 cells in vitro, and concluded that it functioned as a tumor suppressor in human hepatocellular carcinoma by targeting Wnt3 [Citation44]. Moreover, miR-1247-5p was overexpressed in castration-resistant prostate cancer (CRPC) and was found to target MYCBP2 (myc-binding protein 2) in prostate cancer cell lines [Citation45]. However, Clmn was predicted to be targeted by miR-1247-5p in this study, and both of them exhibited significant changes during liver regeneration. In a study by Marzinke and Clagett-Dame [Citation46], Clmn was found to participate in G(1)/S arrest, and Clmn overexpression alone was sufficient to inhibit the proliferation of neuroblastoma cells N2A. On the basis of the up-regulation of miR-1247-5p and down-regulation of Clmn during LR, we concluded that miR-1247-5p could induce cell proliferation by targeting Clmn during LR, indicating that the same miRNA may target various genes in different contexts [Citation47,Citation48]. However, the direct regulatory relationship between miR-1247-5p and Clmn should be established using a luciferase assay in future studies.
MiR-145-5p was reported to inhibit the proliferation of rat mesangial cells (RMCs) and vascular smooth muscle cells (VSMCs) by targeting different genes [Citation49,Citation50]. Protein phosphatase 3 catalytic subunit alpha is encoded by PPP3CA, and Ding et al. [Citation51] found that overexpressing hsa-miR-145-5p significantly reduced the mRNA expression of PPP3CA, which likely affected the cell cycle and invasion of the laryngeal squamous cell carcinoma (LSCC) cell line Tu-177. Therefore, in view of the inverse expression of miR-145-5p and Ppp3ca during LR, this study deduced that miR-145-5p/Ppp3ca likely inhibited the proliferation of hepatic cells.
Cyclins A2 (CCNA2) and Cyclin E1 (CCNE1) regulated the cell cycle by promoting S phase entry and progression, and this study found that the two genes shared the same expression profile and both were significantly modified at 24–36 h, which implied that they likely promoted hepatic cell proliferation during rat LR. However, the cyclin family protein CCNG2 functions to coordinate the S phase and cell division; thus, CCNG2 overexpression might induce apoptosis and inhibit the proliferation of human astrocytoma cells [Citation52]. Further, Qiao et al. [Citation53] found that the inhibition of miR-135A1 expression led to cell cycle arrest and inhibited the proliferation of human colorectal cancer cells by increasing CCNG2 expression. Interestingly, Ccng2 was observed to be clearly down-regulated at 2–12 h following rat PH in this study, which suggested its role in the initiation of LR. Further, Ccng2 could possibly be targeted by miR-3473 through TargetScan prediction. However, rno-miR-3473 demonstrated increased expression at 36 and 72 h, which was not consistent with the time points of Ccng2 down-regulation. This suggested that they may not interact with each other, and likely functioned differently during LR.
Obviously, among all the significantly-changed circRNAs, circ_19698 exhibited the highest expression level during liver regeneration. To further investigate the regulatory role of circ_19698 on rat BRL-3A liver cells, we decreased the expression of circ_19698 using siRNA transfection and found that the transfection of Si-circ_19698-1 could significantly attenuate the expression of circ_19698. However, Si-circ_19698-1 also led to the obvious down-regulation of Tnfrsf21 (the linear host gene for circ_19698). TNFRSF21, also called death receptor 6 (DR6), belongs to the tumor necrosis factor receptor super-family, and is often reported to induce cell apoptosis [Citation54,Citation55], or inhibit the proliferation and invasion of head and neck squamous cell carcinoma cells [Citation56]. Therefore, TNFRSF21 likely exhibited a reduced inhibitory effect on the proliferation of BRL3A cells and antagonized the inhibitory role of Si-circ_19698-1 during BRL3A proliferation, once its expression was decreased by Si-circ_19698-1.
Moreover, it is notable that circ_19698 was predicted to interact only with miR-423-5p. Due to the attenuated expression of circ_19698 induced by Si-circ_19698-1, miR-423-5p was then found to be up-regulated, while cell viability and cell cycle processes were significantly suppressed, which implied that the circ_19698/miR-423-5p axis can affect cell proliferation. Thereafter, MYC and PCNA were predicted as two targets of miR-423-5p, and we also found that their mRNA levels tended to be significantly down-regulated due to circ_19698 interference in vitro. Meanwhile, the MYC protein was significantly attenuated, while the PCNA protein was not significantly changed. Coincidentally, to a certain extent, miR-423-5p was predicted to target PCNA, and the regulatory mechanisms may be the mRNA degradation of PCNA in the ovary of low-protein piglets [Citation41]. However, it still needs to be further verified whether PCNA or MYC may be directly targeted by miR-423-5p through luciferase reporter assays in rat BRL-3A cells. Moreover, CCNA2 and CCND1 (two major regulators of the G1/S transition) were not predicted as targets of miR-423-5p, and also displayed an obvious down-regulation in mRNA and protein levels following circ_19698 interference in rat BRL-3A liver cells, which may have accounted for the suppression of entry into the S phase of the cell cycle, as indicated by the results of flow cytometry analysis. Liu et al. revealed that miR-423-5p induced cell proliferation and invasion, and influenced the expression of cyclin D1 and two other genes via the targeting of TFF1 (Trefoil Factor 1) in gastric cancer cells [Citation57]. However, we found that the expressions of miR-423-5p and CCND1, rather than that of TFF1 were differentially changed during the LR process. Therefore, it remains elusive how the circ_19698/miR-423-5p axis regulates the expressions of CCND1 and CCNA2 in the LR process and rat BRL-3A liver cells.
In conclusion, this study combined high-throughput data screening and bioinformatics to construct a ceRNA network, which contained 103 interactive circRNA–miRNA–mRNA groups and involved significantly expressed circRNAs (48), miRNAs (20), and mRNAs (23) during rat liver regeneration, and then applied in vitro experiments to show that the circ_19698/miR-423-5p axis may promote cell proliferation by modulating cell cycle transitions and the expression of MYC, CCNA2 and CCND1 in BRL-3A cells. This study proposed that a specific circRNA–miRNA–mRNA network is associated with cell proliferation induced by partial hepatectomy, which will assist with elucidating the potential mechanisms involved in cell proliferation during LR. However, it does have a number of limitations, which warrants further detailed studies in the future.
Ethical approval
All experiments complied with the guidelines for the care and use of experimental animals of the Ministry of Science of the People’s Republic of China.
Disclosure statement
The authors report no conflicts of interest related to this manuscript.
Additional information
Funding
Related Research Data
References
- Pahlavan PS, Feldmann RE, Jr., Zavos C, et al. Prometheus’ challenge: molecular, cellular and systemic aspects of liver regeneration. J Surg Res. 2006;134(2):238–251.
- Fujiyoshi M, Ozaki M. Molecular mechanisms of liver regeneration and protection for treatment of liver dysfunction and diseases. J Hepatobiliary Pancreat Sci. 2011;18(1):13–22.
- Landemore G, Debout C, Quillec M, et al. Isolation of Kurloff cells by Percoll density gradient centrifugation. Protein labeling with 35S-methionine of these cells. Biol Cell. 1984;50(2):121–126.
- Estes MD, Do J, Ahn CH. On chip cell separator using magnetic bead-based enrichment and depletion of various surface markers. Biomed Microdev. 2009;11(2):509–515.
- Mabuchi A, Mullaney I, Sheard P, et al. Role of hepatic stellate cells in the early phase of liver regeneration in rat: formation of tight adhesion to parenchymal cells. Comp Hepatol. 2004;3(1):S29.
- Fausto N, Riehle KJ. Mechanisms of liver regeneration and their clinical implications. J Hepatobiliary Pancreat Surg. 2005;12(3):181–189.
- Taub R. Liver regeneration: from myth to mechanism. Nat Rev Mol Cell Biol. 2004;5(10):836–847.
- Fausto N, Laird AD, Webber EM. Liver regeneration. 2. Role of growth factors and cytokines in hepatic regeneration. FASEB J. 1995;9(15):1527–1536.
- Court FG, Wemyss-Holden SA, Dennison AR, et al. The mystery of liver regeneration. Br J Surg. 2002;89(9):1089–1095.
- Jia C. Advances in the regulation of liver regeneration. Expert Rev Gastroenterol Hepatol. 2011;5(1):105–121.
- Chen X, Zhao Y, Wang F, et al. MicroRNAs in liver regeneration. Cell Physiol Biochem. 2015;37(2):615–628.
- Song G, Sharma AD, Roll GR, et al. MicroRNAs control hepatocyte proliferation during liver regeneration. Hepatology. 2010;51(5):1735–1743.
- Chen X, Murad M, Cui YY, et al. miRNA regulation of liver growth after 50% partial hepatectomy and small size grafts in rats. Transplantation. 2011;91(3):293–299.
- Zhang C, Chang C, Gao H, et al. MiR-429 regulates rat liver regeneration and hepatocyte proliferation by targeting JUN/MYC/BCL2/CCND1 signaling pathway. Cell Signal. 2018;50:80–89.
- Bachmayr-Heyda A, Reiner AT, Auer K, et al. Correlation of circular RNA abundance with proliferation–exemplified with colorectal and ovarian cancer, idiopathic lung fibrosis, and normal human tissues. Sci Rep. 2015;5(1):8057.
- Li L, Guo J, Chen Y, et al. Comprehensive CircRNA expression profile and selection of key CircRNAs during priming phase of rat liver regeneration. BMC Genomics. 2017;18(1):80.
- Salmena L, Poliseno L, Tay Y, et al. A ceRNA hypothesis: the Rosetta Stone of a hidden RNA language? CELL. 2011;146(3):353–358.
- Memczak S, Jens M, Elefsinioti A, et al. Circular RNAs are a large class of animal RNAs with regulatory potency. Nature. 2013;495(7441):333–338.
- Valdmanis PN, Kay MA. The expanding repertoire of circular RNAs. MOL Ther. 2013;21(6):1112–1114.
- Bai H, Guo J, Chang C, et al. Comprehensive analysis of lncRNA-miRNA-mRNA during proliferative phase of rat liver regeneration. J Cell Physiol. 2019;234:18897–18905.
- Guan YJ, Ma JY, Song W. Identification of circRNA-miRNA-mRNA regulatory network in gastric cancer by analysis of microarray data. Cancer Cell Int. 2019;19(1):183.
- Zhou JZ, Hu MR, Diao HL, et al. Comprehensive analysis of differentially expressed circRNAs revealed a ceRNA network in pancreatic ductaladenocarcinoma. Arch Med Sci. 2019;15(4):979–991.
- Zhang Z, Li J, He T, et al. The competitive endogenous RNA regulatory network reveals potential prognostic biomarkers for overall survival in hepatocellular carcinoma. Cancer Sci. 2019;110(9):2905.
- Higgins GA. Experimental pathology of the liver: restoration of the liver of the white rat following partial surgical removal. Arch Pathol. 1931;12:186–202.
- Yusuf NH, Ong WD, Redwan RM, et al. Discovery of precursor and mature microRNAs and their putative gene targets using high-throughput sequencing in pineapple (Ananas comosus var. comosus). Gene. 2015;571(1):71–80.
- Yu H, Cong L, Zhu Z, et al. Identification of differentially expressed microRNA in the stems and leaves during sugar accumulation in sweet sorghum. Gene. 2015;571(2):221–230.
- Wang G, Chen S, Zhao C, et al. Gene expression profiles predict the possible regulatory role of OPN-mediated signaling pathways in rat liver regeneration. Gene. 2016;576(2):782–790.
- Wang WB, Fan JM, Zhang XL, et al. Serial expression analysis of liver regeneration-related genes in rat regenerating liver. Mol Biotechnol. 2009;43(3):221–231.
- Wang GP, Xu CS. Alterations in DNA repair gene expression and their possible regulation in rat-liver regeneration. Genet Mol Biol. 2011;34(2):304–309.
- Geng X, Chang C, Zang X, et al. Integrative proteomic and microRNA analysis of the priming phase during rat liver regeneration. Gene. 2016;575(2):224–232.
- Lin X, Chen Y. Identification of potentially functional circRNA-miRNA-mRNA regulatory network in hepatocellular carcinoma by integrated microarray analysis. Med Sci Monit Basic Res. 2018;24:70–78.
- Hutvagner G, Simard MJ. Argonaute proteins: key players in RNA silencing. Nat Rev Mol Cell Biol. 2008;9(1):22–32.
- Agarwal V, Bell GW, Nam JW, et al. Predicting effective microRNA target sites in mammalian mRNAs. eLIFE. 2015;4:e05005.
- Dweep H, Sticht C, Pandey P, et al. miRWalk–database: prediction of possible miRNA binding sites by “walking” the genes of three genomes. J Biomed Inform. 2011;44(5):839–847.
- Wang L, Wang B, Liu J, et al. Construction and analysis of a spinal cord injury competitive endogenous RNA network based on the expression data of long noncoding, micro and messenger RNAs. Mol Med Rep. 2019;19(4):3021–3034.
- Dong H, Wang N, Huang J. Bioinformatic analysis of differential expression microRNAs of blood in AD patients. J Shihezi Univ. (Natural Science). 2017;35(6):720–725.
- Dweep H, Gretz N. miRWalk2.0: a comprehensive atlas of microRNA-target interactions. Nat Methods. 2015;12(8):697.
- John B, Enright AJ, Aravin A, et al. Human microRNA targets. PLOS Biol. 2004;2(11):e363.
- Hansen TB, Jensen TI, Clausen BH, et al. Natural RNA circles function as efficient microRNA sponges. Nature. 2013;495(7441):384–388.
- Zhang J, Yang Y, He T, et al. Expression profiles uncover the relationship between erythropoietin and cell proliferation in rat hepatocytes after a partial hepatectomy. Cell Mol Biol Lett. 2014;19(3):331–346.
- Sui S, Jia Y, He B, et al. Maternal low-protein diet alters ovarian expression of folliculogenic and steroidogenic genes and their regulatory microRNAs in neonatal piglets. Asian Australas J Anim Sci. 2014;27(12):1695–1704.
- Yang W, Du WW, Li X, et al. Foxo3 activity promoted by non-coding effects of circular RNA and Foxo3 pseudogene in the inhibition of tumor growth and angiogenesis. Oncogene. 2016;35(30):3919–3931.
- Xu K, Chen D, Wang Z, et al. Annotation and functional clustering of circRNA expression in rhesus macaque brain during aging. Cell Discov. 2018;4(1):48.
- Chu Y, Fan W, Guo W, et al. miR-1247-5p functions as a tumor suppressor in human hepatocellular carcinoma by targeting Wnt3. Oncol Rep. 2017;38(1):343–351.
- Scaravilli M, Porkka KP, Brofeldt A, et al. MiR-1247-5p is overexpressed in castration resistant prostate cancer and targets MYCBP2. Prostate. 2015;75(8):798–805.
- Marzinke MA, Clagett-Dame M. The all-trans retinoic acid (atRA)-regulated gene Calmin (Clmn) regulates cell cycle exit and neurite outgrowth in murine neuroblastoma (Neuro2a) cells. Exp Cell Res. 2012;318(1):85–93.
- Andrade JM, Pobre V, Arraiano CM. Small RNA modules confer different stabilities and interact differently with multiple targets. PLoS One. 2013;8(1):e52866.
- Sharma T, Hamilton R, Mandal CC. miR-214: a potential biomarker and therapeutic for different cancers. Future Oncol. 2015;11(2):349–363.
- Shi L, Tian C, Sun L, et al. The lncRNA TUG1/miR-145-5p/FGF10 regulates proliferation and migration in VSMCs of hypertension. Biochem Biophys Res Commun. 2018;501(3):688–695.
- Wu H, Pang P, Liu MD, et al. Upregulated miR-20a-5p expression promotes proliferation and invasion of head and neck squamous cell carcinoma cells by targeting of TNFRSF21. Oncol Rep. 2018;40(2):1138–1146.
- Ding Y, Wu Y, Gao W, et al. Analysis of gene expression profiling variations induced by hsamiR1455poverexpression in laryngeal squamous cell carcinoma cell line Tu177. Mol Med Rep. 2017;16(5):5863–5870.
- Zhang D, Wang C, Li Z, et al. CCNG2 overexpression mediated by AKT inhibits tumor cell proliferation in human astrocytoma cells. Front Neurol. 2018;9:255.
- Qiao P, Li S, Zhang H, et al. Farnesoid X receptor inhibits proliferation of human colorectal cancer cells via the miR135A1/CCNG2 signaling pathway. Oncol Rep. 2018;40(4):2067–2078.
- Pfeffer K. Biological functions of tumor necrosis factor cytokines and their receptors. Cytokine Growth Factor Rev. 2003;14(3–4):185–191.
- Thorburn A. Death receptor-induced cell killing. Cell Signal. 2004;16(2):139–144.
- Wu J, He Y, Luo Y, et al. MiR-145-5p inhibits proliferation and inflammatory responses of RMC through regulating AKT/GSK pathway by targeting CXCL16. J Cell Physiol. 2018;233(4):3648–3659.
- Liu J, Wang X, Yang X, et al. miRNA423-5p regulates cell proliferation and invasion by targeting trefoil factor 1 in gastric cancer cells. Cancer Lett. 2014;347(1):98–104.