
Abstract
Numerous studies have investigated the prognostic significance of ECT2 (epithelial cell transforming sequence 2) expression in patients with cancer. Nevertheless, conflicting results have been obtained. We thus performed a meta-analysis to systematically assess the prognostic significance of ECT2 in cancer. Electronic databases (PubMed and EMBASE) were searched for eligible studies. Hazard ratios (HR) and odds ratios (OR) with 95% confidence intervals (CIs) were used to estimate effect sizes. A total of 5,305 patients from 19 articles and 21 studies were included. The pooled results revealed that high ECT2 expression was correlated with advanced TNM stage (OR = 2.17; 95% CI: 1.42–3.32), positive lymph node metastasis (OR = 2.98; 95% CI: 2.28–3.89), distant metastasis (OR = 2.25; 95% CI: 1.03–4.92), and poor tumour differentiation (OR = 2.25; 95% CI: 1.03–4.92). More importantly, high ECT2 expression was significantly associated with poor overall survival (HR = 2.26; 95% CI, 1.84–2.78) and recurrence-free survival (HR = 1.52; 95% CI, 1.24–1.86). Our results suggested that ECT2 is a promising prognostic indicator and therapeutic target for cancer.
Keywords:
Introduction
Cancer is the second most common cause of death [Citation1]; the American Cancer Society estimated that in 2018 there were nearly 1,735,350 new cancer cases and 609,640 cancer deaths in the United States [Citation1]. In the past few decades, extensive studies have explored the mechanisms underlying the initiation and progression of cancers; numerous candidate biomarkers for cancer progression and prognosis have been identified, but only a few have been applied in clinical practice [Citation2–6]. Worse still, despite the development of targeted therapies based on cancer-related biomarkers and integrated treatments, prognosis for most cancers, especially the 5-year overall survival (OS), remains fairly unsatisfying [Citation2–6]. Therefore, novel and effective predictive biomarkers are still urgently needed.
In 1993, Miki et al. initially identified the proto-oncogene ECT2 (epithelial cell transforming sequence 2) in epithelial cells (located in the human 3q26.31 chromosomal region) and demonstrated its ability to transform NIH/3T3 fibroblasts into malignant cells [Citation7]. In non-transformed cells, ECT2 (approximately 104 kDa) is mainly expressed in the interphase nucleus and undergoes hyper-phosphorylation, and it is distributed in the cytoplasm during mitosis [Citation8–10]. As a guanine nucleotide exchange factor (GEF), ECT2 can catalyse the replacement of inactive GDP by active GTP on Rho family GTPases, thereby activating Rho GTPase-associated signal transduction [Citation9,Citation11]. Of note, the excessive up-regulation of Rho GTPase activity is closely correlated with tumorigenesis and the malignant phenotype of many human cancers due to their roles in the aberrant activation of cancer-associated signalling pathways [Citation12–14]. Accordingly, the aberrant overexpression of ECT2 may have protumorigenic effects. Indeed, growing evidence suggests that ECT2 is frequently overexpressed in various cancers and serves as an oncogene [Citation15–18]. Moreover, numerous clinical studies have shown that high ECT2 expression is associated with adverse clinicopathological characteristics, such as poor tumour differentiation, larger tumour size, positive lymphatic metastasis, and advanced disease stage, and as well as an unfavourable prognosis in multiple type of cancers [Citation11,Citation15,Citation19–25], further suggesting that it is a promising prognostic biomarker in cancers. Nevertheless, these previous studies are limited by sample sizes or study methodologies. Therefore, we performed a meta-analysis to systematically assess the prognostic and clinicopathological significance of ECT2 in cancer by synthetically analysing all ECT2-related published data.
Materials and methods
Search strategy
PubMed and EMBASE were systematically searched for relevant studies published up to May, 2019 using the following terms: “ECT2” or “epithelial cell transforming sequence 2”, and “tumor” or “tumour” or “malignancy” or “malignant” or “neoplasm” or “adenocarcinoma” or “cancer” or “carcinoma”. The search strategy used in PubMed was as follows: ((“tumor” [Title/Abstract] OR “tumour” [Title/Abstract] OR “malignancy” [Title/Abstract] OR “malignant” [Title/Abstract] OR “neoplasm” [Title/Abstract] OR “adenocarcinoma” [Title/Abstract] OR “cancer” [Title/Abstract] OR “carcinoma” [Title/Abstract])) AND ECT2 [Title/Abstract]. The search language was limited to English.
Selection criteria
The inclusion criteria were as follows: (1) ECT2 expression in malignant tissues was detected by immunohistochemistry (IHC) or quantitative real-time polymerase chain reaction (qRT-PCR) and (2) data for the association of ECT2 expression with prognosis or clinicopathological characteristics could be obtained. The exclusion criteria were as follows: (1) duplicate publications, (2) cell or animal experiments, (3) studies lacking clinicopathological or prognostic data, and (4) review articles, letters, or abstracts.
Data extraction and quality assessment
The following data were extracted from all eligible studies by two researchers (Bin Li and Jun-Ping Lin) independently: first author, study type, publication year, type of cancer, sample size, detection method, gender, age, tumour stage, lymphatic metastasis, distant metastasis, tumour cell differentiation, survival data, and analysis type (multivariate or univariate). If both multivariate and univariate analyses were performed, data for the former were included in the meta-analysis to adjust for survival-related confounding factors. Consistent with recently published meta-analyses [Citation26–28], the Newcastle–Ottawa Scale was used to evaluate the quality of all included studies; quality scores ranged from 0 to 9, and a score of ≥6 indicated high quality. Studies with scores of greater than 6 were included in the meta-analysis.
Statistical analysis
Statistical analyses were conducted using Stata SE12.0 (Stata Corp., College Station, TX, USA). The combined odds ratio (OR) and 95% confidence intervals (95% CI) were used to analyse the correlation between ECT2 expression and clinicopathological parameters. The combined hazard ratios (HRs) and 95% CIs were used to analyse the relationships of ECT2 expression with overall survival (OS) and recurrence-free survival (RFS). Heterogeneity among studies was evaluated using the χ2-based Q test and the I2 statistic [Citation29]. p < .05 and I2 > 50% indicated substantial heterogeneity, and a combined analysis was conducted using a random effects model. When no significant heterogeneity was observed (p ≥ .05 and I2 < 50%), a fixed effects model was applied for the combined analysis. A subgroup analysis and meta-regression analysis were performed to investigate the source of heterogeneity. Publication bias was assessed based on funnel plots and Begg’s test [Citation30]. If significant publication bias was observed, the trim and fill method was applied to estimate whether it obviously affected the reliability of the overall results [Citation31]. A sensitivity analysis was performed by omitting one included study at each step to further evaluate the robustness of the combined results. p ≤ .05 indicated statistical significance.
Results
Study characteristics
A total of 19 published articles with 21 studies enrolling 5,305 patients met the inclusion criteria for the meta-analysis [Citation11,Citation15,Citation19–25,Citation32–41]. A flow diagram of the detailed literature selection process is displayed in . The enrolled patients in these studies were from China (13 studies), Japan (5 studies), Singapore (1 study), USA (1 study), and Germany (1 study). All study designs were retrospective. Among these studies, 17 reported the correlation between ECT2 expression and OS and 5 reported the association between ECT2 expression and RFS. ECT2 expression was detected at the protein level by IHC in 13 studies and was detected at the mRNA level in 8 studies by qRT-PCR. Detailed information about the study characteristics and quality is summarised in .
Figure 1. The process of searching for eligible articles.
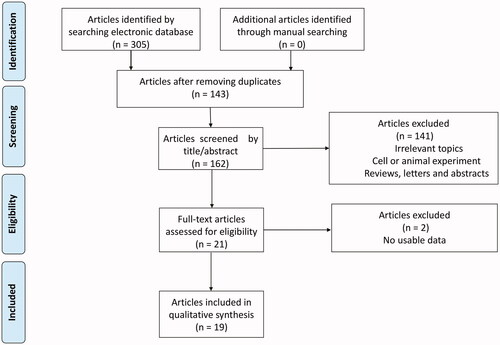
Table 1. The main characteristics of included studies.
Prognostic significance of ECT2 expression
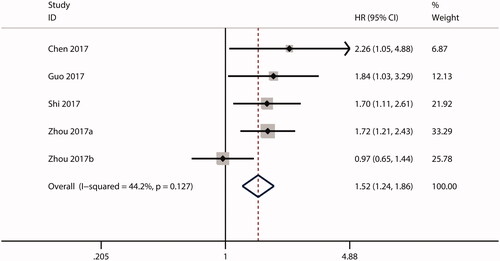
HRs for the association between ECT2 expression and OS were reported in 17 studies. Owing to the significant heterogeneity (I2 = 62.5%; p = .000), a random effects model was used for the combined analysis. As shown in , the combined HR was 2.26 (95.0% CI, 1.84–2.78), suggesting that high ECT2 expression predicts a poor OS in cancer. Additionally, 5 studies investigated the prognostic significance of ECT2 expression in terms of RFS. No substantial heterogeneity was observed (I2 = 44.2%; p = .127), so a fixed effects model was used. As shown in , the combined HR was 1.52 (95.0% CI, 1.24–1.86), implying that there was an inverse relationship between ECT2 expression and RFS.
Figure 2. Forest plot of the combined HR for the relationship between ECT2 expression and OS in cancer patients. CI: confidence interval; HR: hazard ratio; OS: overall survival; ECT2: epithelial cell transforming sequence 2.
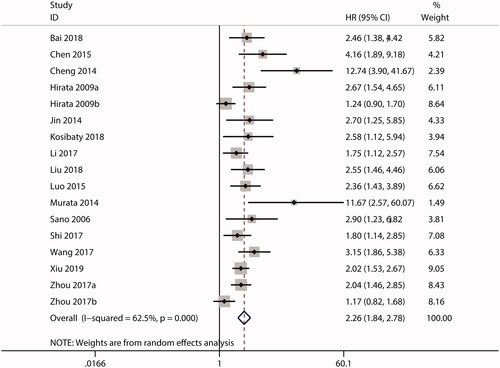
Figure 3. Forest plot of the combined HR for the relationship between ECT2 expression and RFS in cancer patients. CI: confidence interval; HR: hazard ratio; RFS: recurrence-free survival; ECT2: epithelial cell transforming sequence 2.
Clinicopathological significance of ECT2 expression
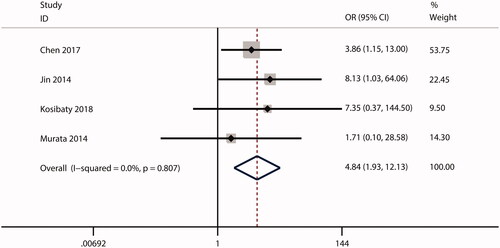
In this meta-analysis, no correlations were observed between ECT2 expression and gender (OR = 1.53; CI: 0.97–2.40; ) or age (OR = 0.99; 95% CI: 0.81–1.20; ). The combined analysis showed that high ECT2 expression was strongly associated with an advanced TNM stage (OR = 2.40; 95% CI: 1.81–3.18; ), positive lymph node metastasis (OR = 2.34; 95% CI: 1.21–4.52; ), poor tumour differentiation (OR = 2.12; 95% CI: 1.25–3.59; ), and distant metastasis (OR = 4.84; 95% CI: 1.93–12.13; ). Overall, these results implied that ECT2 be a key oncogene involved in cancer progression.
Figure 4. Forest plot of the OR for the relationship of ECT2 expression to gender. OR: odds ratio; ECT2: epithelial cell transforming sequence 2.
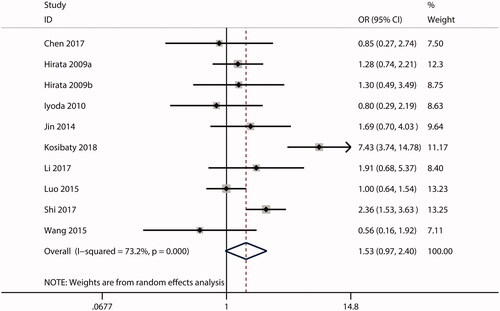
Figure 5. Forest plot of the OR for the relationship of ECT2 expression to age. OR: odds ratio; ECT2: epithelial cell transforming sequence 2.
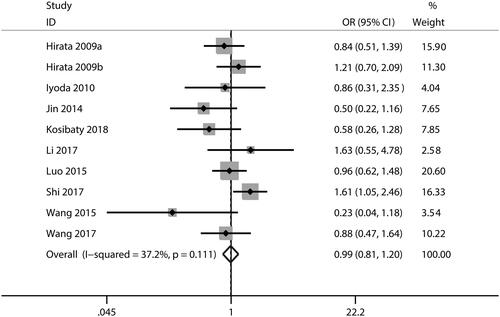
Figure 6. Forest plot of the OR for the relationship of ECT2 expression to TNM stage. OR: odds ratio; ECT2: epithelial cell transforming sequence 2.
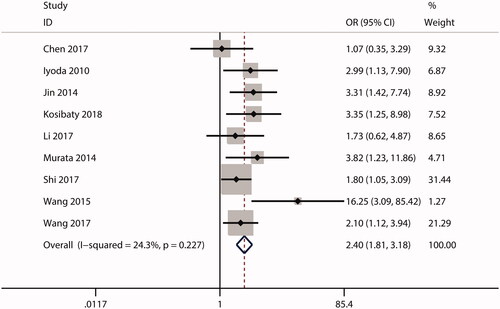
Figure 7. Forest plot of the OR for the relationship of ECT2 expression to lymph node metastasis. OR: odds ratio; ECT2: epithelial cell transforming sequence 2.
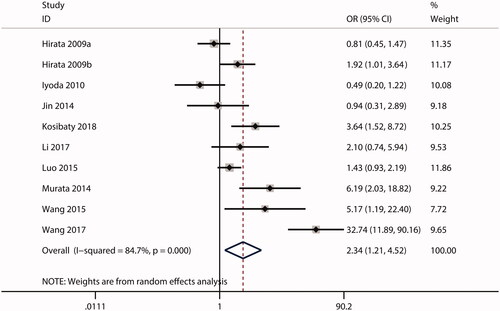
Figure 8. Forest plot of the OR for the relationship of ECT2 expression to tumour differentiation. OR: odds ratio; ECT2: epithelial cell transforming sequence 2.
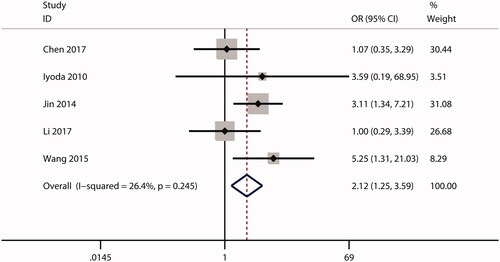
Figure 9. Forest plot of the OR for the relationship of ECT2 expression to distant metastasis. OR: odds ratio; ECT2: epithelial cell transforming sequence 2.
Heterogeneity analysis
To explore the sources of heterogeneity, we first conducted a subgroup analysis and meta-regression according to country, cancer type, sample size, test method, and analysis type. In the subgroup analyses, significant heterogeneity was still detected, suggesting that these factors are not the main sources of heterogeneity (). Consistent with these results, in a meta-regression, none of these factors could explain the significant heterogeneity (). Additionally, we performed a sensitivity analysis by omitting one study at each step to further investigate the sources of heterogeneity. We found that the overall combined HR for OS () and RFS () did not change significantly, indicating that no single study was responsible for the heterogeneity. Owing to the limited studies reporting RFS, a subgroup analysis and meta-regression were not suitable for the combined analysis. Although we failed to identify the source of heterogeneity, these findings demonstrated that our overall combined results were reliable and robust.
Figure 10. Sensitivity analysis test for the combined HR describing the relationship of ECT2 expression to OS (A) and RFS (B). HR: hazard ratio; OS: overall survival; RFS: recurrence-free survival.
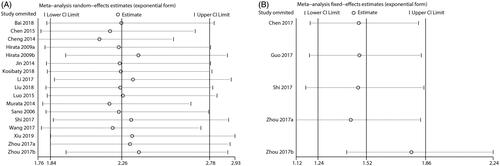
Table 2. Subgroup analysis and meta-regression for HR for the prognostic significance of ETC2 expression.
Publication bias
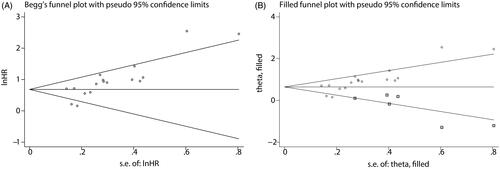
We evaluated publication bias for OS using a funnel plot and Begg’s test. As shown in , Begg’s funnel plot was significantly asymmetrical (p < .001), suggesting that there was significant publication bias. Therefore, we applied the trim and fill method to estimate whether publication bias significantly affected the reliability of the overall combined results for OS. After adjustment, the funnel plot became symmetric (), and the combined HR for OS (HR: 1.906; 95% CI: 1.541–2.357; p = .000) still exceeded 1.0, indicating that our combined result for OS was reliable and robust. Owing to the limited studies of RFS, publication bias prevented the combined analysis of RFS.
Figure 11. Begg’s funnel plot (A) and the adjusted funnel plot (B) for the combined HR describing the relationship of ECT2 expression to OS. CI: confidence interval; HR: hazard ratio; OS: overall survival; ECT2: epithelial cell transforming sequence 2.
Discussion
Numerous studies have shown that high ECT2 (epithelial cell transforming sequence 2) expression is closely associated with cancer prognosis. Nevertheless, conflicting results have been obtained. We thus performed a meta-analysis to systematically assess the prognostic significance of ECT2 in cancer. Our overall pooled analysis showed that high ECT2 expression is closely related to both a poor OS and an unfavourable RFS as well as several adverse clinicopathological features in patients with cancer.
Several factors may account for the prognostic significance of ECT2 in cancers, though they have not been fully elucidated. Salhia et al. [Citation42] and Sano et al. [Citation35] reported that the depletion of ECT2 by siRNA oligonucleotides suppresses the proliferation, migration, and invasion of glioma cells. Zhi et al. [Citation43] found that PTTG1 is highly expressed in glioma and could promote glioma cell proliferation; furthermore, ECT2 upregulates PTTG1 expression via the stabilisation of E2F1, thereby contributing to the in vitro and in vivo proliferation of glioma [Citation18]. Hirata et al. [Citation32] and Tan et al. [Citation44] have shown that ECT2 overexpression could promote in vitro proliferative and invasive abilities as well as the epithelial–mesenchymal transition of lung cancer cells. Additionally, Hirata et al. [Citation32] suggested that ECT2 overexpression could augment the in vitro growth and invasion of oesophageal cancer cells. Rac1 activation has an integral role in cancer progression by promoting the epithelial-to-mesenchymal transition, invasion, metastasis, and proliferation of malignant cells [Citation45–47]. Fortin et al. [Citation48] suggested that the depletion of ECT2 inhibits glioma cell migration and invasion via Rac1 activation. Weeks et al. [Citation49] revealed that ECT2 accelerates the mesenchymal-amoeboid transition in human astrocytoma cells by Rac1 activation. Particularly, Huff et al. [Citation50] uncovered that nuclear ECT2 binds preferentially to Rac1, whereas cytoplasmic ECT2 does not bind to Rac1 in ovarian cancer; furthermore, nuclear ECT2-dependent Rac1 activation enhances the anchorage-independent growth of ovarian cancer cells. Protein kinase Cι (PKCι) has oncogenic potential and is an attractive therapeutic target [Citation51]. Wang et al. [Citation52] suggested that PKCι functions via interactions with ECT2 to activate the MEK/ERK signalling axis, ultimately driving the ovarian tumour-initiating cell (TIC) phenotype and ovarian tumorigenesis. Furthermore, Justilien et al. [Citation53] revealed that PKCι-mediated ECT2 phosphorylation activates rRNA synthesis by binding to the nucleolar transcription factor upstream binding factor 1 (UBF1) on rDNA promoters and by the recruitment of Rac1 and its downstream effector nucleophosmin (NPM) to rDNA, thereby promoting Kras-Trp53 lung tumorigenesis in vivo. In oral cancer, Iyoda et al. [Citation21] found that cell proliferation declines as a result of cell cycle arrest at the G1 phase in ECT2 knockdown oral cancer cells via the up-regulation of p21 and p27 as well as the down-regulation of cyclin D1, cyclin E, and CDK4, suggesting that ECT2 is involved in oral cancer progression. Substantial evidence favours the notion that miRNAs regulate cancer progression, and several studies have suggested that some miRNAs regulates tumour progression by targeting ECT2. For instance, Yu et al. [Citation17] and Fang et al. [Citation54] have shown that MiR-490-5p could repress the metastasis and stemness of hepatocellular carcinoma cells by downregulating ECT2 expression. Xu et al. [Citation55] have reported that the downregulation of ECT2 by miR-223 induces the expression of p21 and p27, which restrain cell cycle progression and proliferation in osteosarcoma cells. Furthermore, according to Chen et al. [Citation19], ECT2 could promote osteosarcoma cell invasion by facilitating the epithelial-mesenchymal transition. In addition to miRNAs, several signalling molecules have been identified as up-stream regulators of ECT2 expression in cancer cells; these promote cancer progression in an ECT2-dependent manner. Chen et al. [Citation56] revealed that p53, an up-stream signalling molecule of ECT2, inhibits the ECT2-induced proliferation, invasion, and epithelial-mesenchymal transition of gastric cancer cells. Mansour et al. [Citation57] demonstrated that the E6-associated protein suppresses breast cancer invasiveness, colonisation, and metastasis in vivo via the inhibition of the ECT2-Rho signalling axis. Overall, these results strongly support the key role of ECT2 in promoting cancer progression and suggest that it is a prognostic biomarker and a therapeutic target for human cancers.
To the best of our knowledge, this is the first meta-analysis to systematically assess the correlations of ECT2 expression with prognosis and clinicopathological features in patients with cancer. However, the results should be interpreted with caution. Most of the included studies were conducted in Asian countries (China and Japan), which restricts the generalisability of the results, to some extent. Second, we did not identify the sources of significant heterogeneity in our subgroup analysis, meta-regression analysis, and sensitivity analysis. Several factors, including the sub-cellular distribution of ECT2, the cut-off value for high ECT2 expression, tumour differentiation or grade, clinical stage, follow-up duration, and age, may account for the heterogeneity. However, relevant data for these factors were not available for subgroup analyses and meta-regression analyses. Third, there was significant publication bias in our meta-analysis, which affected the reliability of our combined results. In the processes of searching and selecting literature, relevant studies could have been excluded owing to a lack of available information and the language restriction, leading to a degree of publication bias. Additionally, publication bias can also be explained by the tendency for studies with positive results to be published, resulting in the overestimation of correlations.
In summary, our results suggested that high ECT2 expression is correlated with a poor prognosis and adverse clinicopathological features in patients with cancer. ECT2 is a promising prognostic indicator and therapeutic target for cancer.
Author contributions
Bin Li designed this study, extracted data, and wrote the original manuscript.
Jun-Ping extracted data.
Zheng Li and Ci Yin performed the statistical analyses.
Jian-Bao Yang and Yu-Qi Meng resolved the conflicting issues about data extraction, and checked the grammar errors in the manuscript.
Acknowledgement
We would like to thank Editage (www.editage.cn) for English language editing.
Disclosure statement
The authors declare that they have no conflict of interest.
Additional information
Funding
Related Research Data
References
- Siegel RL, Miller KD, Jemal A. Cancer statistics, 2018. CA Cancer J Clin. 2018;68(1):7–30.
- Gao N, Yang RN, Meng Z, et al. The prognostic value of C-reactive protein/albumin ratio in nasopharyngeal carcinoma: a meta-analysis. Biosci Rep. 2018;38:BSR20180686.
- Lu R, Chen J, Kong L, et al. Prognostic value of lncRNA ROR expression in various cancers: a meta-analysis. Biosci Rep. 2018;38:BSR20181095.
- Ou Y, Huang J, Yang L. The prognostic significance of pretreatment serum gamma-glutamyltranspeptidase in primary liver cancer: a meta-analysis and systematic review. Biosci Rep. 2018;38(6):BSR20181058.
- Peng Y, Huang D, Ma K, et al. MiR-19a as a prognostic indicator for cancer patients: a meta-analysis. Biosci Rep. 2019;39(5):BSR20182370.
- Wang X, Chen K, Liu H, et al. Prognostic significance of NEK2 in human solid tumors: a systematic review and meta-analysis. Biosci Rep. 2019;39(1):BSR20180618.
- Miki T, Smith CL, Long JE, et al. Oncogene ect2 is related to regulators of small GTP-binding proteins. Nature. 1993;362(6419):462–465.
- Niiya F, Tatsumoto T, Lee KS, et al. Phosphorylation of the cytokinesis regulator ECT2 at G2/M phase stimulates association of the mitotic kinase Plk1 and accumulation of GTP-bound RhoA. Oncogene. 2006;25(6):827–837.
- Tatsumoto T, Xie X, Blumenthal R, et al. Human ECT2 is an exchange factor for Rho GTPases, phosphorylated in G2/M phases, and involved in cytokinesis. J Cell Biol. 1999;147(5):921–928.
- Baker MJ, Cooke M, Kazanietz MG. Nuclear PKCiota-ECT2-Rac1 and ribosome biogenesis: a novel axis in lung tumorigenesis. Cancer Cell. 2017;31(2):167–169.
- Luo Y, Qin SL, Mu YF, et al. Elevated expression of ECT2 predicts unfavorable prognosis in patients with colorectal cancer. Biomed Pharmacother. 2015;73:135–139.
- Kim JG, Kim MJ, Choi WJ, et al. Wnt3A induces GSK-3beta phosphorylation and beta-catenin accumulation through RhoA/ROCK. J Cell Physiol. 2017;232(5):1104–1113.
- Zhang Z, Ma Z, Zou W, et al. N-myc downstream-regulated gene 2 controls astrocyte morphology via Rho-GTPase signaling. J Cell Physiol. 2019;234(11):20847–20858.
- Bustelo XR. RHO GTPases in cancer: known facts, open questions, and therapeutic challenges. Biochem Soc Trans. 2018;46(3):741–760.
- Bai X, Yi M, Xia X, et al. Progression and prognostic value of ECT2 in non-small-cell lung cancer and its correlation with PCNA. Cancer Manag Res. 2018;10:4039–4050.
- Daulat AM, Finetti P, Revinski D, et al. ECT2 associated to PRICKLE1 are poor-prognosis markers in triple-negative breast cancer. Br J Cancer. 2019;120(9):931–940.
- Yu Y, Cai O, Wu P, et al. MiR-490-5p inhibits the stemness of hepatocellular carcinoma cells by targeting ECT2. J Cell Biochem. 2019;120(1):967–976.
- Zhi T, Jiang K, Xu X, et al. ECT2/PSMD14/PTTG1 axis promotes the proliferation of glioma through stabilizing E2F1. Neuro Oncol. 2019;21(4):462–473.
- Chen Z, Liu J, Zhang Y. Role of epithelial cell transforming sequence 2 (ECT2) in predicting prognosis of osteosarcoma. Med Sci Monit. 2017;23:3861–3868.
- Cheng YS, Lin C, Cheng YP, et al. Epithelial cell transformation sequence 2 is a potential biomarker of unfavorable survival in human gliomas. Neurol India. 2014;62:406–409.
- Iyoda M, Kasamatsu A, Ishigami T, et al. Epithelial cell transforming sequence 2 in human oral cancer. PLoS One. 2010;5(11):e14082.
- Jin Y, Yu Y, Shao Q, et al. Up-regulation of ECT2 is associated with poor prognosis in gastric cancer patients. Int J Clin Exp Pathol. 2014;7(12):8724–8731.
- Liu B, Yang H, Taher L, et al. Identification of prognostic biomarkers by combined mRNA and miRNA expression microarray analysis in pancreatic cancer. Transl Oncol. 2018;11(3):700–714.
- Wang HK, Liang JF, Zheng HX, et al. Expression and prognostic significance of ECT2 in invasive breast cancer. J Clin Pathol. 2018;71(5):442–445.
- Zhou S, Wang P, Su X, et al. High ECT2 expression is an independent prognostic factor for poor overall survival and recurrence-free survival in non-small cell lung adenocarcinoma. PLoS One. 2017;12(10):e0187356.
- Yang W, Wan H, Shan R, et al. The clinical significance and prognostic value of Xenopus kinesin-like protein 2 expressions in human tumors: a systematic review and meta-analysis. J Cell Physiol. 2019 Feb 18. Doi: 10.1002/jcp.28343. [Epub ahead of print].
- Mohammadi M, Mianabadi F, Mehrad-Majd H. Circulating visfatin levels and cancers risk: a systematic review and meta-analysis. J Cell Physiol. 2019;234(4):5011–5022.
- Xie Y, Xu P, Liu K, et al. Hyperuricemia and gout are associated with cancer incidence and mortality: a meta-analysis based on cohort studies. J Cell Physiol. 2019;234(8):14364–14376.
- Higgins JP, Thompson SG, Deeks JJ, et al. Measuring inconsistency in meta-analyses. BMJ. 2003;327(7414):557–560.
- Begg CB, Mazumdar M. Operating characteristics of a rank correlation test for publication bias. Biometrics. 1994;50(4):1088–1101.
- Zhang Y, Liu W, Xu J. Prognostic utility and clinical significance of lysyl oxidase-like 2 protein expression in digestive system cancers. J Cell Physiol. 2019;234(11):20713–20720.
- Hirata D, Yamabuki T, Miki D, et al. Involvement of epithelial cell transforming sequence-2 oncoantigen in lung and esophageal cancer progression. Clin Cancer Res. 2009;15(1):256–266.
- Kosibaty Z, Murata Y, Minami Y, et al. Cytoplasmic expression of epithelial cell transforming sequence 2 in lung adenocarcinoma and its implications for malignant progression. Lab Invest. 2019;99(4):551–567.
- Murata Y, Minami Y, Iwakawa R, et al. ECT2 amplification and overexpression as a new prognostic biomarker for early-stage lung adenocarcinoma. Cancer Sci. 2014;105(4):490–497.
- Sano M, Genkai N, Yajima N, et al. Expression level of ECT2 proto-oncogene correlates with prognosis in glioma patients. Oncol Rep. 2006;16:1093–1098.
- Shi YX, Yin JY, Shen Y, et al. Genome-scale analysis identifies NEK2, DLGAP5 and ECT2 as promising diagnostic and prognostic biomarkers in human lung cancer. Sci Rep. 2017;7(1):8072.
- Chen J, Xia H, Zhang X, et al. ECT2 regulates the Rho/ERK signalling axis to promote early recurrence in human hepatocellular carcinoma. J Hepatol. 2015;62(6):1287–1295.
- Guo Z, Chen X, Du T, et al. Elevated levels of epithelial cell transforming sequence 2 predicts poor prognosis for prostate cancer. Med Oncol. 2017;34(1):13.
- Wang HB, Yan HC, Liu Y. Clinical significance of ECT2 expression in tissue and serum of gastric cancer patients. Clin Transl Oncol. 2016;18(7):735–742.
- Xiu Y, Liu W, Wang T, et al. Overexpression of ECT2 is a strong poor prognostic factor in ER+ breast cancer. Mol Clin Onc. 2019;10:497–505.
- Li Y, Cai X, Chen B, et al. Overexpression of epithelial cell transforming 2 protein in colorectal carcinoma predicts a poor prognosis. Exp Ther Med. 2017;14:4862–4868.
- Salhia B, Tran NL, Chan A, et al. The guanine nucleotide exchange factors trio, Ect2, and Vav3 mediate the invasive behavior of glioblastoma. Am J Pathol. 2008;173(6):1828–1838.
- Zhi T, Jiang K, Xu X, et al. MicroRNA-520d-5p inhibits human glioma cell proliferation and induces cell cycle arrest by directly targeting PTTG1. Am J Transl Res. 2017;9(11):4872–4887.
- Tan H, Wang X, Yang X, et al. Oncogenic role of epithelial cell transforming sequence 2 in lung adenocarcinoma cells. Exp Ther Med. 2016;12(4):2088–2094.
- Caggia S, Chunduri H, Millena AC, et al. Novel role of Gialpha2 in cell migration: downstream of PI3-kinase-AKT and Rac1 in prostate cancer cells. J Cell Physiol. 2019;234(1):802–815.
- Zanca C, Cozzolino F, Quintavalle C, et al. PED interacts with Rac1 and regulates cell migration/invasion processes in human non-small cell lung cancer cells. J Cell Physiol. 2010;225(1):63–72.
- Lou S, Wang P, Yang J, et al. Prognostic and clinicopathological value of Rac1 in cancer survival: evidence from a meta-analysis. J Cancer. 2018;9(14):2571–2579.
- Fortin SP, Ennis MJ, Schumacher CA, et al. Cdc42 and the guanine nucleotide exchange factors Ect2 and trio mediate Fn14-induced migration and invasion of glioblastoma cells. Mol Cancer Res. 2012;10(7):958–968.
- Weeks A, Okolowsky N, Golbourn B, et al. ECT2 and RASAL2 mediate mesenchymal-amoeboid transition in human astrocytoma cells. Am J Pathol. 2012;181(2):662–674.
- Huff LP, Decristo MJ, Trembath D, et al. The role of Ect2 nuclear RhoGEF activity in ovarian cancer cell transformation. Genes Cancer. 2013;4(11–12):460–475.
- Murray NR, Kalari KR, Fields AP. Protein kinase Ciota expression and oncogenic signaling mechanisms in cancer. J Cell Physiol. 2011;226(4):879–887.
- Wang Y, Hill KS, Fields AP. PKCiota maintains a tumor-initiating cell phenotype that is required for ovarian tumorigenesis. Mol Cancer Res. 2013;11(12):1624–1635.
- Justilien V, Ali SA, Jamieson L, et al. Fields, Ect2-dependent rRNA synthesis is required for KRAS-TRP53-driven lung adenocarcinoma. Cancer Cell. 2017;31(2):256–269.
- Fang ZQ, Li MC, Zhang YQ, et al. MiR-490-5p inhibits the metastasis of hepatocellular carcinoma by down-regulating E2F2 and ECT2. J Cell Biochem. 2018;119(10):8317–8324.
- Xu J, Yao Q, Hou Y, et al. MiR-223/Ect2/p21 signaling regulates osteosarcoma cell cycle progression and proliferation. Biomed Pharmacother. 2013;67(5):381–386.
- Chen Y, Tian P, Liu Y. P53 and protein phosphorylation regulate the oncogenic role of epithelial cell transforming 2 (ECT2). Med Sci Monit. 2017;23:3154–3160.
- Mansour M, Haupt S, Chan AL, et al. The E3-ligase E6AP represses breast cancer metastasis via regulation of ECT2-rho signaling. Cancer Res. 2016;76(14):4236–4248.