
 ?Mathematical formulae have been encoded as MathML and are displayed in this HTML version using MathJax in order to improve their display. Uncheck the box to turn MathJax off. This feature requires Javascript. Click on a formula to zoom.
Abstract
Bee propolis has been used in alternative medicine to treat various diseases. Due to its limited water solubility, it is often used in combination with alcohol solvents, causing skin irritation and immune response. To solve this, the new drug delivery system, based on the lipid nanodiscs of 1,2-dimyristoyl-sn-glycero-3-phosphochline (DMPC) and poly(styrene-alt-maleic acid) (PSMA), were created in an aqueous media. At the excess polymer concentrations, the PSMA/DMPC complexation produced the very fine nanoparticles (18 nm). With the increased molar ratio of styrene to maleic acid (St/MA) in the copolymer structure, the lipid nanodisc showed the improved encapsulation efficiency (EE%), comparing to their corresponding aqueous formulations. The maximum value had reached to around 20% when using the 2:1 PSMA precursor. Based on the cytotoxicity test, these nanoparticles were considered to be non-toxic over the low dose administration region (<78 µg/mL). Instead, they possessed the ability to promote the Vero cell growth. The new PSMA/DMPC nanovesicles could thus be used to improve aqueous solubility and therapeutic effects of poorly water-soluble drugs, thus extending their use in modern therapies.
Key messages
New biomimetic approach for propolis encapsulation was developed with no use of organic solvent.
Propolis antioxidants were recovered directly into water-soluble formats.
The very fine lipid nanodiscs showed impressive shelf-life stability and tuneable drug-loading capacity.
Introduction
Propolis or bee glue is a brown resinous extracted from honeycomb found in nature. Bees produce propolis as a mean to repair leaks, as well as to prevent spreading of pathogens in the honeycomb [Citation1]. Due to its versatile biological properties, such as antibacterial, anti-inflammatory, antifungal, hepatoprotective, immunomodulator and anti-tumour activities, it has long been used as a traditional medicine since 300 BC [Citation2–5]. More than 300 different compounds were identified as the propolis chemical constituents. Among them, phenolic esters and flavonoids (eg chrysin, apigenin, galangin, pinocembrin, kaempferol etc.) were reported as the main active compounds [Citation6,Citation7]. Common structure of flavonoid compounds is based on the 15-carbon skeleton, consisting of at least two benzene rings interconnected with a heterocyclic ring structure. Due to this complicated structure, most of them showed the limited water solubility. Their octanol/water partition coefficient (LogP) values were reported to be around 2–4 [Citation8]. Water extraction of propolis generally gives little or no flavonoid content. As previously reported, the Lithuania propolis extracts, derived from the water extraction were mostly comprised of phenolic acids (40–42%), including p-coumaric acid (165 µg/mL) and aldehyde vanillin (157 µg/mL) [Citation9]. These compounds possessed relatively weak antioxidant activity against the intracellular reactive oxygen species (ROS). As such, extraction of propolis flavonoids is normally carried out in the weak polar extracting solvents, including methanol, acetone, ethanol, ethyl acetate, etc. Since most of organic solvents are irritating and/or toxic carcinogenic substances, the remained solvent impurities entrapped within the final products may cause various undesirable effects, such as the initial immunological response, skin inflammation, or degeneration of nervous and respiratory systems. In ocular therapeutics and allergic skin treatment, this could become a serious issue. Thus, there is a need for alternative extraction methods with low toxicity, high recovery yield and reproducibility.
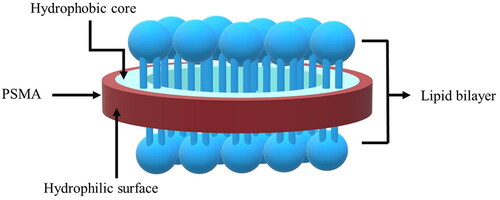
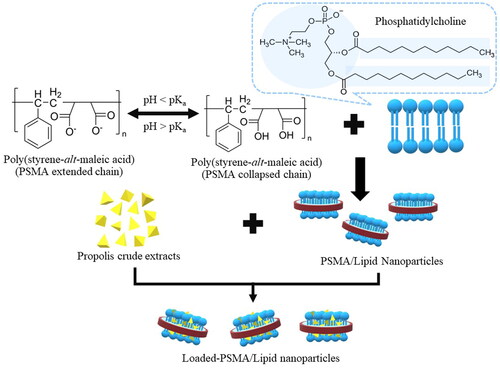
Nanoencapsulation has recently emerged as a promising solution. The process is relied on the enclosure of active compounds within the inner core structures of nanoparticles of less than 300 nm size diameter [Citation10]. The formation of such nano-scaled assemblies would allow the encapsulated drugs (or bioactive compounds) to be interspersed throughout an aqueous media, thus improving their solubility limit. Due to the increased surface area to volume ratio, nanoencapsulation are known to promote skin permeability, wound healing process, and the enhanced anti-inflammatory action. A controlled release of some natural antioxidants was also demonstrated through the using of some membrane-like nanostructures [Citation11]. Our previous works reported the successful synthesis of the nano-assemblies, based on poly(styrene-alt-maleic acid) (PSMA) and a series of synthetic phosphatidylcholine (PC) lipids, such as 1,2-dilauroyl-sn-glycero-phosphatidylcholine (DLPC) and 1,2-dimyristoyl-sn-glycero-phosphatidylcholine (DMPC) [Citation12]. PSMA is generally obtained by alkaline hydrolysis of poly(styrene-alt-maleic anhydride) or PSMAnh, as showed in . The PSMAnh precursor is normally derived by radical copolymerization of styrene (St) and maleic anhydride (MAnh) using equimolar St/MAnh ratio [Citation13–15]. At the pH above the acid dissociation constant value (pH > pKa) of PSMA, the predominant negatively charged repulsion of the two carboxylic acid functional groups in PSMA structure enables the polymer to adapt into an extended chain conformation. At pH < pKa, the protonation of the carboxylic acid groups results in the loss of the electrostatic charge repulsion. The hydrophobic associative forces among the phenyl rings thus prevail the repulsive forces, leading the molecules of PSMA to collapse and adopt themselves into an α-helix coil conformation with excellent surface affinity [Citation16–18]. In the presence of the film-forming lipids, the copolymer can bind, adsorb or even flip into a lipid membrane bilayer. When the PSMA hydrophobicity is sufficiently high, the PSMA/lipid interactions would result in the lipid membrane solubilization and reorganization into the new hybrid nanostructures, as presented in . These particles are a disc-like patches of the phospholipid bilayers enclosed by the amphipathic PSMA chains [Citation19]. Here, the polymer molecules would arrange themselves in such a way that their hydrophilic carboxyl side groups are localized at the outer liquid interface (red domain in ), while those of the phenyl pendant groups are buried within the central lipoid zone (blue domain) of the nanostructures.
Figure 1. Alkaline hydrolysis of poly(styrene-alt-maleic anhydride) to obtain PSMA.
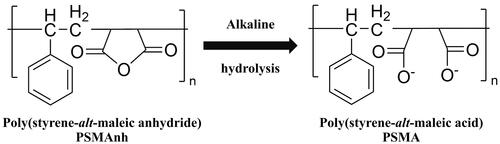
Figure 2. Schematic representation of a mixed PSMA/lipid nanostructure (Paint 3D:6.2003.4017, Microsoft Corporation, 2016).
Dermal delivery of these nanodiscs has some advantages. In similar to liposomal system, they are made of phospholipids with great affinity to interact with the lipid layers of both stratum corneum and intercellular spaces, thus improving the local drug concentrations through the skin [Citation20,Citation21]. Complexation between PSMA and phospholipid spontaneously form the membrane-mimicking assemblies of around 10–50 nm in diameter. The hydrophobic core region of the nanostructures is oily in nature, enabling them to serves as an embedded reservoir to encapsulate poorly-water soluble compounds directly into water-soluble formats [Citation22]. Unlike the native cyclodextrins, loading of the therapeutic compounds can be occurred in an aqueous media without any organic solvent. It is thus considered as an environmentally friendly and greener protocol. These phospholipid-containing nanodiscs can also serve as a reservoir to slowly release phospholipids, a skin-identical ingredient known to promote moisturizing and restorative actions [Citation23]. Due to the very fine size diameters and structural flexibility (<50 nm), they were believed to easily fit into the intercellular spaces and undertake a lengthy channel-like route, thus promoting delivery of active compounds into deeper skin layers. Our pilot study demonstrated the successful encapsulation of the dye model compounds of different hydrophobicity, ranging from oil red O (LogP = 9.8) to fluorescein (LogP = −0.67) [Citation24]. At that time, analysis of the loaded nanovesicles was quite limited due to the use of conventional analytical techniques. Since then, there has been no further study on this matter.
The key challenge for a formation of PSMA/lipid nanostructures is relied on the optimal hydrophobicity/hydrophilicity balance in a PSMA structure to facilitate an initially binding onto the outer hydrophilic surface of the PC bilayers, and then a gradual penetration of the molecules into the inner hydrophobic region of the membrane [Citation12,Citation16,Citation25]. This can be achieved by the increasing of the PSMA hydrophobicity via the changes in the polymer chain length, degree of substitution [Citation16] and the molar ratio of styrene and maleic acid (St/MA). When these parameters were optimized, the complete lipid membrane solubilization to form the most stable PSMA/PC nanoparticles with improved shelf-life stability and loading efficiency would be obtained for pharmaceutical drug delivery applications. This study aimed to investigate the effects of the PSMA structure on its lipid complexation to produce the nano-scaled hybrid assemblies. The PSMA precursors of similar averaged-molecular weights, but different molar St/MA ratios (1:1 and 2:1) were employed to form the hybrid nanostructures. The two PC lipids (DLPC and DMPC) were selected based on their low phase transition temperature (Tm < 25 °C), which allow them to complex with PSMA molecules at room temperature. The samples of different PSMA/PC mass percentages were prepared in an aqueous media, and characterized in terms of their stability profile, particle sizes, as well as the surface morphology. The drug encapsulation potency was also demonstrated on the Thai propolis crude extracts, derived from Trigona terminata Smith stingless bees, and the extreme hydrophobic model compound, oil red O dye.
Materials and methods
Materials
Poly(styrene-alt-maleic anhydride) or PSMAnh, was obtained from the Cray Valley (USA). The two commercially available copolymer products were; SMA®1000P (Mn 2000 and Mw 5500, denoted as 1000 P) and SMA®2000P (Mn 3000 and Mw 7500, denoted as 2000 P). 1,2-Dilauroyl-sn-glycero-phosphatidylcholine (DLPC) and 1,2-Dimyristoyl-sn-glycero-3-phosphochline (DMPC) were purchased from Avanti Polar Lipids and Sigma-Aldrich, respectively. Aqueous solutions of sodium hydroxide (NaOH; 1 M and density 1.05 g/cm3) and hydrochloric acid (HCl; 1 M and density 1.02 g/cm3) were received from QRëC™. Ethanol (99.99%) was purchased from J.T. Baker®. (+)-Catechin hydrate and 2,2-diphenyl-1-picrylhydrazyl (DPPH) were purchased from Sigma-Aldrich and used without purification.
Red propolis was collected from the T. terminata Smith bee hives in Doi Saket, Chiang Mai Province, Thailand (18.870278, 99.136667). The specimens of propolis were stored immediately in an ice box at 4 °C for two weeks, ground to a fine powder, and then stored in a freezer (−10 °C) prior to using.
Methods
Hydrolysis of PSMAnh
Under a constant stirring condition (300 rpm), 1 g PSMAnh (either 1000 P or 2000 P) was suspended in a 100 mL of distilled water, before the pH adjustment to pH 12 by using 1 M NaOH. After the optically clear mixture was obtained, the solution was neutralized (pH 6.8–7.2) by the addition of 1 M HCl, filtered-off, dialysed against deionized water, and freeze-dried to obtain the white PSMA powder. The powder was finally stored in the desiccator, prior to using.
Potentiometric titration of PSMA
The pH solution of a 10 mL of an aqueous solution of PSMA (0.35% w/v) was adjusted to pH 3 by the addition of HCl solution. With a continuously stirring, the solution was titred with 0.1 M NaOH solution using phenolphthalein as an indicator. For each of a NaOH addition (0.04 mL), the pH solution was recorded at a 1-min interval. A titration was carried out until the pH solution had reached to pH 12. The pKa (acid dissociation constant) of PSMA sample was determined based on the titration curve plotted between the change in the pH values and their corresponding NaOH volumes.
Purification of bee propolis
Approximately 5 g of red propolis (T. terminata Smith) was extracted in a 50 mL of ethanol. The suspension was stirred at room temperature for 24 h, before centrifugation at 3000 rpm (25 °C). The supernatant was collected and the solid residue was re-dissolved in a 50 mL of ethanol once again. The extraction process was repeated three times and the whole supernatant was mixed, filtered and evaporated to dryness at 40 °C under the reduced pressure (680 mmHg) by using the rotary evaporator. The viscous crude extracts were finally freeze-dried (1.05 × 10⁻⁵ MPa, 24 h) to obtain the powder format. The percentages of the extraction yield were calculated by using the following mathematical equation;
(1)
(1)
Determination of total flavonoid content
The aluminium chloride (AlCl3) method for the routine estimation of the total flavonoid content was modified from the previous work [Citation26]. The results were expressed as the catechin equivalent (CE) per gram of sample (mg CE/g). Briefly, the stock solution of catechin (0.1 mg) was prepared in a binary ethanol/water solvent (83:17 by volume), obtaining the final concentration of 500 μg/mL. A series of the standard catechin solutions at the final concentrations between 3 and 50 μg/mL, was prepared from the stock solution. For the propolis extracts, the freeze-dried sample was dissolved in a binary solvent to obtain a final concentration of 4167 μg/mL. Then, a 500 μL of either propolis or catechin solution was mixed with a 200 μL of aluminium chloride (AlCl3) solution (0.55 M), 100 μL of sodium nitrite (3 M), 500 μL of NaOH (2.5 M) and 1000 μL of distilled water. The reaction mixture was incubated in darkness and at room temperature for 40 min. The UV-absorbance was spectrophotometrically measured at 510 nm. The total flavonoid content was obtained by comparing with the catechin equivalent (CE) calibration curve.
Evaluation of antioxidant activity
The antioxidant capacity of the crude extracts (IC50) was estimated based on the 2-diphenyl-1-picrylhydrazyl (DPPH) assay [Citation27,Citation28]. The two standard radical scavenging agents were ascorbic acid and butylated hydroxytoluene (BHT). The stock solutions of ascorbic acid (20 μg/mL) and BHT (80 μg/mL) were initially prepared and further diluted to give the final concentrations between 0.1 and 2.0 μg/mL and 1.6 and 32.0 μg/mL, respectively. Diluted solutions of the crude extracts (200–1500 μg/mL) were obtained by diluting of the stock solution (4884 μg/mL) with a binary ethanol/water solvent (86:14 by volume). A 150 μL of each solution was transferred into the 96 well-plate and then mixed with a 100 μL of DPPH solution (0.1 mM). The solution mixture was incubated in darkness and at room temperature for 20 min. Finally, the UV-absorbance of the solution was measured at the maximum wavelength of 520 nm. The percentage of inhibition (% inhibition) was calculated by using Equationequation (2)(2)
(2) , given below. The antioxidant activity (IC50) of the crude extracts was expressed in terms of the flavonoid content (μg CE/mL).
(2)
(2)
Preparation and characterization of PSMA/PC nanoparticles
An aqueous mixture of PSMA and the lipid (PC) was prepared at the weight percentages of 90:10, 80:20, 65:35 and 50:50 (PSMA/PC). The pH solution was adjusted to the pKa value of each PSMA type by the addition of either HCl or NaOH solution. The mixture was continuously stirred (900 rpm) at room temperature for 48 h, before the pH neutralization. The mixture solution was filtered through a syringe membrane (0.45 micron), and freeze-dried (1.05 × 10⁻⁵ MPa, 25 °C, 24 h) into a powder format. To evaluate the long-term stability profile, a 250 μL of the freshly-prepared aqueous mixture was measured at the maximum wavelength of 600 nm by using the UV-Vis spectrophotometer. The plot of the change in the UV-absorbance values as a function of time was constructed based on the triplicate analysis of the samples.
To observe the surface morphology of the hybrid particles, the scanning electron microscopy (SEM) was employed by using the accelerating voltages of 3 kV and the working distance of 10 mm. Prior to the measurement, the freshly prepared aqueous formulation was dropped onto the carbon tape attached onto the SEM stub. The sample was dried in a desiccator maintained at room temperature for 24 h and then, gold sputter-coated. Beside the SEM analysis, dynamic light scattering (DLS) technique was used to study the short-term stability profile of the hybrid particles, as well as to obtain the particle sizes (Z-average) and their distribution (PDI). For this, a freshly-prepared sample (1% w/v) was transferred to the quartz cuvette cell prior to the measurement at a predetermined period of time. A laser wavelength of 632.8 nm (He-Ne), a scattering angle of 173°, a medium refractive index of 1.330 and a material refractive index of 1.59 were employed. Data analysis was carried out by using a Zetasizer Nano ZSP (Malvern Instruments). All measurements were performed at 25 °C using deionized water as a media.
Encapsulation of PSMA/PC nanoparticles
The method was almost similar to that of a preparation of PSMA/PC nanoparticles, except that the freeze-dried powder of the propolis extracts (or, oil red O dye) was mixed with an aqueous PSMA/PC suspension, prior to the pH adjustment to the pKa value. A schematic illustration for the preparation of the loaded PSMA/PC nanoparticles is presented in . The mass ratio of the lipid to the active compound was fixed at 1:1. After 48 h of agitation (900 rpm), the mixture was neutralized, filtered through a syringe membrane (0.45 micron) and freeze-dried (1.05 × 10⁻⁵ MPa, 25 °C, 24 h) into powder.
Figure 3. Schematic diagram for the preparation of propolis-loaded PSMA/PC nanoparticles (Paint 3D:6.2003.4017, Microsoft Corporation, 2016).
To examine the encapsulation efficiency (% EE), the freeze-dried sample was re-dissolved in a 4 mL of absolute ethanol, sonicated at 50 Hz for 20 min and then continuously stirred for another 24 h. The supernatant was filtered-off through the membrane syringe filters (0.45 micron), before a spectrophotometrically measurement at the wavelength of 289 nm (propolis) or 518 nm (oil red O). The % EE of the hybrid vesicles was quantified by using Equationequation (3)(3)
(3) .
(3)
(3)
The terms Ci and Cf were the concentrations (μg/mL) of the encapsulated compounds in the initial feed composition and in the re-dissolved ethanolic solution, respectively. To approximate the term Cf, different ethanolic propolis solutions was prepared (0.2–0.8% w/v), and their UV-absorbance was measured. A calibration graph plotting between the concentrations of the active compounds and their corresponding absorbance values was constructed, and used for the subsequent determination of % EE.
Evaluation of cytotoxicity profile
The Vero cell line was obtained from ATTCC (CCL-81) through the Science and Technology Service Centre (Chiang Mai University).) It was cultured in Dulbeccon’s Modified Eagle Medium (DMEM), containing 10% foetal bovine serum (FBS), penicillin (100 Units/mL), and streptomysin (100 µg/mL). The culture plate was incubated in an incubator for 48 h (5% CO2, 37 °C). After the addition of 0.05% trypsin-EDTA, the cells were collected, and centrifuged for 5 min (1200 rpm, 4 °C). The cell pellets were redissolved in 1 mL DMEM medium, and the cell counting was performed by using a haemacytometer. A 100 µL of cells (1 × 10⁵ cells/mL) was transferred into a 96-well culture plate before incubation (37 °C, 5% CO2). After 24 h, the cell medium was removed and a 100 µL of the sample was added. Each sample was diluted with the FBS-free DMEM medium to obtain a series concentration of 78–1250 µg/mL (1000 P/DMPC), or 39–313 µg/mL (2000 P/DMPC). The culture plate was incubated overnight, and then the test medium was replaced by a 30 µL of 2 mg/mL methyl thiazolyl tetrazolium (MTT) solution. After 3 h, the formazan crystal was dissolved with 100% dimethyl sulfoxide (DMSO), and the measurement was made at 570 nm by using a microplate reader. Calculation of the cell viability (%) was performed in triplicates. The results were compared with those of the control (untreated) cells, and the positive control (2% Triton-X).
Results
Characterization of propolis extracts
Ethanolic extraction of the de-waxed T. terminata propolis results in the recovery yield of around 41.80 ± 8.42%, higher than that of Trigona thoracica species from Malaysia (9–12%) [Citation29]. These crude extracts showed a characteristic yellow colour with the maximum UV-absorption peak at 289 nm, corresponding to the basic chromophore of flavonoid types (data not showed). To quantify the flavonoid content in the propolis extracts, the AlCl3 colorimetric method was employed. For this, the standard calibration curve between the catechin concentrations and their corresponding UV-absorbance values was initially constructed. By using this plot (R2 = 0.9990), the total flavonoid content in the propolis extracts was approximated to be around 90 mg CE/g. In order to measure the free-radical scavenging antioxidant in the sample, the DPPH assay was employed. The method is relied on the reduction of DPPH radicals by the antioxidant agents and then form the unreactive DPPH-H species. The half-inhibitory concentration (IC50) value is normally referred to as the concentration of an antioxidant, at which the 50% of its radical inhibitory effects has been observed. The value is normally obtained from the plot of the DPPH inhibitory activity (%) as a function of the serial dilutions, which should display a reasonable linear correlation. Ascorbic acid (R2=0.9963) and BHT (R2=0.9993) standards display the IC50 values of around 0.96 µg/mL and 7.27 µg/mL, respectively. For the ethanolic extracts (R2=0.9986), the value is approximately 89.91 µg/mL, higher than those of the two standards.
Nanoparticle formation
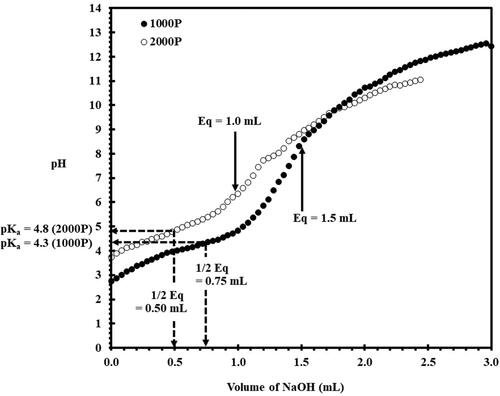
Prior to the PSMA/lipid complexation, a critical pKa value for each PSMA type must be examined. For this, the potentiometric titration curves were constructed for both 1000 P and 2000 P types, as presented in . The half-equivalent point volume was extrapolated to obtain the value of pKa, reflecting the acid content or the acid strength of the material [Citation25]. As noticed in , the 2000 P sample shows the corresponding pKa value of around 4.8, while that of the 1000 P sample is around 4.3. Led by these results, the lipid complexation with 1000 P and 2000 P was performed at pH 4.3 and pH 4.8, respectively.
Figure 4. Potentiometric titration curves of PSMA samples; 1000 P (●) and 2000 P (○).
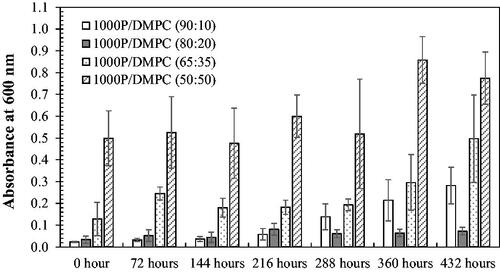
The light scattering (or turbidity) caused by particles is generally related to the particle size. The greater turbidity the formulation display (or the increased light absorption), the larger particle sizes the system would contain. This concept can be applied for the investigation of the particle aggregation during the shelf-life storage. As noticed, the samples at the mass ratios of 90:10 and 80:20 (PSMA/PC), based on DLPC () or DMPC (), exhibit an excellent optical transparency with the least UV light absorption (Abs < 0.05), implying the formation of the most stable nano-scaled mixed assemblies that do not scatter the light source. After 432 h, these formulations show the negligible change in their Abs values. Other formulations show a noticeable increasing in the Abs value, suggesting the presence of particle aggregation.
Figure 5. The shelf-life stability for different 1000 P/DLPC formulations.
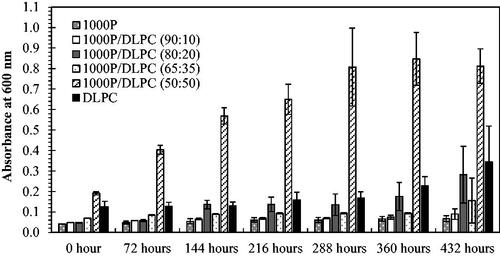
Figure 6. The shelf-life stability for different 1000 P/DMPC formulations.
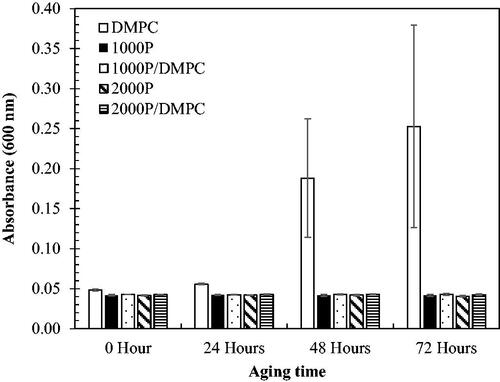
To examine the effect of polymer hydrophobicity on its complexation with PC, the two PSMA types of similar averaged molecular weight (Mn 2000–3000 g/mol) but different molar St/MA ratio, ranging from 1:1 (1000 P) to 2:1 (2000 P), were employed to complex with DMPC lipid. Results in illustrate the similarity in the stability profiles for both 1000 P/DMPC and 2000 P/DMPC systems.
Figure 7. The changes of the averaged UV-absorbance (600 nm) as a function of time for different PSMA/DMPC (90:10) formulations. Results for the aqueous solutions of DMPC and PSMA (1000 P or 2000 P type) are also plotted for comparison.
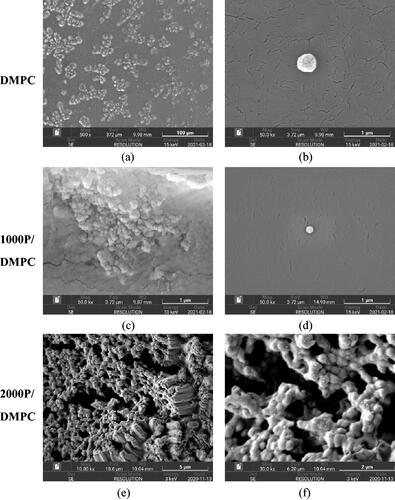
A combined use of both DLS and SEM techniques could confirm the formation of the PSMA/PC nanoparticles. As seen in , aqueous DMPC solution is consisted of particles with the mean size diameter of around 368 nm (PDI = 0.787). The result is consistent with the SEM images showed in . As expected, these particles show ability to aggregate after a short-time storage (15 min), as convinced by the appearance of an elevated baseline in the raw correlation plot presented in (dashed blue). Complexation with either 1000 P or 2000 P polymer completely transforms them into ultrafine nanoparticles. As noticed in (solid black and solid red), their sizes decrease significantly to around 18 nm with the narrower PDI between 0.203 and 0.259.
Figure 8. Particle size distribution plots (top) and correlation plots (bottom) of hydrated DMPC (solid blue), 1000 P/DMPC (solid black), and 2000 P/DMPC (solid red) particles. The changes in the DLS profiles after a short-term storage (15 min) were also demonstrated for each sample (dashed lines).
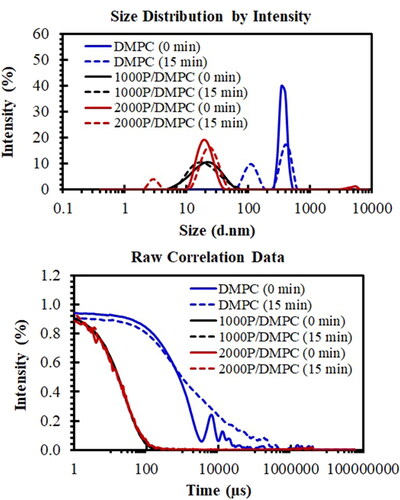
Figure 9. SEM images of DMPC vesicles (a–b) and the PSMA/DMPC particles. Image of (a), (b–d), (e) and (f) were taken at the magnifications of ×500, ×50,000, ×10,000 and ×30,000, respectively.
DLS technique can also be applied for investigation of particle stability. After a short-time storage (15 min), a monomodal size distribution of DMPC (solid blue in ) is altered to a bimodal distribution profile (dashed blue in ). The smaller size population is found at 111 nm, while that of the larger one is at 407 nm. For 1000 P/DMPC, the size distribution and the correlation plots remained unchanged after 15 min. The 1000 P/DMPC particles display the size diameter of around 22 nm with the PDI value of 0.215. In the case of 2000 P/DMPC, the main size population at 21 nm is slightly shifted to 24 nm (dashed red in ). The correlation plots for all PSMA-containing samples are utmost similar to those of their corresponding freshly prepared samples ().
Drug encapsulation
The feasibility of using PSMA/DMPC particles for nanoencapsulation was demonstrated on the hydrophobic model compound, oil red O, with the octanol/water partition coefficient (LogP) of around 7–8. Prior to the study, the calibration plot of this compound in ethanol was constructed with the linear regression parameter (R2) of 0.9999 (data not showed). By using this plot and EquationEquation (3)(3)
(3) , the entrapped dye proportion (Cf) and the encapsulation efficiency (% EE) of the hybrid particles were determined. As seen in , the 1000 P/DMPC particles show lesser capacity of the dye loading (4%), comparing to those of the 2000 P/DMPC (7%). Similar behaviour is observed for the case of ethanolic propolis extracts. The loading capacity of the 2000 P/DMPC nanoparticles is around 20%, approximately threefold increase in the loading capacity comparing to the 1000 P/DMPC system (). As showed in , encapsulation of bee propolis alters the size distribution profiles of both PSMA/DMPC systems. The sizes (Z-average) of the 1000 P/DMPC and 2000 P/DMPC particles is shifted from around 18 nm to 114 nm (solid blue), and to 80 nm (solid red). The broadened correlation plots in (solid blue and red) comparing to the freshly-prepared samples (solid black and grey) also reveal the extent of particle enlargement caused by propolis encapsulation. Nonetheless, these loaded particles are quite stable during a short-time storage (15 min). The absence of the baseline-lift in the correlation plot in (dashed blue and red) illustrates no sign of particle aggregation in both PSMA systems. The mean peak positions for the loaded-1000P/DMPC at 0 min (freshly-prepared) and 15 min (storage) are still detected within the same particle size region (143–150 nm). For the loaded-2000P/DMPC particles (15 min), the mean peak is found at around 127 nm (dashed red), slightly shift from those of the freshly-prepared sample (100 nm).
Figure 10. Size distribution plots (top) and correlation plots (bottom) of the loaded-particles of 1000 P/DMPC (solid blue) and 2000 P/DMPC (solid red) in comparison to their corresponding unloaded particles. The changes in the distribution profiles for the loaded-1000P/DMPC (dashed blue) and loaded-2000P/DMPC (dashed red) after a short-term storage (15 min) were also demonstrated (dashed lines).
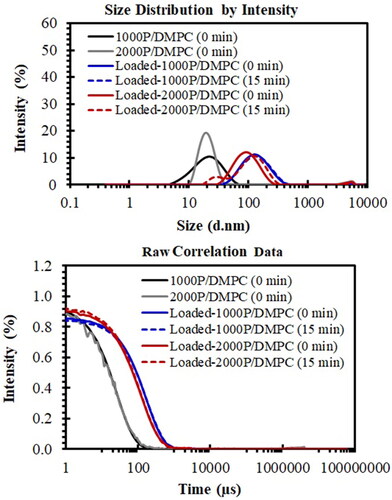
Table 1. Encapsulation efficiency (EE%) of different PSMA/DMPC systems.
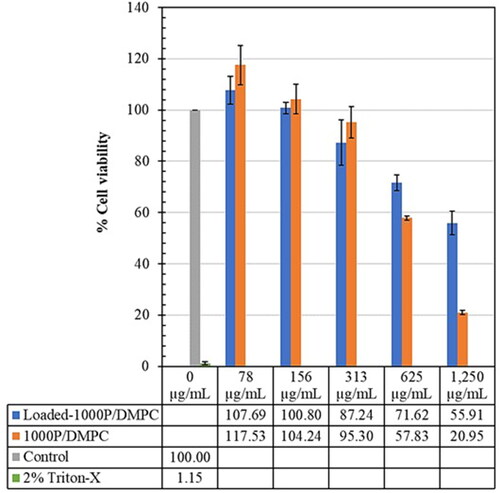
Effect of the 1000 P/DMPC formulations on the viability (%) of the Vero cell lines is illustrated in . After 24 h of incubation, the cell viability (%) of the samples, treated with the 1000 P/DMPC (unloaded) and propolis-loaded 1000 P/DMPC at the concentration of 78 µg/mL, are 117.53 ± 7.68 and 107.69 ± 5.48, respectively. Their cell viability is higher than that of the control group (100.00 ± 0.00). At the higher concentrations (625 µg/mL and 1250 µg/mL), the Vero cell viability reduces to lower than 80%.
Figure 11. Effect of the 1000 P-containing formulations (78–1250 µg/mL) on the Vero cell line viability (%), comparing to those of the control (untreated) and positive (2% Triton-X) groups.
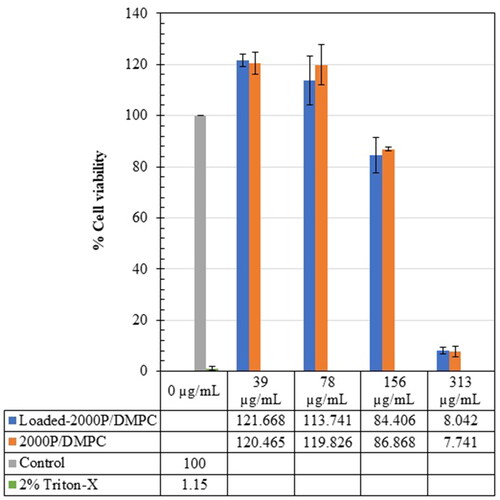
Similar trend can also be observed when treating with the 2000 P/DMPC formulations (see ). After 24 h of exposure to the unloaded- and loaded-2000P/DMPC samples, the increased viability of Vero cell lines is obtained at their low concentrations (39 µg/mL, 78 µg/mL). The values reach to around 120% (2000 P/DMPC), and 114–122% (loaded-2000P/DMPC). A further addition of the 2000 P/DMPC formulations (>156 µg/mL) significantly decreased the number of viable cells to 7.74 ± 2.06 (unloaded), and to 8.04 ± 1.28 (empty vesicles).
Discussion
Bee propolis is generally composed of resin (50%), waxes (30%), essential oil (10%) and pollen (5%) [Citation1]. Isolation of the resinous constituent was achieved by immersing of the raw sample in the icy water to remove any beeswax and oily components. The de-waxed propolis was further purified by extraction in ethanol, obtaining the final products of around 42% (w/w). This extraction yield was quite comparable to those obtained by the previous study [Citation30]. The appearance of the maximum UV-absorption peak at 289 nm (data not showed) confirmed the presence of flavonoids in the propolis extracts. These compounds are responsible for the varieties of propolis pharmacological activities, such as antioxidant, anti-inflammatory and antimicrobial profiles. To quantify the flavonoid content, the AlCl3 colorimetric method was used. The technique is relied on the nitrosation of flavonoids with nitrous acid, producing the products readily to be complexed with Al3+ species. The complexes are known to be spectrophotometrically detected at the UV-absorbance of around 510 nm [Citation26]. Through this reaction, the total flavonoid content in the propolis extracts was approximated to be around 90 mg CE/g, accounting for around 9% (w/w) of the dried ethanolic extracts. To evaluate their free-radical scavenging antioxidant, the IC50 value of the propolis sample was examined and then compared with those of ascorbic acid (IC50 = 1 μg/mL) and BHT standard (IC50 = 7 μg/mL) (see ). The greater IC50 value of around 90 μg/mL illustrated a weaker inhibitory activity of propolis towards DPPH radical [Citation31]. This could be due to the coexistence of other compounds, including fatty acids, terpenoids and alkaloids. Nevertheless, the stingless Thai propolis showed the stronger DPPH antioxidant capacity than those obtained from Brazil, including Melipona quadrifasciata (IC50 = 242 μg/mL), Tetragonisca angustula (IC50 = 2433 μg/mL) and Plebeia droryana (IC50 = 182 μg/mL) [Citation32].
In order to produce the most stable PSMA/PC nanoparticle, a critical pKa value for PSMA was initially examined. Potentiometric titration curve in revealed that the half-equivalent point volumes (1/2 Eq) for 2000 P and 1000 P precursors were around 0.5 mL and 0.75 mL, respectively. Based on these values, the corresponding pKa values for 2000 P and 1000 P were found to be around 4.8 and 4.3, respectively. The increased pKa value in 2000 P sample re-confirmed the lesser MA content in the copolymer structure. At pH = pKa, the molecules of PSMA are expected to collapse into a distinct hydrophobic domain, allowing them to adapt into a collapsed coil [Citation18], and/or a polymeric micelle [Citation17]. The formation of such hydrophobic domain was earlier demonstrated by the environmentally sensitive fluorescent probes. The fluorescence behaviour of Nile red (NR) probe is known to be dependent of the polarity of the surrounding environment in which the compound is resided. This unique property enables the compound to be used as a probe to follow the coil-to-globule transition of the protein-like polymers [Citation33]. Results by Scheidelaar and co-workers revealed a shift in the NR emission spectra from 660 nm to 620 nm, suggesting that the probe was gradually transferred from a polar water subphase into an apolar region of the collapsed PSMA chains [Citation17]. The prefabricated non-polar region would serve as a binding site for lipid association, causing the bilayer membrane to be disrupted and solubilized into the very fine nanoparticles that do not scatter the UV light source [Citation12,Citation34]. The optically clear PSMA/PC formulations with Abs < 0.2, observed in (0 h) and (0 h), provided good support in this matter.
It is worth mentioning that the PSMA/PC complexation can produce varieties of the end-state complexes, depending on the types of the precursors and their feed compositions. The end-state products can be the disc-like nanoassemblies (so-called nanodiscs) and the mixed lipid/PSMA structures, including ellipsoidal micelles, spherical micelles and/or rods [Citation24,Citation35,Citation36]. Due to the differences in size and configuration, stability of these particles was believed to be varied, ranging from hours to months. To clarify this, the UV absorption (Abs, 600 nm) of a particular formulation was measured as a function of time. The higher the Abs values the formulation displays, the greater extent of particle aggregation, and so the loss of structural stability would the system become. At the sufficiently high mass percentages of PSMA to PC (90:10 and 80:20 in and ), the samples exhibited the negligible changes in their Abs values after 432 h, suggesting little or no particle aggregation. In these cases, the polymer-lipid complexation may produce a true equilibrium end-state complex with a very long lifetime pathway. For the lower PSMA/PC mass proportions (65:35 and 50:50 in and ), they show a noticeable increasing in the Abs values at the end of 432 h. This could be due to a further particle aggregation into larger supramolecular structures that starts to scatter the light sources. The complete conversion of PC vesicles into the most stable PSMA/lipid nanostructures therefore requires a high concentration of PSMA. This was supported by the small-angle X-ray scattering data reported earlier [Citation37]. The scattering profiles suggested that the excess PSMA molecules are necessary for the formation of the belt structure at the rim of nanodiscs. This polymeric belt can serve as a stabilization effect to shield the hydrophobic surface of the nanostructures from the unfavourable water interactions, thus promoting their long-term stability [Citation38].
The obvious particle aggregation was found in the 1000 P/DMPC complexation (). The explanation is perhaps linked to the temperature-dependent motion of the lipids. For DMPC lipid, the main crystalline-to-liquid phase transition temperature (Tm) is around 23 °C, higher than that of DLPC (−3 °C) [Citation39]. At the temperature of complexation (25 °C), the molecules of DMPC are likely to coexist in both the liquid and crystalline phase bilayers. For those existing in the crystalline phase, they are expected to be greatly constrained by the non-polar interactions between the near neighbour acyl chains. As a result, their lateral mobility and molecular diffusion would have been quite limited, making them less accessible to interact with 1000 P molecules. The less effective 1000 P/DMPC complexation would result in the formation of diverse end-state complexes of varying in sizes, shapes and shelf-life stability. For 1000 P/DLPC systems, these mobility constraints were less of a problem due to the excessively lower Tm value than at the formulating temperature (25 °C). Consequently, DLPC molecules in their liquid phase bilayers would experience the greater degree of freedom to move, interact, and eventually complex with 1000 P molecules in the forms of very fine and stable nanostructures. This could be the reason for the decreased UV absorption in the 1000 P/DLPC system (), comparing to 1000 P/DMPC system (). Similar explanation was made by Scheidelaar and co-workers, who investigated the extent of PSMA-induced solubilization both at and below the Tm value. At the temperature below Tm, complexation of DMPC and PSMA (molar St/MA = 1.4:1) produced a slightly turbid formulation (OD ≈ 0.6–0.7), suggesting that the process of membrane solubilization into the nanostructures was incompleted. After raising the temperature to Tm, the OD value was further reduced. Within a few minutes, the near-zero value (OD ≤ 0.1) was achieved, implying that PSMA molecules could now entered into hydrophobic core of the bilayer membrane and induce the nanodisc formation. The less effective membrane solubilization was thus suggested to primarily due to an inability of the polymer to effectively insert and destabilize the membrane vesicles, rather than its incapability to form the lipid nanodiscs [Citation17].
The effects of the increased PSMA hydrophobicity on its PC complexation was demonstrated on the most challenging DMPC lipid, whose local diffusion in the membrane bilayer was rather restricted at 25 °C. The mass percentage of 90:10 (PSMA/DMPC) was chosen because of the least Abs values over the 72 h. As noticed in , an aqueous DMPC solution showed the loss of optical transparency within 24 h, implying that the charged repulsion on the lipid bilayers alone is not sufficient to prevent a further vesicular aggregation. An elevated baseline shift in the DLS correlation curve (dashed blue in ) confirms that this phenomenon actually proceeds rapidly within the first 15 min. Depending on the vesicular surface charge, this process could last from weeks to months [Citation37]. On the addition of PSMA (1000 P or 2000 P), the particle aggregation seems to be suppressed (Abs < 0.05). The is also convinced by the overlapped correlation curves for both the freshly-prepared (solid black and red in ) and the stored- PSMA/DMPC particles (dashed black and red). The polymer molecules may create an extra hydrophobically-driven stabilization effects to strengthen the end-state lipid assemblies and then, slow down their transition dynamics (eg self-aggregation). Consequently, the samples would display the prolonged shelf-life stability, as in the cases for all PSMA-containing formulations observed in both the short-term stability profiles () and the long-term profiles ( and ). The fact that the 1000 P/DMPC and 2000 P/DMPC samples exhibit quite similar stability profiles implied that these stabilization effects are extremely strong, and may have already been established even in the 1000 P system (1:1 St/MA).
The complete DMPC destabilization, and then rearrangement into the ultrafine end-state products were re-confirmed by the DLS results in . As noticed, typical aqueous solution of DMPC was composed of the particles with the averaged size diameter of around 368 nm. These particles were non-uniform in shape and displayed the ability to self-aggregate into larger molecular dimensions, as visually observed in the SEM images presented in , and a baseline-lift in the correlation plot (dashed blue in ). Upon PSMA complexation, the lipid particles displayed the reduced particle size diameters to around 18 nm (solid black and red in ). The absence of the large size population between 290 and 550 nm re-confirms the complete membrane lipid destabilization into the very fine nanoparticles. Here, the ordered bilayer arrangement of the lipid molecules was suggested to be preserved. This was convinced by the unchanged spectral fluorescence profiles of the membrane lipid for both before and after PSMA complexation [Citation40]. Nonetheless, the lipid acyl chain packing in the nanodiscs was reported to be tightened than those in the lipid vesicles alone [Citation41,Citation42]. This could serve as a protective reservoir for low polarity compounds to be encapsulated and shielded effectively from the unfavourable interactions with water molecules. Clustering of an individual PSMA/DMPC particle was detected in the SEM images (), suggesting a significant impact of dehydration process on the particle stability. For the case of the 2000 P/DMPC sample, an interconnected three-dimensional supramolecular network structure was observed (). This may be caused by the enhanced hydrophobic interactions among the excess 2000 P chains.
Implementation of the PSMA/PC nanoparticles in drug encapsulation was illustrated on the hydrophobic model compound, oil red O, with the extremely high octanol/water partition coefficient (LogP) of around 8 [Citation24]. Due to its exceptional hydrophobicity, this compound is generally used for staining of lipid cell membrane in histological analysis. As seen in , the 1000 P/DMPC nanoparticles showed lesser capacity of the dye loading (4%), comparing to those of the 2000 P/DMPC (7%). The greater dye loading efficiency of the latter is perhaps attributed to the strengthen hydrophobically-driven binding with the dye caused by the increased molar St/MA proportion in the PSMA structure. Similar behaviour is also observed for the case of ethanolic propolis. The loading capacity of the 2000 P/DMPC nanoparticles is around 20%, approximately threefold increase in the loading capacity comparing to that of the 1000 P/DMPC system ().
The entrapped proportion of the ethanolic extracts may correspond to a wide variety of chemical compounds, such as phenolic aldehydes, ketones, terpenes, alkaloids, as well as polyphenols, including phenolic acids, esters and flavonoids [Citation43,Citation44]. Among these, flavonoids are considered to be the main active compounds of bee propolis. Flavonoid structure is generally based on the fifteen-carbon skeleton. One aromatic ring (ring A) is interconnected with another (ring B) through the heterocyclic pyran chromophore (ring C). Depending on the type of the substituent group(s) on these ring structures, flavonoids can be sub-divided into flavones, flavonols, flavanones, flavanonol, isoflavones and flavan-3-ols. Most of them exhibit two major UV absorption bands; Band I (320–385 nm, ring B) and Band II (250–285 nm, ring A). Unlike other flavonoids, flavanones generally display a very strong UV spectral characteristic at 270–295 nm (Band II) with a shoulder signal at around 326 nm (Band I, ring B). In the case of the di-, tri-, or o-substituted B ring, the Band II would appear as two peaks, while that of the mono-substitution, a single peak would be observed. For our propolis extracts, a very strong UV signal at 289 nm with no shoulder signal was detected (data not showed), implying that naringenin, liquiritigenin, and/or hydroxyflavanones may exist as the predominant chemical constitutes in T. terminata red propolis from Thailand. To clarify this, additional experiments based on the chromatographic technique would be carried out in the near future.
DLS technique proved to be a useful tool for the study of short-term stability of the PSMA/DMPC particles. As seen in , encapsulation of propolis increases the sizes of both 1000 P/DMPC and 2000 P/DMPC particles, changing from 18 nm to above 100 nm (solid blue and red). The increased size implies a successful loading of propolis into the nanodiscs. The lesser particle enlargement in 2000 P/DMPC (solid red in ) can be explained in terms of the strengthened non-polar interactions caused by propolis encapsulation. Such stabilization effects allow lipophilic compounds (e.g., bee flavonoids) to be encapsulated to the greater extent, thus explaining the improved loading capacity of the 2000 P/DMPC particles as summarized in . Comparing to the loaded-1000P/DMPC system, the strengthened non-polar forces can lead to the extended shelf-life stability over a longer period of time. This is convinced by the greater shift in the correlation plot towards a shorter time-scale observed in (dashed red), as compared to that of those loaded-1000P/DMPC particles (dashed blue).
Interaction of the nanodiscs with Vero cells was demonstrated through the MTT assay. Vero cells (epithelial kidney cell line) were chosen because of their resistance and ease of cultivation within 24 h. The Vero cell assay was considered as the gold standard to rapidly screen the cytotoxicity profiles of new therapeutic agents [Citation45,Citation46]. Different concentrations of the propolis-loaded and unloaded nanodiscs (1000 P/DMPC, and 2000 P/DMPC) were evaluated for their cell viability (%). The results provided a key for a future design of PSMA/lipid nanostructure with the greatest healthcare potency but minimal adverse effects. Data obtained from the MTT measurement suggests an increased cytotoxic effect with the increasing of 1000 P/DMPC and 2000 P/DMPC concentrations ( and ). Between them, Vero cells are most sensitive to the 2000 P/DMPC formulations. At 313 µg/mL, their cell viability is below 10%, almost comparable to the positive control (Triton-X). The 1000 P/DMPC treatments however showed less cytotoxicity. The cell viability remains above 85%, implying a non-cytotoxicity for biomedical application. According to and , within a low concentration region (<78 µg/mL), both 1000 P/DMPC and 2000 P/DMPC formulations exhibit ability to promote the Vero cell growth. All of the treated cells display the increased cell viability (>105%) comparing to the control group. The explanation may be related to the enhanced vesicle-cell interactions. To the best of our knowledge, interaction of nanodiscs with Vero cell line has never been reported. Due to a similar bilayer arrangement, the mechanisms of liposome-cell interactions [Citation47] may be applied for the nanodisc scenario. Led by the accelerated cell growth effect, it is believed that the phospholipid of the nanodiscs can associate with the cellular membrane, resulting in the formation of a micro-pore defect [Citation48,Citation49], that enables passage of essential ingredients (e.g., hormones, growth factors and minerals in the foetal bovine serum) across the plasma membrane. When these interactions were excessively too strong, as in the case of the high nanodisc concentrations (>156 µg/mL), the merging (or fusion) of the Vero cell membrane with the phospholipid and/or PSMA of the nanodiscs can be occurred, causing the cells to lose their structural integrity and biological function. The chemical nature of the nanodiscs, such as hydrophobicity, size and surface charge, can influence the cellular interactions. Driven primarily by the hydrophobically-associative force, 2000 P/DMPC is more capable of interacting with the plasma membrane than the 1000 P/DMPC, thus explaining the enhanced cytotoxicity effects in .
Figure 12. Effect of the 2000 P-containing formulations (39–313 µg/mL) on the Vero cell line viability (%), comparing to those of the control (untreated) and the positive (2% Triton-X) groups.
As compared to typical multilamellar vesicular systems (0.5–10 µm in diameter), membrane interaction with the nanodiscs is believed to be strengthened due to the very fine nanometric sizes. The larger area to volume ratio of nanoparticles provides smoother entry through bilayer membrane, and ultimately into the cells. For instance, the shorter single-walled carbon nanotubes with a length of 30 nm exhibited an improved cellular internalization, as compared to those of a 50 nm length [Citation49]. Unlike the 70 nm-sized gold nanoparticles (GNPs), most of the smaller GNPs (13 nm) could successfully permeate into the cell membrane [Citation50]. Regarding this size-related effect, the optimum size of the drug-loaded particles was suggested to be around 100–200 nm (PDI < 0.5) [Citation51]. Data from the DLS measurements in highlights the great potency of the propolis-loaded particles for drug delivery applications. Due to potential cytotoxicity effects, biomedical use of these nanovesicles should be cautioned. The low dose administration (<78 µg/mL) is recommended to achieve the greatest therapeutic effects and avoid any adverse reactions.
Conclusion
The hybrid PSMA/phospholipid nanovesicles were successfully prepared in an aqueous media. The hydrophobically-driven complexation of the two components were found to be dependent of various parameters, such as the feed composition, lipid phase transition temperature, pH solution and the drug-vesicle interactions. With the excess use of the PSMA precursor (> 80% PSMA), the most stable nanovesicles were obtained with no sign of particle aggregation even after 18 days. The freshly prepared hybrid particles exhibited the very fine nano-scaled diameters (18 nm). Around one-fifth of the ethanolic propolis extracts was successfully entrapped within the 2000 P/DMPC structures in the forms of water-soluble formats. Their particle sizes were larger than those of the empty vesicles (80–115 nm). For the hydrophobic model compound (oil red O dye), the maximum loading capacity of around 7% was achieved by an aqueous 2000 P/DMPC encapsulation. Cytotoxicity profile on Vero cell of these nanovesicles was dependent of their administration dose. At low concentration (<78 µg/mL), they were considered to be non-cytotoxic with the ability to promote the cell growth. These advantages offer them superior characteristics for drug delivery systems, especially for poorly water-soluble therapeutic drugs.
Author contribution
Chatmani Buachi: Conceptual design, sample preparation and performed the DLS experiments and conceived the presented idea for and . Charothar Thammachai: Conceptual design, sample preparation, performed the experiments and conceived the presented idea for . Brian J. Tighe: Conceived the original idea for the polymer-lipid association in and and revised the manuscript with intellectual content. Paul D. Topham: Conceptual design for PSMA characterization, revised the manuscript with intellectual content, shared responsibility to resolve the reviewer’s comments. Robert Molloy: Supervised the project, aided in discussion of the PSMA conformational transition, provided critical feedbacks and reshaped the final manuscript. Patchara Punyamoonwongsa: Conceptual design, selection of the experimental protocols, in charge of overall data analysis and interpretation, took the lead in writing the manuscript with inputs from all authors, final approval of the version to be published. All authors provided critical feedbacks, contributed and agreed to the published version of the manuscript. As per ICMJE recommendations, all authors met the criteria for authorship.
Disclosure statement
No potential conflict of interest was reported by the author(s).
Data availability statement
The authors confirm that the data supporting the findings of this study are available within the article.
Additional information
Funding
References
- Wagh VD. Propolis: a wonder bees product and its pharmacological potentials. Adv Pharmacol Pharm Sci. 2013;2013:1–11.
- Daleprane JB, Abdalla DS. Emerging roles of propolis: antioxidant, cardioprotective, and antiangiogenic actions. Evid Based Complement Alternat Med. 2013;2013:175135.
- Grange JM, Davey RW. Antibacterial properties of propolis (bee glue). J R Soc Med. 1990;83(3):159–160.
- Kocot J, Kiełczykowska M, Luchowska-Kocot D, et al. Antioxidant potential of propolis, bee pollen, and royal jelly: possible medical application. Oxid Med Cell Logev. 2018;2018:1–29.
- Szliszka E, Kucharska AZ, Sokół-Łętowska A, et al. Chemical composition and anti-Inflammatory effect of ethanolic extract of Brazilian green propolis on activated J774A.1 macrophages. Evid Based Complement Alternat Med. 2013;2013:976415.
- Mohdaly A, Mahmoud AA, Roby MHH, et al. Phenolic extract from propolis and bee pollen: composition, antioxidant and antibacterial activities. J Food Biochem. 2015;39(5):538–547.
- Walker P, Crane E. Constituents of propolis. Apidologie. 1987;18(4):327–334.
- Eichsteininger J, Kirisits K, Smöch C, et al. Structural insight into the in vitro anti-intravasative properties of flavonoids. Sci Pharm. 2019;87(3):23.
- Kubiliene L, Jekabsone A, Zilius M, et al. Comparison of aqueous, polyethyleneglycol-aqueous and ethanolic propolis extracts: antioxidant and mitochondria modulating properties. BMC Complement Altern Med. 2018;18(1):1–10.
- Agnihotri N, Mishra R, Goda C, et al. Microencapsulation – a novel approach in drug delivery: a review. Indo Global J Pharm Sci. 2012;02(01):01–20.
- Rosseto HC, Toledo L, Francisco L, et al. Nanostructured lipid systems modified with waste material of propolis for wound healing: design, in vitro and in vivo evaluation. Colloids Surf B Biointerfaces. 2017;158:441–452.
- Saez-Martinez V, Punyamoonwongsa P, Tighe BJ. Polymer-lipid interactions: biomimetic self-assembly behaviour and surface properties of poly(styrene-alt-maleic acid) with diacylphosphatidylcholines. React Funct Polym. 2015;94:9–16.
- Baghayeri M, Zare EN, Namadchian M. Direct electrochemistry and electrocatalysis of hemoglobin immobilized on biocompatible poly (styrene-alternative-maleic acid)/functionalized multi-wall carbon nanotubes blends. Sens Actuat B. 2013;188:227–234.
- Khaojanta T, Kalaithong W, Somsunan R, et al. Synthesis and characterization of block copolymers of styrene‐maleic acid with acrylamide and N, N‐dimethylacrylamide. Polym Eng Sci. 2022;62(6):2031–2046.
- Zareh EN, Moghadam PN. Synthesis and characterization of conductive nanoblends based on poly (aniline‐co‐3‐aminobenzoic acid) in the presence of poly (styrene‐alt‐maleic acid). J Appl Polym Sci. 2011;122(1):97–104.
- Punyamoonwongsa P, Kakumyan P, Saichana N, et al. Structural modification of styrene maleic anhydride copolymers for plant bioactive compound extraction. Key Eng Mater. 2019;798:351–357.
- Scheidelaar S, Koorengevel MC, Van Walree CA, et al. Effect of polymer composition and pH on membrane solubilization by styrene-maleic acid copolymers. Biophys J. 2016;111(9):1974–1986.
- Tonge S, Tighe BJ. Responsive hydrophobically associating polymers: a review of structure and properties. Adv Drug Deliv Rev. 2001;53(1):109–122.
- Ravula T, Ramadugu S, Mauro GD, et al. Bioinspired, size-tunable self-assembly of polymer-lipid bilayer nanodiscs. Angew Chem Int Ed Engl. 2017;56(38):11466–11470.
- Pierre MBR, Marchetti JM, Tedesco AC, et al. Potencial incorporation of 5-aminolevulinic acid in micelles and stratum corneum lipids liposomes: fluorescence quenching studies. Braz J Pharm Sci. 2001;37:355–361.
- Schmid M-H, Korting H. Therapeutic progress with topical liposome drugs for skin disease. Adv Drug Delivery Rev. 1996;18(3):335–342.
- Punyamoonwongsa P. Lipid nanodiscs of poly(styrene-alt-maleic acid) to enhance plant antioxidant extraction. e-Polymers. 2022;22(1):607–614.
- Pierre MBR, Dos Santos Miranda Costa I. Liposomal systems as drug delivery vehicles for dermal and transdermal applications. Arch Dermatol Res. 2011;303(9):607–621.
- Punyamoonwongsa P. Synthetic analogues of protein-lipid complexes [PhD]. Aston University, Birmingham, United Kingdom; 2007.
- Punyamoonwongsa P, Tangsongcharoen W, Phoungtawee P, et al. pH-Responsive styrene maleic anhydride with improved surface activity. KMUTNB: IJAST. 2018; 11(1), 45–51.
- Magalhães LM, Almeida M, Barreiros L, et al. Automatic aluminum chloride method for routine estimation of total flavonoids in red wines and teas. Food Anal Methods. 2012;5(3):530–539.
- Pujirahayu N, Ritonga H, Uslinawaty Z. Properties and flavonoids content in propolis of some extraction method of raw propolis. Int J Pharm Pharm Sci. 2014;6:338–340.
- Yehye WA, Rahman NA, Ariffin A, et al. Understanding the chemistry behind the antioxidant activities of butylated hydroxytoluene (BHT): a review. Eur J Med Chem. 2015;101:295–312.
- Mokhtar SU. Comparison of total phenolic and flavonoids contents in Malaysian propolis extract with two different extraction solvents. Int J Eng Technol Sci. 2019;6(2):1–11.
- Cunha IBS, Sawaya A, Caetano FM, et al. Factors that influence the yield and composition of Brazilian propolis extracts. J Braz Chem Soc. 2004;15(6):964–970.
- Zin NBM, Azemin A, Rodi MMM, et al. Chemical composition and antioxidant activity of stingless bee propolis from different extraction methods. Int J Eng Technol. 2018;7:90–95.
- Lavinas FC, Macedo E, Sá GBL, et al. Brazilian stingless bee propolis and geopropolis: promising sources of biologically active compounds. Braz J Pharmacogn. 2019;29(3):389–399.
- Murnen HK, Khokhlov AR, Khalatur PG, et al. Impact of hydrophobic sequence patterning on the coil-to-globule transition of protein-like polymers. Macromolecules. 2012;45(12):5229–5236.
- Zhang R, Sahu ID, Bali AP, et al. Characterization of the structure of lipodisq nanoparticles in the presence of KCNE1 by dynamic light scattering and transmission electron microscopy. Chem Phys Lipids. 2017;203:19–23.
- Knowles TJ, Finka R, Smith C, et al. Membrane proteins solubilized intact in lipid containing nanoparticles bounded by styrene maleic acid copolymer. J Am Chem Soc. 2009;131(22):7484–7485.
- Tanaka M, Hosotani A, Tachibana Y, et al. Preparation and characterization of reconstituted lipid–synthetic polymer discoidal particles. Langmuir. 2015;31(46):12719–12726.
- Bjørnestad VA, Orwick-Rydmark M, Lund R. Understanding the structural pathways for lipid nanodisc formation: how styrene maleic acid copolymers induce membrane fracture and disc formation. Langmuir. 2021;37(20):6178–6188.
- Hall SC, Tognoloni C, Price GJ, et al. Influence of poly (styrene-co-maleic acid) copolymer structure on the properties and self-assembly of SMALP nanodiscs. Biomacromolecules. 2018;19(3):761–772.
- Chen W, Duša F, Witos J, et al. Determination of the main phase transition temperature of phospholipids by nanoplasmonic sensing. Sci Rep. 2018;8(1):1–11.
- Pardo JD, Dörr J, Renne M, et al. Thermotropic properties of phosphatidylcholine nanodiscs bounded by styrene-maleic acid copolymers. Chem Phys Lipids. 2017;208:58–64.
- Stepien P, Augustyn B, Poojari C, et al. Complexity of seemingly simple lipid nanodiscs. Biochim Biophys Acta Biomembr. 2020;1862(11):183420.
- Stepien P, Polit A, Wisniewska-Becker A. Comparative EPR studies on lipid bilayer properties in nanodiscs and liposomes. Biochim Biophys Acta. 2015;1848(1 Pt A):60–66.
- Ahangari Z, Naseri M, Vatandoost F. Propolis: chemical composition and its applications in endodontics. Iran Endod J. 2018;13(3):285–292.
- Anjum SI, Ullah A, Khan KA, et al. Composition and functional properties of propolis (bee glue): a review. Saudi J Biol Sci. 2019;26(7):1695–1703.
- Rajablou K, Attar H, Sadjady SK, et al. DSPC based polymeric micelles loaded with amphotericin B: synthesis, characterization, and in vitro study. Nanomed Res J. 2023;8(1):37–49.
- To CZ, Bhunia AK. Three dimensional vero cell-platform for rapid and sensitive screening of Shiga-toxin producing Escherichia coli. Front Microbiol. 2019;10:949.
- Pagano RE, Weinstein JN. Interactions of liposomes with mammalian cells. Annu Rev Biophys Bioeng. 1978;7:435–468.
- Augustine R, Hasan A, Primavera R, et al. Cellular uptake and retention of nanoparticles: insights on particle properties and interaction with cellular components. Mater Today Commun. 2020;25:101692.
- Matson ML. Ultra-short, single-walled carbon nanotube capsules for diagnostic imaging and radiotherapy. Rice University; 2012.
- Yue J, Feliciano TJ, Li W, et al. Gold nanoparticle size and shape effects on cellular uptake and intracellular distribution of siRNA nanoconstructs. Bioconjug Chem. 2017;28(6):1791–1800.
- Jayachandran P, Ilango S, Suseela V, et al. Green synthesized silver nanoparticle-loaded liposome-based nanoarchitectonics for cancer management: in vitro drug release analysis. Biomedicines. 2023;11(1):217.