
 ?Mathematical formulae have been encoded as MathML and are displayed in this HTML version using MathJax in order to improve their display. Uncheck the box to turn MathJax off. This feature requires Javascript. Click on a formula to zoom.
Abstract
Electrical characteristics of living cells have been proven to reveal important details about their internal structure, charge distribution and composition changes in the cell membrane, as well as the extracellular context. An impedance flow cytometry is a common approach to determine the electrical properties of a cell, having the advantage of label-free and high throughput. However, the current techniques are complex and costly for the fabrication process. For that reason, we introduce an integrated dual microneedle-microchannel for single-cell detection and electrical properties extraction. The dual microneedles utilized a commercially available tungsten needle coated with parylene. When a single cell flows through the parallel-facing electrode configuration of the dual microneedle, the electrical impedance at multiple frequencies is measured. The impedance measurement demonstrated the differential of normal red blood cells (RBCs) with three different sizes of microbeads at low and high frequencies, 100 kHz and 2 MHz, respectively. An electrical equivalent circuit model (ECM) was used to determine the unique membrane capacitance of individual cells. The proposed technique demonstrated that the specific membrane capacitance of an RBC is 9.42 mF/m−2, with the regression coefficients, at 0.9895. As a result, this device may potentially be used in developing countries for low-cost single-cell screening and detection.
Background
Label-free analysis in the microfluidic single-cell impedance technique is widely utilized for early cancer detection, disease development prediction and therapeutic intervention suggestions. The label-free analysis technique is a significant study due to how it reflects cell phenotype, such as biophysical electrical or mechanical properties. It is label-free means that the cells are not changed by chemical reagents or by extensive handling [Citation1]. This label-free method protects cells from adverse effects associated with label production and is helpful in a wide range of applications. Microfluidic impedance spectroscopy is one commonly employed label-free method that is capable to measure the electrical characteristics of cells. Electrokinetic techniques based on alternating current (AC), particularly electrorotation and/or dielectrophoresis, have been utilized in the past [Citation2–4]. The AC electrokinetic approach is a powerful tool capable of extracting the electrical properties of the cell; however, they lack high throughput, even though recent approaches have improved this [Citation5–7].
To address these limitations, a single-cell impedance cytometry technique was introduced, and it is now commonly utilized to determine the impedance of an individual cell [Citation8–11]. Microfluidic impedance flow cytometry (IFC) is a well-established label-free and high-throughput analysis technique, which is commonly used to determine the electrical properties of a cell. This technique allows for the investigation of single cells and cell-to-cell heterogeneity, which can be useful for early diagnosis of cancer, predicting disease progression and suggesting therapeutic interventions. Impedance flow cytometry determines the electric field screening of single cells moving through fabricated electrodes inside the microchannel by current change in response to an applied AC voltage over a range of frequencies (10 kHz to 50 MHz) (Figure S1 in Supplementary Information). The impedance of the system and properties of the cell, such as volume and dielectric properties, influence the measurement signal of IFC.
An IFC was first introduced 70 years ago for bacteria detection in aerosols [Citation12]. The development of the IFC is gained since it provides a rapid, non-invasive and real-time technique for detecting a single cell biologically. Single-cell analysis utilizing IFC demonstrates the feasibility to identify undifferentiated and differentiated stem cells [Citation13], by examining the electrical impedance ratio between two particular frequencies (a term known as opacity). Other studies have discovered that the IFC with platinum black electrode probe is capable of sensing the status of cells by measuring the impedance of cells at frequencies over 1 MHz [Citation14]. The nanoneedle electrode embedded in the microchannel is used to detect the crossing of cells on the sensor area, enabling it to be sensitive to the solution’s dielectric characteristics [Citation15]. However, the fabrication procedure will be more expensive due to the patterning of the electrode nanoneedle on the substrate. Another drawback is the device’s time-consuming cleaning process. Other researchers have introduced a microfluidic with a constriction channel, which is a simple and high throughput technique to determine the electrical characteristics of a single cell (e.g. specific membrane capacitance) [Citation16–19]. However, the microfluidic device with a constriction channel approach is difficult to optimize for size-heterogeneous samples.
Parallel, face-to-face microelectrodes configuration technique is common and widely utilized in IFC. The polystyrene (PS) beads, red blood cells (RBCs) and RBCs in glutaraldehyde were compared in the microchannel with diameters between 20 and 30 μm to extract the dielectric characteristics of individual cells [Citation20]. An impedance of individual cells was measured at two simultaneously applied frequencies; the magnitude, phase and opacity index were utilized to differentiate cells. A substantial difference was seen in the opacity of the RBCs with fixed cell membranes. It also showed that cells could be accurately detected at around 500 kHz. Other works demonstrated a blood cell differential count using a microfluidic impedance-based IFC [Citation21]. The results provide reliable impedance detection of T-lymphocytes, monocytes and neutrophils by utilizing two frequencies and supported by simultaneous fluorescence measurements. The recent development of parallel electrode configuration shows five pairs of facing electrodes were utilized to extract the parameter of electrical properties of cells at eight simultaneous frequencies measurement [Citation22]. The cytoplasm conductivity and specific membrane capacitance of RBCs and ghost (no haemoglobin in the cytoplasm) were determined at a high throughput of around 400 cells/s and 200 cells/s for frequency sweep and single-cell spectroscopy, respectively. In addition, a similar electrode configuration has been utilized to investigate the pancreatic ductal adenocarcinoma (PDAC) tumour [Citation23]. They introduced a new phase contrast metric that shows systematic changes in the cell interior electrophysiology, which has been linked to cell tumorigenicity. However, fabricating facing electrodes necessitates sophisticated fabrication equipment and causes alignment challenges. On the other hand, patterning metal electrode probes on a silicon or glass substrate is a time-consuming process that adds to the impedance sensor’s manufacturing cost.
Numerous groups have proved that utilizing a printed circuit board (PCB) as the measuring electrode minimizes the cost of microfabricating electrodes [Citation24]. They developed contactless electrode sensing in capillary electrophoresis [Citation25] and cell manipulation using dielectrophoresis [Citation26]. The electrode was built on the PCB substrate (reusable component) and sandwiched with the thin bare dielectric substrate (e.g. thin glass cover and thin polydimethylsiloxane (PDMS) film), which was attached to the PDMS microchannel (disposable component). The applied AC voltage applied at the electrodes can infiltrate the thin dielectric substrate to sense the presence of the cell. This method is capable of differentiating the white blood cells (WBC) and circulating tumour cells (CTC) from the mixture sample [Citation27]. Nevertheless, because the electric field is covered by the dielectric substrate, the penetration to the electrolyte is less and reduces the measurement sensitivity.
This paper demonstrates an integrated dual microneedles-microfluidic device for the single microbeads and RBCs in suspension detection and the membrane capacitance of RBCs estimation. The proposed IFC device aims to minimize the manufacturing cost while maintaining the device’s primary functionality (i.e. single-cell detection). This study achieves a significant cost decrease in fabrication by utilizing a tungsten microneedle as measurement electrodes. The tungsten microneedle is reusable and quite easy to clean. Two tungsten microneedles were located between the top and bottom of the disposable microchannel to sense and measure the impedance of cells flowing through an applied electric field [Citation28,Citation29]. The concept of facing electrode configuration has been used because this approach generates a more homogeneous electric field distribution (but not perfectly uniform) and is more sensitive due to the electric field being restricted to a smaller detecting volume [Citation10,Citation30]. The three-dimensional electrode configuration is better effective for high sensing accuracy and sensitivity compared to the two-dimensional configuration [Citation31,Citation32]. The capability of the technique to extract the electrical properties of single RBC and microbeads was demonstrated. The impedance data are evaluated using the curve fitting of an electrical equivalent circuit model (ECM) with Maxwell’s mixture equation and shell model to extract the electrical parameter of a single cell.
Theory
Impedance sensing is a technique that involves applying a frequency-dependent excitation signal to a system and measuring the response [Citation33,Citation34].
(1)
(1)
where ω is the frequency and
and
are the applied voltage and the response current, respectively. The dielectric characteristics of the target cells and the host medium are reflected in the response current [Citation30]. Resistance (
) and reactance (
) are the real and imaginary components of the complex impedance, respectively. The magnitude (
) and phase angle (θ) of the complex impedance are:
(2)
(2)
(3)
(3)
For this IFC, measurement involved cells flowing in a conductive medium at multiple frequencies to obtain impedance spectra. These spectra are highly dependent on the dielectric properties of the cell, which could be used to determine the electrical parameter of a cell. Through fitting simulated impedance spectra to observed ones, ECM in combination with Maxwell’s mixture theory (MMT) and shell models is often applied to achieve this goal [Citation22,Citation35].
Single-shell cell electric model
The electric model of a single cell in a liquid suspension is a popular theory and model of impedance-based measurement methods. There are several reviews for this model [Citation8,Citation30,Citation32,Citation36,Citation37]. The single-shelled spherical model, which consists of a thin insulating shell (cell membrane) and conducting sphere (cytoplasm) (Figure S2), is extensively utilized to evaluate impedance data [Citation38,Citation39]. When an AC electric field is introduced to a suspended cell, the dielectric characteristics of the cell vary as a function of frequency, which is known as Maxwell–Wagner dispersion. Maxwell’s mixture theory is utilized to investigate the dielectric behaviour of cell suspensions. The ‘single-shell’ model is a fundamental model of a cell in suspension, where the cell membrane and the cytoplasm are modelled as the thin dielectric shell and the conducting homogenous sphere, respectively [Citation40]. The single-shell model showed a good agreement with experimental data for cells with negligible nucleus or organelles. The details of MMT with a single shell model provide in section S2 of ESI [Citation10,Citation21,Citation41].
The dielectric properties of the cell may be obtained by calculating its complex impedance at various frequencies. The common frequency range of the electric signals utilized in impedance measurement is in the range of 1–10 GHz [Citation42]. The frequency range has been divided into three separate dispersions (or relaxations), which have been labelled as α, β and γ dispersions [Citation43] and represent dielectric relaxations caused by polarization processes in a complex biological environment (Figure S3). The α-dispersion, frequencies below several kHz, is interfered with by electrode polarization effects. Meanwhile, the β-dispersion is associated with the insulating cell membrane because of the interfacial polarization. The β-dispersion is commonly studied and utilized in impedance-based cell measuring technique because of several sub-dispersions dominated by the electric double-layer effect, cell size, cell membrane and cell cytoplasm [Citation8,Citation44,Citation45]. The γ-dispersion is more than 1 GHz and is generated by the reorientation of water molecules.
Equivalent circuit model for a single-shelled cell model
The ECM is widely used to extract system characteristics based on impedance measurement of multi-frequency datasets [Citation46–48]. The advantage of using electrical circuit components to model the physical phenomena that make up a certain measured impedance response lies in the immediate recognizability of the elements and their frequency response, and consequently, in the inherent potential for standardized analysis. The assumption in the ECM is that the electrical characteristics of a single cell (i.e. specific membrane capacitance) can be expressed using an equivalent circuit [Citation30,Citation49,Citation50], as illustrated in . In general, the cell membrane resistance is significantly greater compared to its capacitance and may be neglected; similarly, the cytoplasm capacitance can be neglected because it is extremely lower compared to its resistance. The impedance of the suspending medium (Zsolution) is represented by the parallel of medium capacitance () and medium resistance (
), which are in series with electric double layer capacitance (
) (). In addition, when a single particle or cell flows through the sensing region, the cell is approximated to a resistor that depicts the cytoplasmic resistance
) in series with capacitors that characterize the membrane capacitance (
as seen in . The total impedance magnitude of presence cell can be calculated using the equation:
(4)
(4)
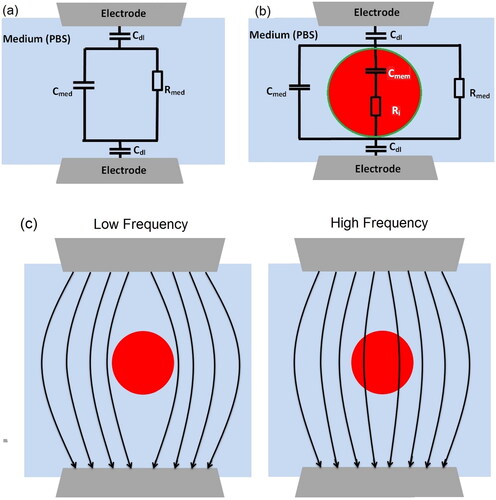
Figure 1. (a) Schematic of ECM (without cell) used to fit impedance spectrum with no cell passing (Zsolution), aiming to calculate the values of the medium capacitor () and medium resistor (
). (b) Schematic of ECM (with cell) to estimate the value of membrane capacitance (
) and cytoplasm resistance (
) (‘green’ and ‘red’ represent membrane and cytoplasm, respectively) by fitting with Zmix measurement data. (c) The schematic of electric field penetration in cells with varying viability stages at low and high frequencies. In low frequency, the cell membrane acts as a substantial impediment to current penetration, allowing for the measuring of cell size. While in high frequency, the membrane polarization decreases and current may penetrate the cell membrane giving information about the membrane properties.
The capacitance electrical double-layer occurs at the contact between the electrode’s surface and a liquid electrolyte beside it [Citation51]. often grows in proportion to the surface area of electrode. Referring to the ECM concept, high
and
can cause reduction of the observed cell and particle signals. As a result, electrodes with low capacitance electrical double-layer and high solution medium conductivity are advantageous for high-sensitivity cell sensing. All values of these parameters contributing to total impedance are dependent on frequency (ω). The total impedance between two microelectrodes in the single-shell model is given by:
(5)
(5)
where
and
represent the resistance of the medium, the resistance of cytoplasm, the capacitance of the cell membrane, and the capacitance of the medium, respectively.
The capacitive behaviour of the cell plasma membrane is responsible for the frequency-dependent current that flows through the cell. Due to the large capacitance and low conductance of the plasma membrane, when the cell is exposed to a low-frequency electric field (10–500 kHz), the plasma membrane acts as an insulator, preventing current from penetrating the cell cytoplasm and passing primarily around the cell [Citation10,Citation52]. At such frequencies, the membrane cell becomes polarized, which hinders the electrical current penetration, and information about the cell size is gained [Citation1]. The electrical double layer (EDL) dominates the system impedance at a low frequency of <100 kHz [Citation10,Citation36]. The membrane capacitance is completely short-circuited at higher frequencies, allowing the penetration of the electric field inside the cytoplasm of the cell and allowing the intracellular characteristics to be studied, for example, specific membrane capacitance (1–5 MHz) () and cytoplasm conductivity (>10 MHz) [Citation23]. By fitting the measured impedance spectra to respective equivalent circuits, the values of all-electric elements (i.e. membrane capacitance () and cytoplasm resistance (
)) in the equivalent circuits were obtained. Thus, the
value can be utilized to determine the specific membrane capacitance (
) of the cell. The specific membrane capacitance is the membrane capacitance per unit surface area, which is an electrical characteristic that varies with the cell’s physiological condition. The
of human RBCs has been studied extensively using impedance cytometry and is found to lie within a broad range
known to be in the range of 7–14 mF/m2 [Citation22,Citation53]. These significant differences may be due to the manner in which the samples were prepared as well as the device system used to collect measurement. Based on the geometrical assumption, the specific membrane capacitance
can be calculated according to:
(6)
(6)
where
is the capacitance of the cell obtained from curve fitting and the radius of a cell represented by r. The typical values for the dielectric parameters for the cell [Citation53]:
= 8.854 × 10⁻¹² Fm−1,
= 80
= 1.6 Sm−1,
= 11
d = 7 nm, r = 3.5 µm, D = 25 µm and g = 15 µm, where d, r, D and g are the membrane thickness of RBC, the radius of RBC, the diameter of the electrode, and the gap between the electrode, respectively.
To obtain the confidence level associated with the simulated ECM fitting result, a regression coefficient measures the degree to which the measurement data match the estimated simulation parameters used. Xest(fi) is estimated using the proposed ECM, and Xexp(fi) represents measurement data. The value of
around 1 indicates that the theoretical model and the measurement data are in an agreement [Citation54].
(7)
(7)
Materials and methods
Cell culture
In the present study, we used two sets of a sample that are PS microbeads in phosphate-buffered saline (PBS) and RBC from whole blood. The PS microbeads with a diameter of 5, 7 and 10 µm (Polysciences, Inc., Warrington, PA, USA) were prepared in three samples of 1 × PBS solution. Before being inserted into the device, each sample was sonicated for at least two minutes to prevent the PS microbeads from aggregating. The number of cells was approximately 7 × 10³ beads/mL for each sample.
The whole blood of a patient was collected from the blood bank at the university clinic of Universiti Teknologi Malaysia (prior to the research, written consent was obtained from the patient, which was approved by UTM authorized person (Supplementary Information: Appendix 1 – Consent Letter) under the project no. Q. J130000.2851.00L23 and Q.J130000.21A2.04E82). The whole blood sample of 1 mL was centrifuged for 10 min at 2000 rpm to separate RBC from other components such as plasma and buffy coats. After centrifugation, the buffy coat and plasma were removed carefully. Then, the RBC was washed three times in PBS with centrifuged for 2 min at 2000 rpm and removed the supernatant. Next, RBCs were resuspended in the PBS (conductivity = 1.6 Sm−1) to obtain approximately 6 × 10³ cells/mL per sample for minimizing the possibility of duplicates. As the ratio of RBCs to WBCs in human blood is generally 1000:1, the existence of WBCs was assumed neglected in these samples. The RBC samples were utilized within 48 h in this study and the diameter of RBC is in the range of 7–8 µm.
Device fabrication
The microfluidic IFC device has been developed by using the standard lithography method. The masks were designed using a layout editing tool (LayoutEditor, 2020, Juspertor GmbH, Unterhaching, Germany). Then, laser lithography equipment (PG501, Heidelberg Instruments, Heidelberg, Germany) was utilized to create two masks (top mask and bottom mask) on the 2.5-inch chromium (Cr) masks. After mask fabrication, the top layer mold was first created based on the two-step lithography technique using SU-8 2025 negative photoresist (MicroChem, Westborough, MA, USA). The first layer of SU-8 was spin-coated on a silicon wafer to obtain a thickness of 25 μm with a 4000 rpm spin speed for 30 s. Following pre-baking, the top layer Cr mask was used to expose the first layer of the microchannel by using a mask aligner (Suss MicroTec MA-6, Garching, Germany) and followed by post-baking with development.
Next, using 1500 rpm spin speed for 30 s, the second layer of SU-8 with 60 μm thicknesses was developed on the first layer microchannel and followed by pre-baked. Next, the substrate of the photoresist layer was aligned with the bottom layer Cr mask and exposed to UV light. Then, the substrate was post-baked with development to produce a top mold master. After that, the bottom mold master with 60 μm thickness was fabricated by following the fabrication step of the top mold master. PDMS was prepared by thoroughly mixing PDMS pre-polymers (SYLGARD184A, Dow Corning Silicones Malaysia, Petaling Jaya, Malaysia) with curing agents (SYLGARD 184B, Dow Corning Silicones Malaysia, Petaling Jaya, Malaysia) in a ratio of 9:1 by weight and poured on both SU-8 mold master. A PDMS microchannel was obtained after curing at 65 °C for 2 h in an oven (Isotherm, Esco, Singapore). The top and bottom sides of PDMS were cleaned with isopropyl (IPA) and sonicated for 10 min. Both clean PDMS microchannels were pre-heated on a hot plate for 5 min at a temperature of 120 °C. After pre-heating, both PDMS microchannels were treated with oxygen plasma (Plasma EtchPE-25, Plasma Etch, Inc., Carson City, NV, USA) for 25 s with oxygen at 10 cm3/min to improve adhesion strength [Citation29].
Both of the PDMS microchannels were sandwiched and post-heated for 15 min at a temperature of 120 °C to obtain the IFC device. The alignment of top and bottom PDMS microchannels was completed in less than two minutes to prevent loss of oxygen plasma effectiveness. The microchannel chip was completed by manual cutting using a flat knife and ruler at the right and left sides to leave a hole (60 μm × 120 μm) for the microneedle. A commercially available tungsten needle (SE-20TB, Signatone, Gilroy, CA, USA) coated with parylene was utilized as a measuring electrode (two microneedles in total). The tip of the tungsten needle was trimmed by using the Focused Ion Beam – Scanning Electron Microscope (FIB-SEM) (Zeiss Crossbeam 340, Oberkochen, Germany) to obtain a flat tip surface with a 25 μm diameter (Figure S4). The length, shank diameter and tip diameter of the tungsten needle are 31.7 mm, 250 μm and 25 μm, respectively. The configuration of dual microneedles was a parallel-facing electrode design.
Experiment setup
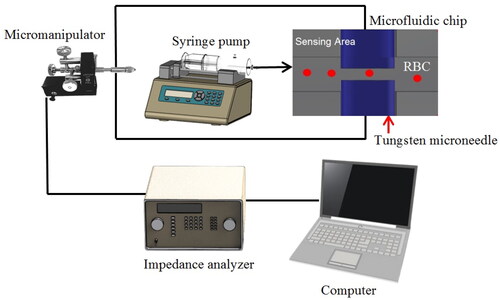
The inverted microscope (IX71, Olympus Corporation, Tokyo, Japan) was utilized to observe the sensing region of the IFC device. For observation and monitoring of the presence of single cells/particles at the sensing area, a high-speed camera (PROMON 501, AOS Technologies AG, Baden, Switzerland) with graphical user interface (GUI) software (AOS imaging studio v4, AOS Technologies AG, Baden, Switzerland) has been utilized. Two tungsten microneedles were inserted into the IFC device through the square holes at both sides of the chip using a micromanipulator (EB-700, Everbeing, Hsinchu, Taiwan) [Citation28]. The gap of the microneedles was fixed at 15 μm. The alignment for the needles gap was obtained by measurement using imaging software (IC Measurement, The Imaging Source Asia Co., Ltd., New Taipei City, Taiwan and AmScope, United Scope LLC, Irvine, CA, USA). The experimental setup is schematically represented in . As an input, the impedance analyser (IM3570 Hioki, Nagano, Japan) was linked with two tungsten microneedles and shown on the computer. The syringe pumps (LEGATO 111, KD Scientific, Holliston, MA, USA) were used to control the microbeads and RBC samples. Two flexible silicon tubes (Silicone Tubing, Puchong, Malaysia) connected to the syringes and waste bottle were inserted into the PDMS device at the inlets for the introduction of liquids and outlet of waste liquids. The alignment for the needles gap was obtained by measurement using imaging software (IC Measurement, The Imaging Source Asia Co., Ltd., New Taipei City, Taiwan).
Figure 2. The schematic diagram for the experiment. The micromanipulator was used to hold and drive the tungsten needles inside the microfluidic channel and the alignment of the needle gap was obtained using imaging software.
Impedance measurement methods
To determine an object’s unknown impedance, a known voltage across the object was applied, and the current flowing through it was recorded. A constant voltage excitation is better suitable for this application since the response current increases as the magnitude of the impedance decreases. Another advantage of utilizing a voltage source is that just the response current may be monitored, as steady voltage excitation in the appropriate frequency range is very straightforward to create [Citation55]. Even though excitation voltage measurement is necessary for more precise IFC measurements, the complexity of the voltage source is much less than that of a current source. Initially, the characterization measurement and calibration of the IFC device were performed using 1 mL of deionized (DI) water and PBS. The frequency sweep in the range of 10 kHz to 3 MHz was used to provide no major shifts over the device impedance [Citation28]. A syringe pump was set at a constant flow rate (6 µL/min) to drive each sample into the IFC microchannel. The impedance of both samples was measured five times.
Meanwhile, for single microbeads detection measurement, three samples of microbeads with a diameter of 5, 7 and 10 µm were prepared for the measurement. 1 mL of each sample flowed inside the IFC microchannel with a 6 µL/min of flow rate. An applied voltage of 1 V AC signal with seven frequencies measurement (10 kHz, 50 kHz, 100 kHz, 500 kHz, 800 kHz, 1 MHz and 2 MHz) is generated by an impedance analyser, which was used to obtain the impedance of single cells/particles at the sensing area. The IFC microchannel device was washed with PBS for 3 min between each microbead sample measurement. The data were collected using the GUI software (v3.10, Hioki E.E. Corporation, Nagano, Japan) of the impedance analyser, and post-processed in OriginPro (OriginLab Corporation, Northampton, MA, USA) and MATLAB (R2019b, MathWorks Inc., Natick, MA, USA).
Furthermore, the RBCs suspended in PBS (conductivity = 1.6 Sm−1) were injected into the IFC and driven along the IFC microchannel under the impact of applied pressure by syringe pumps at the flow rate of 6 µL/min. Several measurement frequency points were selected and approximately 50 cells per frequency were obtained. The measurement frequency was changed incrementally from 10 kHz, 50 kHz, 100 kHz, 500 kHz, 800 kHz, 1 MHz and 2 MHz, and the applied constant voltage was set at 1 V. The selected frequencies from 100 kHz to 2 MHz were used in this study, to concentrate on the impedance variations caused by the membrane lipid and to minimize the effect of electrical double-layer capacitance [Citation56]. With the same procedure for microbead detection, the impedance of single RBCs was measured and collected.
Statistical analyses and curve fitting were performed using OriginPro and Zview (Scribner Associates Inc., Southern Pines, NC, USA). The results are presented in the form of mean ± standard deviation or scatter plots. To perform the measurement, the impedance analyser was self-calibrated before performing the measurement utilizing short and open standard calibration. Furthermore, to calibrate the IFC device, the impedance of a single microbead at a low frequency (100 kHz) has been measured to obtain the calibration curve. All the experiments were conducted with three microfluidic devices at room temperature to verify the device’s repeatability.
Results
Detection of polystyrene (PS) microbeads
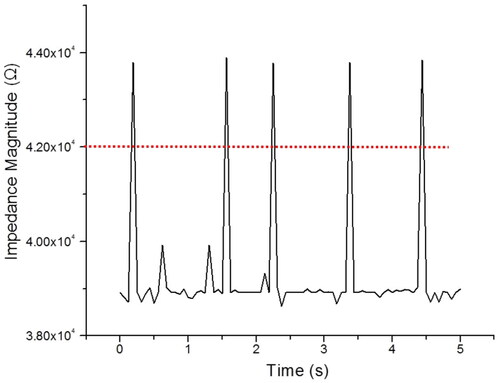
The IFC device was first examined by a 7 µm diameter microbead to validate the sensing capability. The microbead concentrations were in the range of ∼7 × 10² beads/mL. A time trace of 7 µm diameter microbeads travelling inside the IFC device with 6 µL/min of flow rate is shown in . The results show that the single peak (∼4.37 ± 0.02 × 10⁴ Ω) is the signature of a single microbead (7 µm diameter) passing through a sensing area (dual tungsten needle) for a sample five microbeads captured at 500 kHz in one testing. The impedance magnitude threshold for 7 µm diameter microbead is set at 4.20 × 10⁴ Ω, lower than that considered as debris. As was verified optically, all the measured peaks corresponded to the microbeads through the sensing area. Afterward, the IFC device was washed with DI water followed by PBS at a maximum flow rate (0.3 mL/min) before proceeding to the next experiment [Citation28]. The sensitivity of the IFC device characterization is discussed in Section S.5 of Supplementary Information (Tables S1 and S2).
Figure 3. The detection of microbeads of 7 µm size at the detection area based on impedance change of the medium. The red dash line is set as the impedance magnitude threshold of 7 µm diameter microbeads and frequency measurement at 500 kHz.
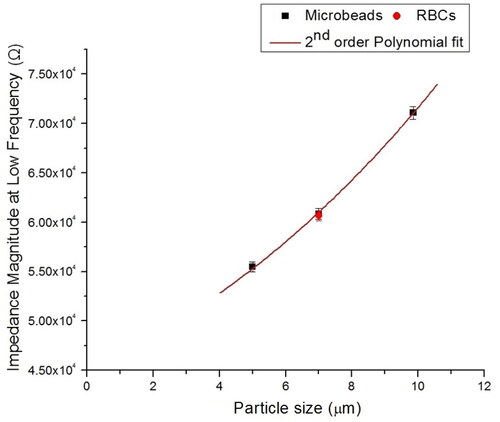
For the calibration of the IFC device, each sample of PS microbeads (5, 7 and 10 µm) and RBCs were mixed and suspended with 1 × PBS solution at several cell/bead approximately 5 × 10² cell/mL each sample. The calibration curve is used for experimental data measurement of the particles of interest (e.g. RBCs). illustrates the mix of both types of particles inside the IFC device. The mixed PS beads and RBCs sample was inserted into the device and flowed through the detection area to determine the magnitude of the impedance (ǀZǀ) value based on cell size (volume) at a low frequency of 100 kHz with 6 µL/min of flow rate. A good correlation is found between PS microbeads (5, 7 and 10 µm) and RBCs at low-frequency impedance data (size). The result is shown in , where the mean ± standard deviation of the PS microbeads and RBCs for approximately 50 individual events, measured at low frequency (100 kHz) is plotted as the size of particle versus impedance magnitude (ǀZǀ). A calibration curve was obtained by fitting a second-order polynomial to the bead results [Citation21]. Investigation of the low-frequency impedance data illustrates a significant overlap between 7 µm diameter microbead and RBCs, since the size of both particles is nearly the same diameters. The calibration curve has been utilized as a reference for RBC detection measurement based on the impedance of cell size. PS microbeads are commonly employed as benchmarks during IFC studies and should be electrically isolated at both high and low frequencies. Thus, a calibration using microbeads can serve as a standard for comparison with cells.
Figure 4. The mixed PS beads and RBCs suspending inside the microchannel of the IFC device. ‘Green’, ‘black’, ‘blue’ and ‘red’ box represent RBCs, 5 µm microbead, 7 µm microbead and 10 µm microbead, respectively.
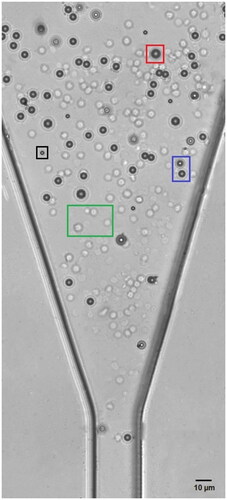
Figure 5. Calibration data for the device at low-frequency measurement (100 kHz). Three different sizes of PS beads and RBCs were flowed inside the microchannel to measure the magnitude of the impedance and obtain the calibration curve. The calibration curve was utilized to determine the magnitude of impedance RBC.
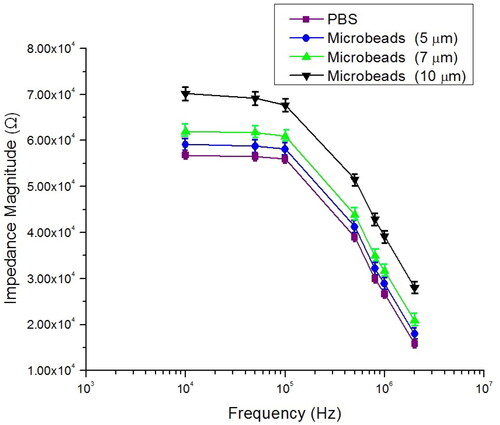
The experiment was performed three times to produce a consistent measurement, and each time using a new sample and a clean device. The measured microbeads impedance changes are in agreement with the calibration curve. It is well known as the IFC principle that under low excitation frequency, the impedance magnitude was measured based on the size of the particles [Citation21,Citation57]. We demonstrated that the magnitude of the impedance change is influenced significantly by the particle size at a low stimulation frequency of 100 kHz. The capability of IFC has been shown further by mixing three different sizes of microbeads. Due to the limit of available equipment setup, the IFC device was tested at the frequency range between 10 kHz and 2 MHz. The mixing sample flowed through the IFC microchannel, and the magnitude of the impedance was recorded at seven frequency measurements. shows well-differentiated spectrums of impedance magnitude in measured microbeads with a diameter of 5, 7 and 10 μm between 100 kHz and 2 MHz. As demonstrated, various sizes of microbeads can be distinguished by different impedance spectra. The impedance of PBS is used as a reference. The mean standard deviation of the impedance magnitude represented each data point for approximately 50 individual events (each size of microbeads). The total data set depicted in the figure is the average frequency-dependent impedance of the sample. One set of measurements takes around 6 min to complete each size of microbeads, which has approximately 50 individual events. As shown in , seven data sets of frequency measurement complete spectrum take 45 min to record. The impedance change (ΔZ = Zmix – Zsolution) of the presence microbeads with the absence microbeads was found to be linearly decreased with decreasing frequency. In addition, microbeads with different sizes can be clearly distinguished by the impedance magnitude changes at any frequency measurement. The individual impedance magnitude of each size of microbeads and RBCs at low frequency (100 kHz) and high frequency (2 MHz) has been shown in Supplementary Information (Figures S5 and S6).
Figure 6. Impedance spectrum of three different sizes of microbeads (5, 7 and 10 µm).
Detection of human red blood cells (RBCs)
To evaluate the performance of the fabricated IFC device for practical application in human cell detection, human RBCs were utilized because they are a readily available source of particles with generally homogenous and strong-defined dielectric characteristics. A sinusoidal voltage (1 V) with five frequencies measurement was applied to dual microneedles. The RBCs in the PBS solution were pumped through the IFC device at a flow rate of 6 µL/min and blocked the electric field, which caused the current in the circuit loop to drop (Figure S7). The measured impedance change of the medium was as an RBC detected at the sensing area. Thus, the impedance of each RBC detected event was obtained at five frequencies (100 kHz, 500 kHz, 800 kHz, 1 MHz and 2 MHz) across two decades, thereby creating multiple single-cell data points. The frequency was purposely selected to minimize the effect of the EDL on the electrode surface, which leads to an increase in sensitivity.
shows the impedance magnitude profile of a single RBC pass through the dual microneedle within 5 s. The circle at the peak of the signal indicated the RBCs pass through the sensing area. Approximately, 4–5 RBCs passing through the sensing area are measured. Since the size of RBCs is in the range (of 6–8 µm), in this study, we only focus on the impedance value of 7 µm diameter RBCs. In these experiments, the size of single RBCs was monitored by observation and through impedance measurement based on reference microbead. The impedance of 7 µm microbeads is used as reference particles because the microbeads have a fixed size distribution and consistent impedance throughout all measurement ranges [Citation35,Citation58]. As representative data, illustrates the mean ± standard deviation of the total outcome of our experiment for RBC detection in the range of frequency 10 kHz to 2 MHz. Approximately, 50 individual RBCs impedances were recorded at seven discrete frequencies. The impedance magnitude shows no significant difference at low frequencies (100 kHz). Meanwhile, increasing the frequency above 100 kHz, reduces the magnitude of the RBCs impedance because the RBCs are capacitive.
Figure 7. Impedance magnitude profiles (at five frequencies) measured within 5 s with 4–5 cells passing through the detection area. Impedance profiles of different frequencies are plotted in different colours.
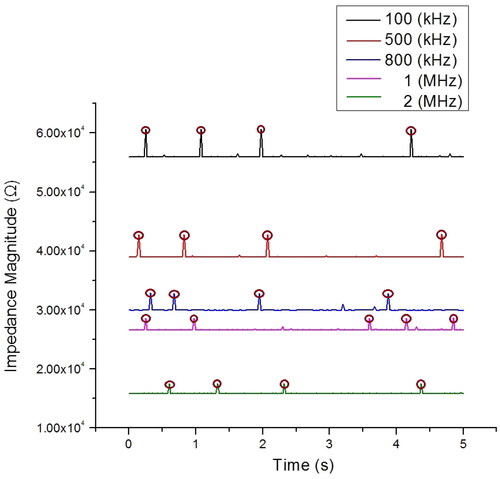
Figure 8. (a) Total impedance spectrum of RBC at seven frequencies measurement. With an increase in frequency, the measurable change in impedance decreases. (b) Threshold for single-cell RBC based on impedance change (ΔZ) set in the range 3850–3940 Ω based on data collected at 500 kHz.
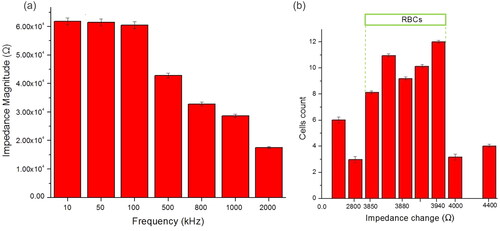
Furthermore, to discriminate the single RBCs with debris (e.g. PDMS debris and cell clusters), a threshold based on impedance change (ΔZ) of the sensing area due to the presence of the cell has been set. shows cell counts based on the impedance change at a frequency measurement of 500 kHz. The trigger width (green) sets the threshold for an accepted single RBC cell. The impedance change (ΔZ) of a single RBC lies between 3850 and 3940 Ω. From the 63 detected peaks, 50 cells were identified based on the size and cell properties information obtained at the frequency of 500 kHz. Meanwhile, the rest are considered debris or clumping cells (ΔZ smaller or bigger than threshold width). In addition, the threshold for a single RBC at frequencies 10 kHz, 50 kHz, 100 kHz, 800 kHz, 1 MHz and 2 MHz is presented in Figure S8.
Detection and discrimination of RBCs with 7 μm diameter microbeads
To investigate discrimination capability, the impedance measurement of RBCs and 7 μm diameter microbeads was performed by a combination (1:1 ratio) of human RBCs and 7 μm diameter microbeads at low and high frequency, 100 kHz and 2 MHz, respectively. The mixture of RBCs and 7 μm diameter microbeads was inserted into the IFC device at a flow rate of 6 µL/m and approximately 40 cells/particle was determined. In low frequencies (10–500 kHz), the existence of an intact lipid membrane makes biological cells electrically insulating [Citation59]. The impedance signal measured within this frequency range is associated with cell size [Citation14]. At high frequencies (1–5 MHz), the capacitance of the cell membrane causes a reactance peak in the imaginary component of the signal, which occurs directly before the membrane capacitance is effectively short-circuited [Citation14]. The ratio of impedance magnitude at high to low frequency (|Z|high/|Z|low) or the so-called |Z| opacity [Citation21,Citation30] provides a parameter that is independent of cell size, reflecting changes in the cell membrane. The cell membrane functioned as an insulator and screened current flow at low frequencies, as illustrated in . These results indicate that the impedance measurement was highly dependent on the cell volume. Due to the comparable sizes of the RBCs and 7 µm diameter microbeads, the observed impedance was near overlapped.
Figure 9. Scatter plot of opacity against impedance magnitude at low frequency (100 kHz) for a mixture of RBCs and 7 µm diameter microbeads. Opacity is defined as the ratio of the high-frequency to the low-frequency impedance, which indicates changes in the cell membrane and the independency of cell size.
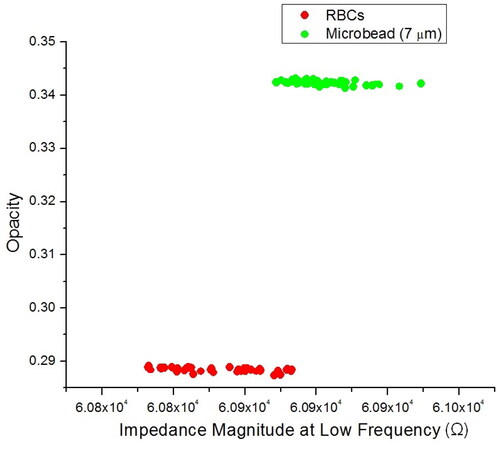
The cell membranes were transparent to the electric current when frequencies passed through dielectric relaxation since the membrane capacitance could be pierced and therefore, the cell interior information was shown by the impedance measurement. Human RBCs exhibit β-dispersion with a typical relaxation frequency of about 1 MHz [Citation60]. The relative opacities found in this IFC device at 2 MHz are 0.285 for RBCs and 0.345 for 7 µm diameter microbeads. As a result, the RBCs and 7 µm diameter microbeads could be differentiated at 2 MHz because the RBCs had larger cytoplasm conductivity than the non-conducting bulk material of the beads [Citation61]. Then, we demonstrated the opacity of three different diameters of microbeads (5, 7 and 10 μm) with RBCs (see Figure S9 in Supplementary Information). It shows the correlation scatter plot of impedance magnitude measured at high and low frequencies for these three types of beads, shows distinct clusters corresponding to the increased volume of the beads, and the fitting line with constant slope denotes the homogeneous dielectric properties of these beads made of the same material. The results are comparable with other reported works [Citation20].
Discussion on the implications of the findings
Determination of specific membrane capacitance
The impedance magnitude spectra of PBS and RBCs as a function of frequency are shown in . The standard deviation is indicated by the error bar (n = 50). In addition, because the electrical double-layer capacitance electrode dominated the overall impedance in the low-frequency region (ω < 100 kHz), while the cytoplasm characteristics can be determined in the high-frequency region (ω > 10 MHz) [Citation62], we limited the frequency region between 100 kHz and 2 MHz to aim at the impedance variations produced by the membrane lipid and reduce the effect of the double-layer capacitance. The electrical double-layer capacitance minimization would lead to an increase in the measurement sensitivity [Citation63]. In the absence of a cell, the impedance of PBS has three components, which are the medium resistance (), medium capacitance (
) and electric double layer capacitance of electrode (
) (see ). The value of measured impedance magnitude at PBS is constant in the low frequency domains (55.2 ± 0.75 kΩ at 100 kHz), which can be modelled as a pure resistor (
). The average value is in agreement with previously published works [Citation64,Citation65]. The effect of EDL
set at 5.8 µF, which is fitting through the impedance measurement in the low frequency range (10–104 Hz) when the microchannel is filled with the buffer solution (PBS) [Citation63,Citation66] (see supplementary Figure S10).
Figure 10. Measurement impedance magnitude of PBS and RBCs at selected frequency point between 100 kHz and 2 MHz.
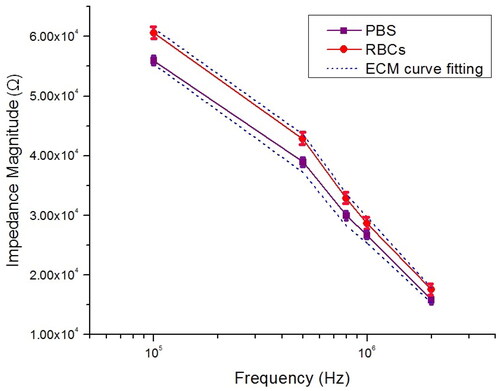
Meanwhile, the frequency of transition at which impedance magnitude begins to drop is around 100 kHz. The impedance magnitude decreased (15.5 ± 0.85 kΩ at 2 MHz) at the high-frequency domain, indicating the presence of a capacitance ( The ECM without cell was utilized to fit the measured impedance spectrum to determine the electric component of
and
The obtained value of
and
is 57.6 ± 0.5 kΩ and 4.2 ± 0.4 pF, respectively, with all fitting regression coefficients higher than 0.99. As an RBC gets present in the sensing area, the impedance magnitude of the system increases which is contributed by the RBCs in addition to
and
The impedance of the presence RBC can be modelled as a cytoplasm resistance
) in series with membrane capacitance (
(see ) [Citation63,Citation67] and the total impedance can be determined using EquationEquation (5)
(5)
(5) . In addition, the impedance magnitude
can be calculated using EquationEquation (4)
(4)
(4) . The local ionic environment at the electrode/solution interface is also affected by the presence of cells, which can change the
and
and raise electrode impedance [Citation68]. The value of measured impedance magnitude at RBCs is also constant at low-frequency domains (60.2 ± 0.75 kΩ at 100 kHz), modelled as two resistors
and
in parallel. Meanwhile at high frequency domains, a decrease in impedance magnitude occurred (17.2 ± 0.55 kΩ at 2 MHz). When an RBC was in the detection area, the impedance of the mixture medium was measured and fitted to ECM with cell to determine the
and
We tested RBC cells (n = 50) with five frequency points, and the
and
were determined to be 89.4 ± 0.5 kΩ and 1.45 ± 0.05 × 10⁻¹² F, respectively, with all fitting the regression coefficients,
at 0.9895. The consistency between the measured and fitted impedance spectra demonstrated the viability of the equivalent circuit for reflecting the impedance characteristics of the IFC device with and without cell. shows the simulated values of all electric elements in the ECM (with and without cell),
and
Table 1. The simulated value of the electrical element in the ECM with and without RBC.
Leveraging EquationEquation (6)(6)
(6) ,
of RBCs was further translated to the specific membrane capacitance
based on the geometrical assumption. The determined specific membrane capacitance
is 9.42 mF/m2 and the calculated values of this RBC cell fall into ranges reported by another IFC technique, for example, 7–14.3 mF/m2 [Citation22,Citation69–71]. The membrane capacitance
is of particular importance since the characteristics of membranes can only be investigated through more sophisticated approaches like electron microscopy and chemical analysis otherwise. From the results, it can be concluded that the simulation of the proposed ECM with fitting electrical parameters is in agreement with experimental impedance data obtained by the IFC device at five frequencies measurement point.
Conclusions and future perspective
The microfluidic IFC device rises as an efficient, environmentally friendly, and reliable tool to study single-cell suspension. As cell membranes restrict low-frequency currents while passing high-frequency currents, measurements from several frequency domains will offer information on the membrane’s and cytoplasm’s dielectric characteristics. We demonstrated that a microfluidic IFC device could well be utilized to determine the dielectric characteristics of single RBCs. These experiments reveal that the single RBC cell and single microbeads are successfully measured by a dual microneedle connected to an impedance analyser. Its impedance was measured at frequencies between 10 kHz and 2 MHz. The reusable tungsten microneedles are used as measuring electrodes attached to the disposable PDMS microchannel.
Geometrical assumption and electrical equivalent models were developed to quantify the specific membrane capacitance from the experimental impedance data. The specific membrane capacitance was found to be in range, as reported in previous work. In addition, despite the lower fabrication cost, this device demonstrated the core functionality of the proposed sensor, which is to differentiate the RBCs and microbeads. Overall, we believe that the device is well suited for early cancer cell detection and water quality applications in developing countries since it considerably decreases manufacturing costs (by 20%, relying on facility leasing and raw material consumption).
Author contributions
M.A.M. and M.R.A. are involved in the research conceptualization and methodology, and fabrication of the integrated dual microneedles–microfluidic system. M.A.M., M.R.A., M.P. and S.S.R.K. were involved in the design validity and visualization of the microchannel, microfabrication and assembly of the electrodes, as well as analysis and demonstration of the three-dimensional electrode configuration. M.A.M. and M.R.A., involved in the measurement of electrical properties. M.A.M., M.R.A., M.P. and S.S.R.K. are involved in validation, visualization, formal analysis of the research, and project administration. M.A.M., M.R.A., M.P. and S.S.R.K. involved in the writing/review and editing of the original draft preparation of the manuscript. Supervision, resources and funding acquisition of the project were managed by M.R.A., M.P. and S.S.R.K. All authors have read and agreed to the submitted version of the manuscript.
Supplemental Material
Download MS Word (1.1 MB)Acknowledgements
We would like to express our gratitude to Universiti Teknologi Malaysia and the Technical University of Liberec for financing this research and providing continued support. We also thank to Mr. Shafi and Mr. Nadzri from Pusat Kesihatan Universiti Teknologi Malaysia for providing the blood samples. This project is supported by the Ministry of Higher Education of Malaysia and Universiti Teknologi Malaysia under the Professional Development Research University Grant [no. Q.J130000.21A2.06E67] in the project ‘Development of Microfluidic Systems in PDMS for Microalgae Detection and Separation for Renewal Energy Application’, as well as the Ministry of Education, Youth, and Sports of the Czech Republic and the European Union (European Structural and Investment Funds Operational Program Research, Development, and Education) in the framework of the project ‘Modular platform for autonomous chassis of specialized electric vehicles for freight and equipment transportation’, Reg. No. CZ.02.1.01/0.0/0.0/16_025/0007293. The authors acknowledge the support of the Minister of Transport and Construction of the Slovak Republic and the European Union in the Transport Sector and Information Technology in the frames of the project ‘Adaptation of twenty-first century technologies for non-conventional low-emission vehicles based on composite materials’, Reg. No. NFP313010BXF3 by OPII – VA/DP/2021/9.3-01. The projects support the fabrication of the devices and electrical system, measurement of the data, demonstration of the results, preparation and evaluation of the research draft, and the financial support for the official process of the publication.
Disclosure statement
No potential conflict of interest was reported by the author(s).
Data availability statement
The pre-print version of the manuscript is available at Research Square: https://assets.researchsquare.com/files/rs-1660328/v1_covered.pdf?c=1653060126. Data available on request from the authors.
References
- Ostermann M, Sauter A, Xue Y, et al. Label-free impedance flow cytometry for nanotoxicity screening. Sci Rep. 2020;10(1):142. doi: 10.1038/s41598-019-56705-3.
- Yang J, Huang Y, Wang X, et al. Dielectric properties of human leukocyte subpopulations determined by electrorotation as a cell separation criterion. Biophys J. 1999;76(6):3307–3314. doi: 10.1016/S0006-3495(99)77483-7.
- Han S-I, Joo Y-D, Han K-H. An electrorotation technique for measuring the dielectric properties of cells with simultaneous use of negative quadrupolar dielectrophoresis and electrorotation. Analyst. 2013;138(5):1529–1537. doi: 10.1039/c3an36261b.
- Hölzel R. Non-invasive determination of bacterial single cell properties by electrorotation. Biochim Biophys Acta. 1999;1450(1):53–60. doi: 10.1016/s0167-4889(99)00036-1.
- Vahey MD, Voldman J. An equilibrium method for continuous-flow cell sorting using dielectrophoresis. Anal Chem. 2008;80(9):3135–3143. doi: 10.1021/ac7020568.
- Xie X, Zhang Z, Ge X, et al. Particle self-aligning, focusing, and electric impedance microcytometer device for label-free single cell morphology discrimination and yeast budding analysis. Anal Chem. 2019;91(21):13398–13406. doi: 10.1021/acs.analchem.9b01509.
- Liu J, Qiang Y, Alvarez O, et al. Electrical impedance microflow cytometry with oxygen control for detection of sickle cells. Sens Actuators B Chem. 2018;255(Pt 2):2392–2398. doi: 10.1016/j.snb.2017.08.163.
- Sun T, Morgan H. Single-cell microfluidic impedance cytometry: a review. Microfluid Nanofluid. 2010;8(4):423–443. doi: 10.1007/s10404-010-0580-9.
- Mansor MA, Ahmad MR. Single cell electrical characterization techniques. Int J Mol Sci. 2015;16(6):12686–12712. doi: 10.3390/ijms160612686.
- Honrado C, Bisegna P, Swami NS, et al. Single-cell microfluidic impedance cytometry: from raw signals to cell phenotypes using data analytics. Lab Chip. 2021;21(1):22–54. doi: 10.1039/d0lc00840k.
- Cheung KC, Di Berardino M, Schade-Kampmann G, et al. Microfluidic impedance-based flow cytometry. Cytometry A. 2010;77(7):648–666.
- Gucker FT, O’Konski CT, Pickard HB, et al. A photoelectronic counter for colloidal particles. J Am Chem Soc. 1947;69(10):2422–2431. doi: 10.1021/ja01202a053.
- Song H, Wang Y, Rosano JM, et al. A microfluidic impedance flow cytometer for identification of differentiation state of stem cells. Lab Chip. 2013;13(12):2300–2310. doi: 10.1039/c3lc41321g.
- Gawad S, Schild L, Renaud PH. Micromachined impedance spectroscopy flow cytometer for cell analysis and particle sizing. Lab Chip. 2001;1(1):76–82. doi: 10.1039/b103933b.
- Esfandyarpour R, Javanmard M, Koochak Z, et al. Nanoelectronic impedance detection of target cells. Biotechnol Bioeng. 2014;111(6):1161–1169.
- Zhao Y, Liu Q, Sun H, et al. Electrical property characterization of neural stem cells in differentiation. PLOS One. 2016;11(6):e0158044. doi: 10.1371/journal.pone.0158044.
- Han Z, Chen L, Zhang S, et al. Label-free and simultaneous mechanical and electrical characterization of single plant cells using microfluidic impedance flow cytometry. Anal Chem. 2020;92(21):14568–14575. doi: 10.1021/acs.analchem.0c02854.
- Wang K, Zhao Y, Chen D, et al. Specific membrane capacitance, cytoplasm conductivity and instantaneous young’s modulus of single tumour cells. Sci Data. 2017;4:170015. doi: 10.1038/sdata.2017.15.
- Zhao Y, Chen D, Luo Y, et al. Simultaneous characterization of instantaneous Young’s modulus and specific membrane capacitance of single cells using a microfluidic system. Sensors. 2015;15(2):2763–2773. doi: 10.3390/s150202763.
- Cheung K, Gawad S, Renaud P. Impedance spectroscopy flow cytometry: on-chip label-free cell differentiation. Cytometry A. 2005;65(2):124–132. doi: 10.1002/cyto.a.20141.
- Holmes D, Pettigrew D, Reccius CH, et al. Leukocyte analysis and differentiation using high speed microfluidic single cell impedance cytometry. Lab Chip. 2009;9(20):2881–2889. doi: 10.1039/b910053a.
- Spencer D, Morgan H. High-speed single-cell dielectric spectroscopy. ACS Sens. 2020;5(2):423–430. doi: 10.1021/acssensors.9b02119.
- McGrath JS, Honrado C, Moore JH, et al. Electrophysiology-based stratification of pancreatic tumorigenicity by label-free single-cell impedance cytometry. Anal Chim Acta. 2020;1101:90–98. doi: 10.1016/j.aca.2019.12.033.
- Emaminejad S, Javanmard M, Dutton RW, et al. Microfluidic diagnostic tool for the developing world: contactless impedance flow cytometry. Lab Chip. 2012;12(21):4499–4507. doi: 10.1039/c2lc40759k.
- Wang J, Chatrathi MP, Mulchandani A, et al. Capillary electrophoresis microchips for separation and detection of organophosphate nerve agents. Anal Chem. 2001;73(8):1804–1808. doi: 10.1021/ac001424e.
- Park K, Suk H-J, Akin D, et al. Dielectrophoresis-based cell manipulation using electrodes on a reusable printed circuit board. Lab Chip. 2009;9(15):2224–2229. doi: 10.1039/b904328d.
- Fu Y, Yuan Q, Guo J. Lab-on-PCB-based micro-cytometer for circulating tumor cells detection and enumeration. Microfluid Nanofluid. 2017;21(2):1–4. doi: 10.1007/s10404-017-1854-2.
- Mansor MA, Takeuchi M, Nakajima M, et al. Electrical impedance spectroscopy for detection of cells in suspensions using microfluidic device with integrated. Appl Sci. 2017;7(2):170. doi: 10.3390/app7020170.
- Mansor MA, Takeuchi M, Nakajima M, et al. A novel integrated dual microneedle-microfluidic impedance flow cytometry for cells detection in suspensions. Int J Electr Comput Eng. 2017;7(3):1513. doi: 10.11591/ijece.v7i3.pp1513-1521.
- Morgan H, Sun T, Holmes D, et al. Single cell dielectric spectroscopy. J Phys D Appl Phys. 2007;40(1):61–70. doi: 10.1088/0022-3727/40/1/S10.
- Petchakup C, Li H, Hou HW. Advances in single cell impedance cytometry for biomedical applications. Micromachines. 2017;8(3):87. doi: 10.3390/mi8030087.
- Zhu S, Zhang X, Zhou Z, et al. Microfluidic impedance cytometry for single-cell sensing: review on electrode configurations. Talanta. 2021;233:122571. doi: 10.1016/j.talanta.2021.122571.
- Sun T, Green NG, Gawad S, et al. Analytical electric field and sensitivity analysis for two microfluidic impedance cytometer designs. IET Nanobiotechnol. 2007;1(5):69–79. doi: 10.1049/iet-nbt:20070019.
- Holmes D, Morgan H. Single cell impedance cytometry for identification and counting of CD4 T-cells in human blood using impedance labels. Anal Chem. 2010;82(4):1455–1461. doi: 10.1021/ac902568p.
- Honrado C, Ciuffreda L, Spencer D, et al. Dielectric characterization of Plasmodium falciparum-infected red blood cells using microfluidic impedance cytometry. J R Soc Interface. 2018;15:20180416. doi: 10.1098/rsif.2018.0416.
- Xu Y, Xie X, Duan Y, et al. A review of impedance measurements of whole cells. Biosens Bioelectron. 2016;77:824–836. doi: 10.1016/j.bios.2015.10.027.
- Balakrishnan SG, Ahmad MR, Koloor SSR, et al. Separation of ctDNA by superparamagnetic bead particles in microfluidic platform for early cancer detection. J Adv Res. 2021;33:109–116. doi: 10.1016/j.jare.2021.03.001.
- Asami K. Characterization of heterogeneous systems by dielectric spectroscopy. Prog Polym Sci. 2002;27(8):1617–1659. doi: 10.1016/S0079-6700(02)00015-1.
- Asami K. Dielectric dispersion in biological cells of complex geometry simulated by the three-dimensional finite difference method. J Phys D Appl Phys. 2006;39(3):492–499. doi: 10.1088/0022-3727/39/3/012.
- Fricke H. A mathematical treatment of the electric conductivity and capacity of disperse systems. II. The capacity of a suspension of conducting spheroids surrounded by a non-conducting membrane for a current of low frequency. Phys Rev. 1925;26(5):678–681. doi: 10.1103/PhysRev.26.678.
- Nasir N, Al Ahmad M. Cells electrical characterization: dielectric properties, mixture, and modeling theories. J Eng. 2020;2020:1–17. doi: 10.1155/2020/9475490.
- Asami K. Characterization of biological cells by dielectric spectroscopy. J Non-Cryst Solids. 2002;305(1–3):268–277. doi: 10.1016/S0022-3093(02)01110-9.
- Schwan HP. Electrical properties of tissue and cell suspensions. Adv Biol Med Phys. 1957;5:147–209.
- Sun T, Holmes D, Gawad S, et al. High speed multi-frequency impedance analysis of single particles in a microfluidic cytometer using maximum length sequences. Lab Chip. 2007;7(8):1034–1040. doi: 10.1039/b703546b.
- Sun TAO, Green NG, Morgan H. Analytical and numerical modeling methods for impedance analysis of single cells on-chip. Nano. 2008;3(1):55–63. doi: 10.1142/S1793292008000800.
- Lin Z, Lin SY, Xie P, et al. Rapid assessment of surface markers on cancer cells using immuno-magnetic separation and multi-frequency impedance cytometry for targeted therapy. Sci Rep. 2020;10(1):3015. doi: 10.1038/s41598-020-57540-7.
- Fan W, Chen X, Ge Y, et al. Single-cell impedance analysis of osteogenic differentiation by droplet-based microfluidics. Biosens Bioelectron. 2019;145:111730. doi: 10.1016/j.bios.2019.111730.
- Li H, Multari C, Palego C, et al. Differentiation of live and heat-killed E. coli by microwave impedance spectroscopy. Sens Actuators B Chem. 2018;255:1614–1622. doi: 10.1016/j.snb.2017.08.179.
- Foster KR, Schwan HP. Dielectric properties of tissues and biological materials: a critical review. Crit Rev Biomed Eng. 1989;17(1):25–104.
- Zhao Y, Zhao XT, Chen DY, et al. Tumor cell characterization and classification based on cellular specific membrane capacitance and cytoplasm conductivity. Biosens Bioelectron. 2014;57:245–253. doi: 10.1016/j.bios.2014.02.026.
- Iqbal SMA, Butt NZ. Design and analysis of microfluidic cell counter using spice simulation. SN Appl Sci. 2019;1(10):1–10. doi: 10.1007/s42452-019-1327-1.
- Grimnes S, Martinsen OG. Bioimpedance and bioelectricity basics. Academic Press; 2000. doi: 10.1016/B978-0-12-374004-5.00006-4.
- Mahesh K, Varma M, Sen P. Double-peak signal features in microfluidic impedance flow cytometry enable sensitive measurement of cell membrane capacitance. Lab Chip. 2020;20(22):4296–4309. doi: 10.1039/d0lc00744g.
- Chan K, Morgan H, Morgan E, et al. Measurements of the dielectric properties of peripheral blood mononuclear cells and trophoblast cells using AC electrokinetic techniques. Biochim Biophys Acta. 2000;1500(3):313–322. doi: 10.1016/s0925-4439(99)00115-5.
- Ojarand J, Min M, Koel A. Multichannel electrical impedance spectroscopy analyzer with microfluidic sensors. Sensors. 2019;19:1–28. doi: 10.3390/s19081891.
- Chen L, Han Z, Fan X, et al. An impedance-coupled microfluidic device for single-cell analysis of primary cell wall regeneration. Biosens Bioelectron. 2020;165:112374. doi: 10.1016/j.bios.2020.112374.
- Zheng S, Liu M, Tai YC. Micro coulter counters with platinum black electroplated electrodes for human blood cell sensing. Biomed Microdevice. 2008;10(2):221–231. doi: 10.1007/s10544-007-9128-5.
- Spencer D, Hollis V, Morgan H. Microfluidic impedance cytometry of tumour cells in blood. Biomicrofluidics. 2014;8(6):064124. doi: 10.1063/1.4904405.
- Tan Q, Ferrier GA, Chen BK, et al. Quantification of the specific membrane capacitance of single cells using a microfluidic device and impedance spectroscopy measurement. Biomicrofluidics. 2012;6(3):34112. doi: 10.1063/1.4746249.
- Bone S, Ginzburg BZ, Morgan H, et al. Time-domain dielectric spectroscopy applied to cell suspensions. Phys Med Biol. 1993;38(4):511–520. doi: 10.1088/0031-9155/38/4/003.
- Han C, Liang Z, Yu D, et al. A single-cell impedance micro-cytometer featuring 3D electro-fluidic structures monolithically integrated within silver PDMS. 2019 20th International Conference on Solid-State Sensors, Actuators Microsystems Eurosensors XXXIII, Transducers 2019 Eurosensors XXXIII; IEEE; 2019. p. 9–12.
- McGrath JS, Honrado C, Spencer D, et al. Analysis of parasitic protozoa at the single-cell level using microfluidic impedance cytometry. Sci Rep. 2017;7(1):2601. doi: 10.1038/s41598-017-02715-y.
- Feng Y, Huang L, Zhao P, et al. A microfluidic device integrating impedance flow cytometry and electric impedance spectroscopy for high-efficiency single-cell electrical property measurement. Anal Chem. 2019;91(23):15204–15212. doi: 10.1021/acs.analchem.9b04083.
- Cho S, Thielecke H. Micro hole-based cell chip with impedance spectroscopy. Biosens Bioelectron. 2007;22(8):1764–1768.
- Chen J, Zheng Y, Tan Q, et al. A microfluidic device for simultaneous electrical and mechanical measurements on single cells. Biomicrofluidics. 2011;5(1):14113.
- Carminati M, Ferrari G, Vahey MD, et al. Miniaturized impedance flow cytometer: design rules and integrated readout. IEEE Trans Biomed Circuits Syst. 2017;11(6):1438–1449. doi: 10.1109/TBCAS.2017.2748158.
- Jang L-S, Wang M-H. Microfluidic device for cell capture and impedance measurement. Biomed Microdevice. 2007;9(5):737–743.
- Mamouni J, Yang L. Interdigitated microelectrode-based microchip for electrical impedance spectroscopic study of oral cancer cells. Biomed Microdevice. 2011;13(6):1075–1088. doi: 10.1007/s10544-011-9577-8.
- Asami K, Takahashi Y, Takashima S. Dielectric properties of mouse lymphocytes and erythrocytes. Biochim Biophys Acta. 1989;1010(1):49–55. doi: 10.1016/0167-4889(89)90183-3.
- Lisin R, Ginzburg BZ, Schlesinger M, et al. Time domain dielectric spectroscopy study of human cells. I. Erythrocytes and ghosts. Biochim Biophys Acta. 1996;1280(1):34–40. doi: 10.1016/0005-2736(95)00266-9.
- Gimsa J, Schnelle T, Zechel G, et al. Dielectric spectroscopy of human erythrocytes: investigations under the influence of nystatin. Biophys J. 1994;66(4):1244–1253. doi: 10.1016/S0006-3495(94)80908-7.